PALANTIR reversal island patternJust remember that Palantir has a reversal island pattern with the candlestick of December the 2nd. Stop loss at $21.12.
Search in ideas for "CANDLESTICK"

analyse week The trend is down, there is a corrective wave with the end of the weekly Bianbari candlestick, indicating the continuation of the downtrend targeting 134’30’0

$124 Tuesday Based on pure candlestick analysis, a specialty of mine. I see Apple hitting $124 tomorrow, based on the 2 previous 4 hour candles, you can see they have small bearish bodies and bullish wicks that are larger than the body. This indicates that price has potential to rise to where the wicks have formed. The highest wick is near $123.62 however $124 can be achieved easily.
Very exciting trend to see as I have 7 calls for AAPL to hit $124 by Friday, looking to run away with a nice profit tomorrow.
Stay tuned for gains/losses.
Comment your thoughts below
Thank You

Daily Candlestick PredictionBig fall projected for COF Tuesday. Comment your thoughts below and check out the chart I created supporting why I am so bearish on COF.


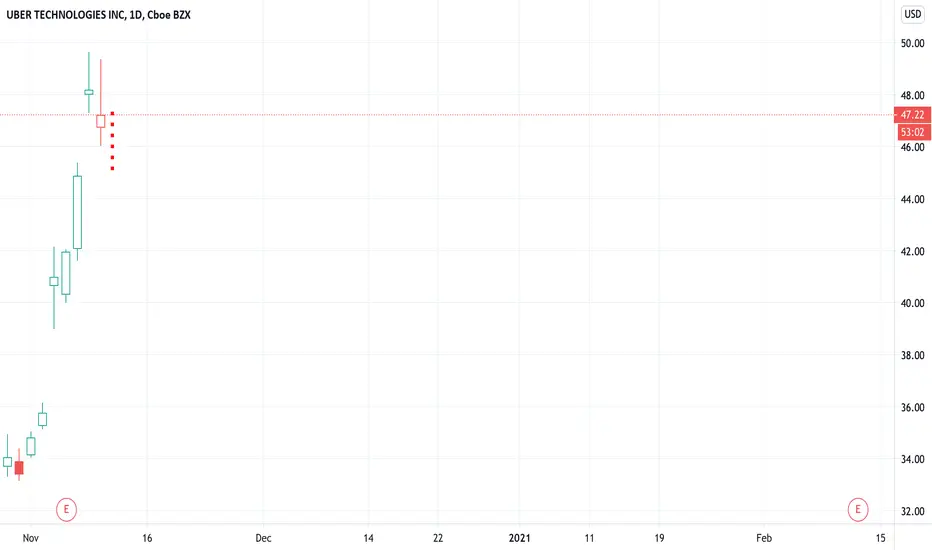
Uber Daily Candlestick PredictiomThis is my candle stick prediction for Uber for 11/11. I will keep this segment going until I my accuracy falls below 50%.
Evening Star Candlestick Pattern?If today's candle closes at least on this target, this pattern is valid. Then with high probability we are at the top of the wave (b) and it will follow (c). If this formation is confirmed, I will show the target of wave (c). Fear&greed index was 90 yesterday. Ideally, this is the end of the US election, isn't it a coincidence?

DROP and BounceAs noticed the candlestick patterns i highlighted a very pivotal area on the chart
I expect a Short Drop and bounce UPward to consolidate

Gold 4h inside Bar Break upGold 4h inside Bar Break up
Gold fromed 4h Inside Bar and choose to break up
And the Mother is a strong Engulfing Candlestick
As well
Therefore, we could usd Inside Bar's Rule to Buy Gold
TP1: 1976
TP2: 2000

USD/JPY
Seen candlestick Evening Star at Daytime,
then scale down to 4 HR T on key level
106.50,
hanging man, signaling
reversal..
Looking for short..

CANDLESTICKUntuk INARI, candlestick pattern "bullish harami" telah terbentuk...boleh jadi suatu pullback kembali selepas kejatuhan..

Bitcoins Bearish signals, one candle away from confirmationBitcoin is currently in an uptrend, we can all see that. However, after hitting $12,000 it was rejected with huge volume, a potential pivot point. As it came back to $11,800 afterwards, the volume was weaker, and selling pressure increased. The price was rejected twice (2 days in a row) at the level creating these 2 Dojis. This means we are in the middle of indecision, and with strong selling pressure mounting, we could witness a reversal next. No moves should be made until this candle pattern closes.
This candlestick has a lot riding on it!
If it turns into a strong bearish candle - we will have confirmation of reversal.
If it is another Doji (2 doji in a row after strong bullish candle) this will be a high % of a reversal confirmation.
If the candle turns bullish, trend continues, and we take another shot at previous high.

MSFT possible reversalBearish candlestick pattern printed on the weekly chart. Pay attention to the wicks; the newest candle tried to retest the high and reversed before it could get back up there.
Here we have the daily chart showing MSFT breaking trend, as well as a bearish reversal pattern confirmed with a mini bear flag.
Current target is $192-$195, but i'll be watching price action closely around $198 level.
Planning to cut losses if we gap up this coming Monday, or if we open flat/green and we're not down trending within the first hour of trading.


QQQ meeting resistance at ~226Again, new to candlestick trading so my word has little merit. Early into the trading day today, we can see that QQQ is facing resistance at the 226 line. The past few days have arguably been somewhat reminiscent of "doji." These triple doji emphasize market instability. It seems to be testing the top with a chance to fall and test support. Volatility seems to be up in other indices as well.
Predicting little movement today and remaining between 224 and 226, perhaps starting to drop early this week.
What do you think? Do you see something different? Let me know!


Daily inside bar and long lower shadowMarket: GBPUSD
Trend: Daily Bullish
Resistance Level: 1.27519, 1.31963
Support Level: 1.23368, 1.22044
Price Analysis: Inside Bar, Shadow
Overview: An inside bar occurred. Market is confused where to go.
The price actually is in the support area which is at the crossed EMA. The candlestick showing a long lower shadow indicating that the buyers is trying to control the market.
This makes me to believe that the price will rise up and will test resistance level 1.27519
Important: This is my personal opinion and I did not responsible on any loss if you are following my guideline.

HighTime for EURAUDThe series of price analysis from monthly basis to weekly have suggested that there has been establishment of Long trend.
One of the best price to catch and enter this trend is after there has been correction around 1.65923. Wait for bullish candlestick pattern to complete as well as wait for economic releases. The confirming pattern is likely to come around March-April.
#patiencepays.

SUPPORT & RESISTANCEPrevious resistance becoming support with a pin bar candlestick at the region. This is telling me that the price could push to the upside.

USDCAD CANDLESTICK PREDICTION!!(WEEKLY CHART)
PREDICTION OF NEXT CANDLE TO BE BULLISH
BUY ENTRY @ 1.30577
TAKE PROFIT @
20 PIPS
40 PIPS
75 PIPS
STOP LOSS @ 40 PIPS

USDJPY CANDLESTICK PREDICTION!!(WEEKLY CHART)
PREDICTING NEXT CANDLE TO BE GREEN
BUY
ENTRY @ 110.130
TAKE PROFIT @
20 PIPS
50 PIPS
75 PIPS
STOP LOSS @ 40 PIPS

EURJPY CANDLESTICK PREDICTION!!(WEEKLY CHART)
BUY LIMIT
ENTRY @ 121.779
TAKE PROFITS @
-20 PIPS
-50 PIPS
-100 PIPS
STOP LOSS @
40 PIPS

