BTCUSD: 200 EMA SYSTEM - Potential Buy Setup200 EMA SYSTEM:
- The 200 EMA SYSTEM is very simple and easy to follow.
- It's very appealing with the potential to bring you hundreds of ticks a month.
- Trades with the trend and effectively buys low and sells high.
- Helps identify the main trend - whether the market is going up or down.
Why 200 EMA? Why not use other EMA's like 100 EMA, or 50 EMA or 20 EMA or 10 EMA?
- Because 200 EMA is one very popular indicator used by lots of traders.
Here’s what you need to know about the 200 EMA:
- When price is above the 200 EMA, that’s an uptrend.
- When price is below the 200 EMA, that’s a downtrend
How it works:
- The 200 EMA SYSTEM is a multi-timeframe strategy.
- It uses the Daily chart, the 4H chart, and the 1H chart.
- First, after placing the 200 EMA on your Daily chart, see if it’s an uptrend or a downtrend.
- The Daily chart determines the main trend.
- Next, switch to the 4H chart and see where the 200 EMA is relative to price.
- Is it in the same trend as the Daily chart?
- If so, switch to the 1H chart and check if the 1H chart is in the same trend as the Daily and the 4H charts.
- Your trade entries are executed when the trend in the 1H chart is the same as the 4H and the Daily charts.
- “Buy the dips” and “Sell the rallies” in the 1H timeframe.
Here's how to do it:
Step 1: Check the Daily timeframe: Is the trend up or down?
Step 2: Check the 4H timeframe: is the trend the same as in the Daily chart?
Step 3: Check the 1H timeframe: is the trend the same as in the 4H and Daily chart?
Step 4: Wait for price to come to the 200 EMA and trade the bounce of price on the 200 EMA line.
How to trade the bounce on the 200 EMA line:
- The best way is to use price action by the use of reversal candlesticks.
- Once you get confirmation with a bullish reversal candlestick (for an uptrend trade, place a buy stop order 3-5 ticks above the high of that bullish reversal candlestick.
- Or once you get confirmation with a bearish reversal candlestick, place a sell stop order 3-5 ticks below the low of the reversal candlestick (if this is a downtrend and you are selling short).
- Your stop loss should be placed at a minimum 10-15 ticks outside of the 200 EMA line.
- Use the previous swing high or swing low on the 1H chart as your profit target.
Managing your trade when profitable:
- Use the trailing stop technique: move your stop loss and behind each subsequent swing lows or high as your trade moves in your favor so that you continue to lock in your profit as price travels towards your take profit target level.
Some issues with the 200 EMA strategy:
- What happens if the 1H trend is different from the 4H and the Daily timeframes? Wait until the 1H trend is the same as the 4H and the Daily and then trade the bounce off the 200 EMA.
- What happens if the 4H and the 1H trend are the same and the Daily is different? Same answer as above: Every timeframe has to match and have the same trend. If one timeframe is different, you wait until all are the same trend.
Daily:
4H:
1H:
Search in ideas for "CANDLESTICK"

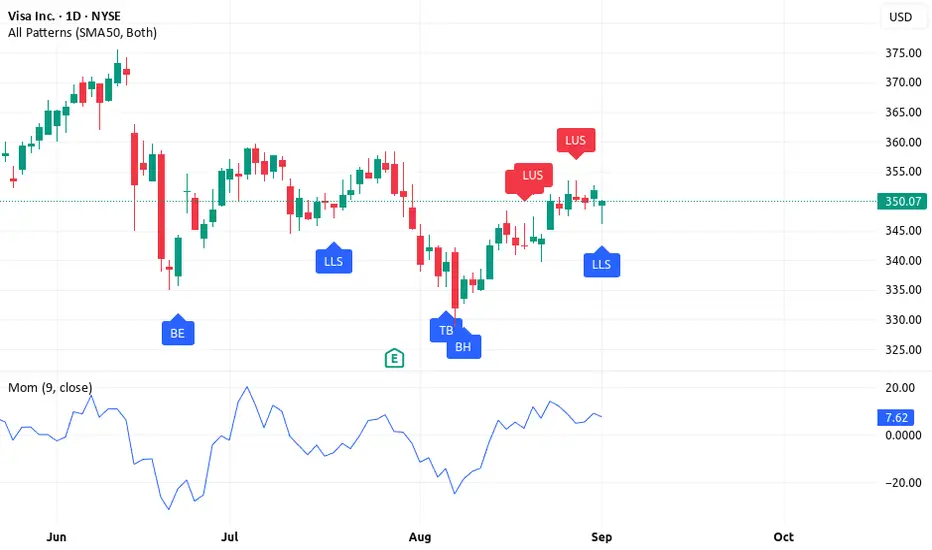
Visa (V) 3 Buy Signals – Trend, Momentum & Price Action Aligned Visa (V) Buy Signal – Multi-Timeframe Confirmation 🚀📈
Visa Inc. (V) NYSE:V is showing a fresh buy opportunity when viewed through the lens of the 3-step trading system: candlesticks, oscillators, and moving averages across different timeframes.
Step 1 – Daily Candlestick: Bullish Rejection
On the daily chart, Visa has printed bullish candlestick signals — including long lower shadows that show buyers stepping in to defend support. This suggests
demand is strong at lower levels and the path of least resistance remains upward.
Step 2 – Weekly Oscillators: Strong Sell / Sell
Interestingly, the weekly oscillator rating is currently on Sell / Strong Sell, showing momentum weakness in the short term. This isn’t necessarily bearish
for long-term buyers — in fact, it often signals a pullback inside a broader uptrend, giving traders the chance to accumulate at discounted levels.
Step 3 – Monthly Moving Averages: Strong Buy / Buy
The monthly moving average rating is firmly Strong Buy / Buy, confirming that Visa is in a long-term bullish trend. As long as price stays above these key levels,
the primary trend remains intact and pullbacks should be viewed as opportunities, not threats.
The Buy Case for Visa
Daily Candlestick → Bullish rejection signals buyers defending support.
Weekly Oscillators → Short-term weakness creating entry opportunities.
Monthly Moving Averages → Long-term bullish trend remains intact.
This alignment creates a classic buy setup: a strong trend supported by long-term moving averages, a temporary dip in weekly momentum, and a bullish candlestick trigger on the daily chart.
Trade Idea: Traders may consider long entries near current levels or on dips, with protective stops below recent daily lows. Profit targets could be staged at previous swing highs and beyond, in line with the monthly uptrend.
⚠️ Disclaimer: This analysis is for educational purposes only and not financial advice. Trading and investing carry risks. Before risking real money, it’s
recommended to practice on a demo account and develop solid risk management and profit-taking strategies.
NILI.V Possible Trend Reversal & Entry - First AnalysisNILI.V (Surge Battery Metals)
Candlesticks:
This past week NILI.V closed Thursday with a dragonfly doji candle, followed by a bullish engulfing on friday. The last time a dragonfly doji appeared was on September 9th, which marked a trend reversal that resulted in a 90% in price over 45 days.
Technical Indicators:
MACD on the daily is about to crossover indicating a possible shift in momentum from bearish to bullish.
Possible Entry:
looking for a confirmation on the trend reversal on Monday with a candle closing above the downward channel that Nili has been trading in over the past couple weeks. If that happens I will take a long position and be looking for profit taking opportunities at .40, .45, and .50 cent price ranges.
I am new to trading and this is my first analysis. Let me know what you think and if I got anything wrong here, any feedback is appreciated!

Relational Technical Analysis: A New Way to Look at ChartsRelational Technical Analysis™ or “Relational Analysis” is my contribution to the continuing evolution of technical analysis. It helps me understand who is in control of the price action of stocks, indexes, ETFs and more. It can provide a leading analysis for trading or investing in any chartable trading instrument, even cryptocurrencies.
Relational Technical Analysis starts with an understanding of the current market participant cycle. There are 2 sides of the market participant cycle, each with a few different groups: the Professional Side and the Retail Side.
The Professional-Side Groups:
the Buy-Side Institutions, which I often refer to as “the Dark Pools”
the Sell-Side Institutions, which include the Money Central Banks and largest Financial Services Companies
the Professional Traders, both independent and Floor traders for either the Buy Side or Sell Side
the High Frequency Trading Firms, aka HFTs
The Retail-Side groups:
Smaller Funds with less than $3 billion under management
the Retail Groups: small lots and odd lots
At any given time, one or two of these groups will dominate the price, trend and direction of an asset. Relational Technical Analysis reveals which of the market participant groups is in control. This is due to the differences between the way each group trades--how they execute trades, their reasons for buying and selling, their access to information, where in the trend they tend to buy and sell, and more.
For example, there are huge differences between the order types and speed of execution of each market participant group:
Order Types: The Professional side uses unique orders to their trading venues such as Time Weighted Average Price (TWAP) strategies for automated orders and multi-leg cross-market orders. Retail uses Market and Limit orders; Small Funds often use Volume Weighted Average Price (VWAP) strategies to trigger automated orders.
Speed of Execution: The Professional-Side short-term traders trade on the second. HFTs trade on the millisecond. Retail orders must be filled within 1 minute. Dark Pool transactions can take up to 10 minutes or longer to fill huge, large-lot orders, based on the SEC Midas data analysis.
Additional variables include Lot Size, Time of Day trades are transacted and Venue (whether on the public exchanges or on Alternative Transaction Systems like Dark Pools).
These variables create very different patterns in candlesticks and indicators. Analyzing charts relationally, then, gives the trader an understanding of how price is most likely to behave in the near term. When the Professional Side is in control, the trend is typically more sustainable.
Relational Technical Analysis uses a combination of the price and volume patterns created by each market participant group along with hybrid indicators that reveal the balance of power. The example below uses Chaikin Oscillator. A Volume Oscillator is always included in the set of 5 indicators I teach, a set which differs depending on which indicators you have available.
On the SPX, we can see the shift of sentiment that occurred between October and January as the Dark Pools sold against the Small Funds.
In October and November of 2021, there was extreme speculation from the Small Funds. The steep run up occurred on low volume and an extreme angle of ascent in Chaikin Oscillator.
This was followed by a pattern that represents Dark Pool rotation. A trading range develops with stronger selling volume while Chaikin Oscillator moves down and stays at and below the center line over the topping pattern development. This rotation zone is confirmed in the months following, as Dark Pool TWAPs continue. The largest institutions were lowering their inventory of S&P500 components ahead of the downtrend.
This Relational Technical Analysis showed a Shift of Sentiment in the market that was a crucial leading indication of the risk of a significant downside trend developing. Traders using this analysis had ample time to prepare for the downtrend which resulted in a Bear Market decline this year.
Thinking ahead from here, I'm looking for the opposite as a bottom starts developing: a shift of sentiment back to the upside where Retail and Small Funds capitulate, followed by Dark Pool accumulation patterns.
In summary, Relational Technical Analysis is a new way of looking at the charts which focuses on the unique candlestick patterns, trend formations and indicator patterns that each market participant group creates. This can provide a leading analysis for all trading styles.
Martha Stokes, CMT
www.TechniTrader.Courses
This has been an introduction to Relational Technical Analysis, which I teach at TechniTrader and which I presented to the CMT Association in 2015.
Shared content and posted charts are intended to be used for informational and educational purposes only. The CMT Association does not offer, and this information shall not be understood or construed as, financial advice or investment recommendations. The information provided is not a substitute for advice from an investment professional. The CMT Association does not accept liability for any financial loss or damage our audience may incur.

Morning star A morning star is a visual pattern made up of a tall black candlestick, a smaller black or white candlestick with a short body and long wicks, and a third tall white candlestick.
A morning star is a visual pattern consisting of three candlesticks that are interpreted as bullish signs by technical analysts. A morning star forms following a downward trend and it indicates the start of an upward climb.
In price action strategy when we find this pattern on support , we can trust it 🥰

AAPL - Beware the Hanging Man pattern - 1DAAPL demonstrating a warning that selling pressure is mounting. Previous day would have been valid reversal pattern if todays candlestick closed lower, however it closed higher with another hanging man pattern.
The appearance of these candlesticks near the top of a pattern usually demonstrates a bigger selloff to start the day, and then a rally back to the starting point. The long shadow indicating that selling pressure is beginning, which can be seen in the last 3 candlesticks.
AAPL coming off a huge gain after both financials were solid, and the announcement of the split. Current pattern is bullish, and will continue, look out for a further confirmation of reversal.

XAUUSD Down?For the price action, candlestick analysis people out there, The weekly chart shows a Shooting star/Bearish Pin bar on the Weekly chart and a confirmation of it with the week just passed with a weekly candle close below the low of that Shooting star/pin bar. This is a pretty compelling reason to look for sells at least down to that red zone in my opinion. However, It is in a strong bullish uptrend, so it can really continue upwards. And when trading against trend it is hard to say how far we can go but I'm leaning towards looking for sells if the market can break through the red zone it is in, and the green zone as well.
Trade at your own risk, Unfortunately, I am not a professional and this is not professional advice, maybe one day it will be, until then use your own analysis as well.
PatiencePays

Charts In 3 Steps-Bitcoin (BTC/USD) Buy Signal – Trend Resumes Bitcoin (BTC/USD) Buy Signal – Trend Resumes After Pullback ₿🚀
Bitcoin is also flashing a buy signal when viewed with the same 3-step system, showing strong confluence across timeframes.
Step 1 – Daily Candlestick: Bullish Reversal
On the daily chart, Bitcoin has printed a bullish engulfing/rejection candle, suggesting buyers have stepped in aggressively after a recent pullback. This is a strong reversal signal.
Step 2 – Weekly Oscillators: Sell / Strong Sell
The weekly oscillator rating is showing Sell / Strong Sell. This may appear bearish at first glance, but in the context of Bitcoin’s structural uptrend, it
signals a short-term dip that may provide an attractive entry zone before momentum turns bullish again.
Step 3 – Monthly Moving Averages: Strong Buy / Buy
On the monthly chart, Bitcoin remains firmly in a Strong Buy / Buy rating above its key moving averages. This confirms that the long-term uptrend remains strong, and pullbacks should be treated as buying opportunities.
✅ Daily Candlestick → Bullish reversal
✅ Weekly Oscillator → Temporary weakness offering entry
✅ Monthly MAs → Long-term bullish structure
Trade Idea: Traders may look for long entries on confirmation candles, with
stops below the daily reversal low. Profit targets could be staged toward recent highs and key psychological levels like $75,000 and beyond.
Disney (DIS) Buy Signal – Pullback Creates Opportunity 🎬📈
Disney (DIS) is flashing a fresh buy opportunity backed by multi-timeframe alignment in the 3-step trading system.
Step 1 – Daily Candlestick: Bullish Pattern
On the daily chart, Disney has printed bullish candlestick signals, including rejection wicks showing buyers defending support levels. This confirms demand is stepping in at lower prices.
Step 2 – Weekly Oscillators: Sell / Strong Sell
The weekly oscillator rating is in Sell / Strong Sell territory. This reflects short-term momentum weakness, but in the context of a bullish backdrop, this
pullback is often the perfect setup for positioning early before momentum swings back upward.
Step 3 – Monthly Moving Averages: Strong Buy / Buy
On the monthly timeframe, moving averages are firmly in Strong Buy / Buy mode. This confirms that the long-term trend is bullish and the bigger picture supports higher prices ahead.
✅ Daily Candlestick → Bullish trigger
✅ Weekly Oscillator → Short-term weakness = buy-the-dip setup
✅ Monthly MAs → Long-term trend intact and rising
Trade Idea: Traders may consider entering on dips with stops below recent daily lows. Potential upside targets include previous resistance zones and long-term highs.
⚠️ Disclaimer: These analyses are for educational purposes only and not financial advice. Trading stocks, forex, or crypto carries risks. Always test strategies on a demo account first , and make sure to use proper risk management and profit-taking strategies to protect your capital.

How to See Fundamental Improvement in Technicals, $VRNT ExampleStocks that are forming bottoms right now are completing faster due to the improvement of their fundamentals in the current quarter.
For example, NASDAQ:VRNT is moving out of the extreme dump by HFTs and retail groups. This is a common pattern that indicates shifting sentiment in a bottom formation.
The candlesticks stairstep upward as Pro Traders get in the mix of Dark Pools buying at bargain prices.
The largest Institutional investors who use Dark Pools to accumulate huge positions over time are the first to buy in a long-term uptrend, at bargain prices. It can be a very early signal, but these are the savviest fundamentals-driven investors in the market, so it pays to learn their footprints in stock charts.

EURUSD On Friday, EURUSD was unable to make new highs to close the month and instead pulled back to 1.1976x level, a level where we identified a "Shaven Bottom" candlestick. Also, on Friday there are "Shaven Top" candlesticks near the highs where we expect price to move back up and possibly to make new highs. April was a bullish month for this pair. We're anticipating a follow-through to the upside with this month's low near the 1.1920x level (marked red). That is all for now!
Happy Trading folks!
Cheers!

AFTERPAY (ASX:APT) potential shortAPT appears to be overextended to the long side and may be due for a slight correction.
Reasons for this evaluation:
--> Solid Bearish Engulfing candlestick pattern has occurred (Bearish reversal)
Last 2 bearish engulfing patterns along with an overbought RSI resulted in a reversal. This indicates a higher probability trade setup.
--> RSI is moderately overbought (As of the 22st @ 66.59)
--> ATR is at record highs
Each new major ATR high has result in some form of correction whether small (5-10%) or large (100%+)
--> Other Large Cap stocks on the ASX such as BHP,RIO,FMG have also provided bearish signals in the last few weeks and an overall market downtrend can support this evaluation
Reason that oppose the success of this evaluation:
--> APT as a single stock has a tendency to follow fundamental analysis rather than technical
This includes being extremely responsive to news catalysts, positive forecasts and more
--> Positive news reports in regards to tech and software can positively effect APT
**Any Supporting ideas that can improve the analysis of APT are all welcome

GBPUSD-Weekly Market Analysis-Aug20,Wk4The market is showing uncertainty and you can spot that with 2 pairs of railway candlestick formation.
For a mid to long term shorting opportunity, I will be waiting for a break-close below(BCB) the support level followed by a retracement then I'll be looking for shorting opportunity.

GBPUSD-Weekly Market Analysis-Aug20,Wk1GBPUSD is not seated at a region for an aggressive demand zone for buying opportunity, a bullish engulfing as a candlestick confirmation is important for this trend trading opportunity.
The previous high at 1.3161 became an important resistance for observation for a counter-trend trade or sideway bounce trading opportunity. Trend Traders will be looking at that area too, which means if price head up to that region there is a stalling at that level is expected.

(Episode #381) AUDUSD - Support and Resistance (26 Jul 2020)Waiting for a shorting opportunity after the candlestick pattern confirmation within the sell zone.

DAL 46.64 ShortFundamental Analysis
With Airlines getting business back up and running in a slow fashion, the Airline industry as a whole has to return back to profitability. However it looks like investor confidence is still not bullish, and DAL isn't an exception to this case. For the short-run, there is still a bearish outlook for the industry considering the consistent Covid variants causing havoc.
Technical Analysis
Price volatility since last year month-to-month.
Price is in a downtrend at resistance level of 46.64.
Widening channel with no breakout creating lower lows in the price without higher highs. This is a bearish trend in the near term.
MACD is flat near the zero line.
RSI level at 51.80. A breakout here can signal a potential upward momentum, however confirmation with a breakout at 46.46 is also needed.
Stochastics showing mixed readings so it's not valid.
Fibonacci retracements showing lows have retraced to 23.6 while resistance at 61.8 level has remained steady.
Candlesticks showing that every time there has been a push to the upside, a doji star has confirmed a reversal on several occassions.

USD/JPY Ichimoku cloudUSD/JPY have been difficult to understand lately. I've analysed USD/JPY through supply and demand zones. It's slightly above selling pressure, hence we're currently in a new demand zone. I've applied candlestick patterns to give an idea about the current trend. We can see that USD/JPY mainted it's position firmly.The reason for this have been bonds increasing which favours USD.
Candlestick patterns and Ichimoku clouds may be analysed to better understand current direction. Above ichimoku cloud indicates bullish trend. Red cloud indicates selling pressure; green cloud buying pressure. Dotted red and green lines are supply and demand areas. Candlesticks above a green line indicate some support. Candlesticks below red line indicate selling pressure, coming from increased supply.
I'm neutral, with slight favour to uptrend since daily candle recently came out of ichimoku cloud, which we know is bullish, furthermore, two 4H bullish engulfing candlesticks from yesterday. Orange areas indicate resistance, once we enter into the grey area, we may get better understanding of the direction. If the candlesticks makes it to thee green cloud and stays above them, then USD/JPY will be making a push to higher highs.
Note: analysis is provided to better understand the recently confusing USD/JPY trend.

BTC Bull Flag: Candlesticks Are Still Inside the PatternCandlesticks hit the 51700 are just below my green resistance box then came back down. But it is still within the range of the bull flag, so it can continue the trend within this pattern. I am still pretty much bullish with the prices as the EMA ribbon acts as support for the candlesticks.
Beside that, the ATR Trailing Stoploss shows a buy signal and this is backed up with the stochastics reaching the oversold lines white the candles hit the bull flag's support lines.
I am still looking for the prices to hit up until the 52000 region or the green resistance box but always be ready for prices to go down as well.
I am open for feedback, suggestions and advice. Thanks!

Visa (V) Buy Signal: 3-Step Rocket Booster StrategyVisa (V) Buy Signal – Daily Trigger + Weekly Pullback + Rocket Booster 🚀💳📈
Visa Inc. (V) NYSE:V is flashing a compelling buy signal, supported by daily price action, weekly momentum readings, and long-term trend confirmation via the Rocket Booster Strategy.
Step 1 – Daily Candlestick: Bullish Signal
On the daily chart, Visa is showing bullish candlestick formations, including long lower shadows that confirm buyers are stepping in to defend support. This provides the entry trigger.
Step 2 – Weekly Oscillators: Sell / Strong Sell
The weekly oscillator rating is currently in Sell / Strong Sell territory. This highlights short-term momentum weakness, which in the context of a bigger
uptrend often creates an ideal buy-the-dip scenario. Traders can use this temporary pullback as an opportunity to position before momentum flips back upward.
Step 3 – Monthly Moving Averages: Rocket Booster Strategy (Strong Buy / Buy)
On the monthly timeframe, Visa shows a Strong Buy / Buy rating on moving averages. This is the Rocket Booster Strategy in action: the long-term trend is
powerful and acts like a booster, propelling prices higher once short-term weakness fades.
The Buy Case for Visa
Daily Candlestick → Bullish trigger (buyers defending support)
Weekly Oscillator → Pullback offering better entry levels
Rocket Booster (Monthly MAs) → Long-term trend remains strongly bullish
This multi-timeframe alignment makes Visa a high-probability candidate for further upside.
Trade Idea
Entry Zone: Near current levels or on dips
Stop-Loss: Below recent daily lows
Profit Targets: Previous swing highs and psychological resistance levels
The combination of a daily entry trigger, weekly pullback, and monthly Rocket Booster creates a textbook buy setup.
⚠️ Disclaimer: This analysis is for educational purposes only and not financial advice. Trading and investing carry risks. Always practice on a demo account first , and develop solid risk management and profit-taking strategies before committing real capital.

Pound/Cad showing 2 signs of bear im not one to trade candlesticks but when 2 signs that can push this down are blatantly showing its hard to ignore..but the bulls still dont want to give up.. I will be eyeing this for the downside if it happens.. id be inclined to go long but its against my strategy so going to be patient and sit it out until/if it goes down.

Twin (#1 RDWR) I find two companies that the charts looks very similar for these reason I called twins and they are listed in the same Industry.
The first is (RDWR) Radware Ltd. Industry: Technology. Sector: Information Technology Services. Friday Closing Price 02/09/2018 (20.86 USD)
What I want to emphasize about this idea are two key candlesticks.
The first is the big green weekly candlestick that broke the past resistance level in the 18.00 area some months ago, look the red arrow
The second is the (Long lower shadow) of the last weekly candlestick that was product of one of the worst weeks for the Dow Jones, falling in a week 1,175 points
Together these two candlestick show how strong is this stock now and the intentions that it has to break the next resistance level located around 20.90 area
End.

Dark Pool Buy Zones for Trading Momentum or VelocityDark Pool buy zones, identified with Relational Technical Analysis of the candlestick patterns and where they form in the long-term trend, along with indicators that reveal large-lot activity, are the key to preparing early for momentum to velocity runs for swing trading, position trading and even for planning long-term investments.
NYSE:CHWY is working on a bottom, finally basing and now starting to test the bottom completion level. This can be a strong resistance level where Pro Traders who started a swing trade from the lows are likely to take profits.
Often we see a sideways action develop at this level, the lows of which are usually confined by the support level built on the way up.
This would be the level to watch for the next buy entry signal. If it consolidates narrowly or briefly, then there is potential for a momentum swing trade. If it platforms a little wider but within the last support level, then a position trade entry can develop.

Swing Trade Patterns: $NKE ExampleNYSE:NKE stock has a 2-day resting pattern and then a candlestick buy entry signal that is slightly longer than its average price gains in a single day.
Most Volume Oscillators are not at the top of the chart yet. Flow of funds indicators indicates money flowing into this stock.
The higher line is the bottom completion level for this short-term bottom. The resistance is moderate for a swing trade, but the stock could break through if momentum to speculative buying continues.

Pre-Earnings Run in $UPSTNASDAQ:UPST has been running up speculatively after completing its bottom. It has mostly retail groups and smaller funds holding so that is why the stock has up and down days in an irrational trend pattern often. HFTs are in the mix regularly inspiring the speculation.
The company reports Monday of next week. Looks like Pro Traders used a swing trading earnings strategy and some took profits ahead of the report.
The stock has a low percentage of the shares held by institutions, so emotional trading candlestick patterns are problematic at times. It's important to buy and sell with the Pro Trader patterns in speculative stocks.
