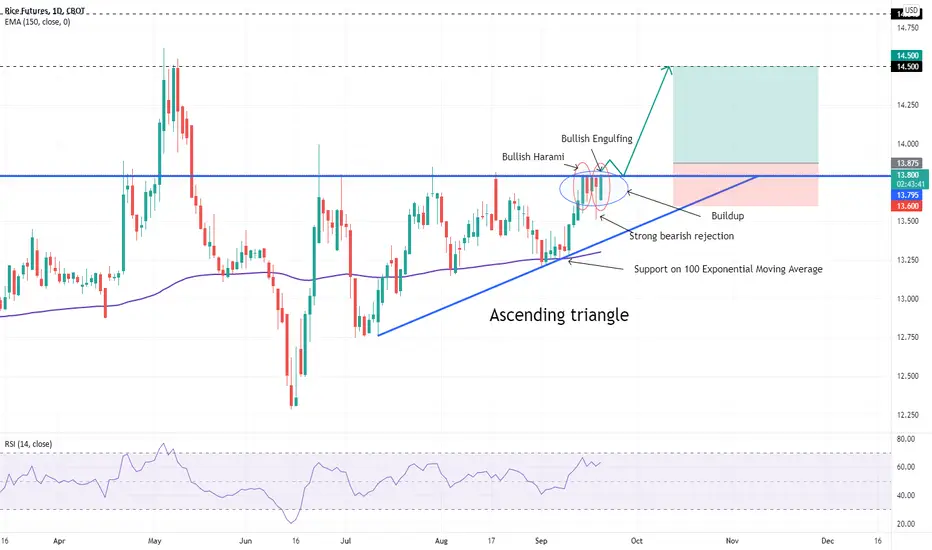
BULLISH ON US RICEBullish clues:
- General uptrend since mid of June
- Ascending triangle , with a strong resistance at $13.795 USD
- Prices are making a buildup , sign of an upcoming strong resistance break up
- Strong bearish rejection of candlesticks on the resistance (buyers are not able to get the price down)
- Bullish Harami and Bullish Engulfing at the resistance
- Relative Strength Index ( RSI ) is above the 50 level, sign of uptrend
- 150 Exponential Moving Average act as a support
Fundamental news:
/
Objective:
If the ascending triangle is confirmed, rice could goes up to the level of $14.500 USD (previous highest).
MAYBE HAVE TO WAIT A PULLBACK AS A CONFIRMATION OF THE ASCENDING TRIANGLE BECAUSE THE RICE MARKET CAN BE TRICKY AND UNPREDICTABLE. But good risk-to-reward ratio possible = 2.27
Feel free to share, comment and give your opinion if it is constructive ;)
DISCLAIMER: This is not investment advice
Search in ideas for "CANDLESTICK"
Signal: EURGBP (1H), SHORT 📉Good afternoon, traders! We got a projection for you. Let's get right into it:
We will be entering this trade, only if we see a nice, clean streak of green candles, going all the way back to the EP.
💱 SELL LIMIT:
- Stop Loss (SL) = ~0.85828
- Entry Point (EP) = ~0.85631
- Take Profit (TP) = ~0.85346
Positive evidence:
✔️ Breakout @ ~0.85631 (at a significant S&R zone).
✔️ Retracement @ ~0.85346 (at a significant S&R zone).
✔️ EMA (50) @ above candlesticks; between EP & SL.
✔️ EMA (200) @ above EMA (50).
✔️ Clean streak of red candles, going all the way down to the point of retracement (with the exception of one green).
Negatives:
❌ No overall downtrend.
In our opinion, the positives are greater than the negatives. Remember: if, at any point before price hits the EP (1H timeframe), we see a decent-sized red candle form, this projection is no longer valid.
Did this help you? Please let us know, in the comment section, so that we can provide you with better tips, in the future.
“My mission is to help you see forex for what it is: it’s not ‘rocket science,’ but a simple strategy game. Get on the ‘good side’ of probability, develop the proper mindset, and you will prosper.”
— Nio Pomilia, Forex Free Press

BTCUSD volumes and candlesticksthese are just my observations, I'm not an expert on volumes, I'm just learning. Thus, the basis of the analysis is a large body of a large volume candle a small body of a small volume (a candle from the maximum to the minimum value)
I can also add that hourly charts are more informative in terms of volumes, since equal volumes often appear on daily charts, and when they are equal, candle patents start playing on the chart.
If you understand more than me in volumes, write in the comments, and also, if you like this idea, put a like, ( I don't know English well), and if you use my ideas, give a review, this is also an experience for me.

REVERSAL CANDLESTICKS CHEAT SHEETLIKE & FOLLOW FOR MORE ;)
IDENTIFYING TREND CHARACTERISTICS:
Chart Patterns Trading Style: Break and Retest:

Warnings Signs in the Chips?Semiconductors have been a key pillar of the S&P 500’s advance since 2016, and now they may be flashing a warning signal for the overall market.
This chart of the Philadelphia Semiconductor Index shows how gains have been slowing all year. Prices have squeezed into an increasingly narrow range, with the 50-day simple moving average (SMA) recently dipping within about 1 percent of the 100-day SMA.
Also notice the action as SOX tried to climb above 3300. After some initial closes at new highs, the candlesticks turned solid as early rallies got sold.
Next, looking at the weekly chart, MACD has steadily waned since February (bearish divergence). There was also a bearish outside week July 12-16, which SOX has yet to return above:
Finally, the chart below shows the ratio of SOX vs the SPDR Technology ETF (XLK). Notice how it’s been slipping since April – despite what should be a lot of good news involving strong demand for chips. This may suggest that, should another summer pullback occur, SOX may be especially vulnerable.
TradeStation is a pioneer in the trading industry, providing access to stocks, options, futures and cryptocurrencies. See our Overview for more.

History repeats itselfThe cross of death was formed. Take a look at the $ 60,000 candlesticks before Bitcoin falls. The trend line is still descending. This is a possibility...The data is very negative and we are still in the bear market. This is a possibility.

Candlestick combinations are mentioning correction continuation.Greetings all.
Two important things.
Candlesticks combinations are not bullish at the moment and are mentioning more correction.
Trying to spot which downtrend wants btc to keep alive and assuming that we already lost the
macro downtrend line from 20k break out, seems that we gonna retest the macro downtrend
from 11k break out.
This is somewhere near 50% correction from the top of 64k.
In my opinion this will mention a super-bullish cycle momentum for bitcoin.

BTC - W1 - WARNING ! BEARISH ENGULFING PATTERN !!!W1 : Last week price action triggered a BEARISH ENGULFING PATTERN !
Interesting to note that lowest seen was 51'541, close to the 38.2% Fib ret
@ 51106.
Of course, such kind of bearish candlesticks, should be, in this W1 time frame,
confirmed on a closing basis at the end of this week !
Nevertheless, the fact that we get out of the uptrend channel is one of the first
warning signal that the former bullish trend could be over.
Watch shorter time frames to monitor the ongoing price action which would allow to act accordingly
on the time frames you choose for your trading strategies !
Have a nice trading week, all the best, take care and have fun !
May your long goes up and your short goes down.
And finally, please do not hesitate, of course, if you find, my technical analysis approach, valuable for you, to like it
and to add me, if it is not done yet, on your following list.
Ironman88848

A SHORT SHORT OR LONG SHORT?FOREXCOM:GBPJPY
Candlesticks are consolidating around 142 (Le Resistance)... Also DOJI in play. Will this be the beginning of a BEARISH reversal to the downside or will the BULLS keep pushing above 142.200 ??? This wave hasn't had a higher high yet...
HMMMMM....
I'm looking for quick short to 141.700 or maybe a break above 142 and retest as a support. Then it's UP, UP, UP and AWAYYYY.
Otherwise, we're going...
DOWN DOWN BABY, down by the roller coaster
Sweet sweet baby, I will never let you go,
Shimmy shimmy cocoa pops,
Shimmy shimmy pow!

Candlestick identification Dec'19 to May'20My practice for identifying candlesticks to look at later. Did not realize I was analyzing during the pandemic


Does Anyone Remember Netflix?Streaming-video giant Netflix has been dead in the water since early July. But now some of its chart features could be getting interesting.
First, NFLX’s range of motion has tightened lately as the rest of the market’s expanded. We can see that in its bullish inside week (beginning November 16). Two small candles have followed as prices inched higher. Bollinger Bandwidth is also back to the narrowest end of its normal range (on the daily chart).
Second, MACD has started rising. This also signaled gains at previous times like mid-June and early October.
Third, NFLX is challenging its 50-day simple moving average (SMA). The last couple of times it tried to break this SMA (October 29 and November 6), it quickly backed down. But this time it’s pushed for four straight sessions without failing.
Fourth, bearish candlesticks on November 9 and November 23 had no downside follow-through. Instead, buyers stepped in to defend incrementally higher lows on the stock.
Finally, the fundamental story could shift back in NFLX’s favor if coronavirus cases continue to increase into the winter.
TradeStation is a pioneer in the trading industry, providing access to stocks, options, futures and cryptocurrencies. See our Overview for more.


GBP/AUD BULLISH OUTLOOKPrice reversion from strong support level. With weekly doji and bullish candlesticks
Price in consolidation period currently. If price breaks upwards than we get in during the breakout
and ride wave upwards. However price has been on a heavy sell off So downwards momentum could also continue.
One to watch

SLQT Pivot point, looking for confirmation from candlesticksRecent IPO SQLT has crashed from it's opening share price of $20/share - which actually went on to open at $26-$28 the first day of trading, for several weeks, until it crashed to it's recent low, around $15.80. This was met with strong resistance, and a bullish candle formed, with a large amount of volume, signalling a potential reversal of the market. The stock price has been consolidating at this new level, and we must wait for confirmation of another signal before making any moves.

Morgan Stanley Nuzzles SupportFinancials have been one of the weakest corners of the market lately, thanks to credit worries and falling interest rates.
Of all the big names, Morgan Stanley has held up the best. It’s down less than 3 percent on the year, compared with drops of more than 20 percent for other key stocks like Bank of America and JPMorgan Chase.
MS has performed better fundamentally because it has more exposure to wealth management. That helped it deliver a strong quarter the last time earnings were reported on July 16.
The stock jumped at the time but didn’t go far. One reason was that stochastics were overbought. Another was the fact its 50-day simple moving average (SMA) was below the 200-day SMA.
Both of those conditions have now flipped. Stochastics show an oversold condition, and a “Golden Cross” of the 50-day SMA above the 200-day SMA occurred on July 17.
MS is also showing signs of basing out around the same $49 area that marked the top of its range in late June and early July. Notice the recent hammer candlesticks around that level. It’s also nuzzling the 50-day SMA.
Traders may want to take a long bias as long as MS remains above the 50-day SMA, or the July 31 low of $48.27.

Lots of accumulation, ready to move.Daily GXSBTC volume has diminished quite a bit, and we are seeing the immediate aftermath of huge volume accumulation. That increase in volume and buying pressure set off a pump, and a long exhausted wick set the market sideways.
Just a few candlesticks can tell us a lot - we recently had all GXS on the market from ~4700 sat to ~6000 sat bought up in a single candle, immediately after which the accumulation abruptly stopped. Shortly after that GXS was sold for a 40-60% profit over a two-candle period that exhausted the buyers on the market. They effectively cancelled each other out.
Will have to wait for volume to start coming in to judge the market sentiment.

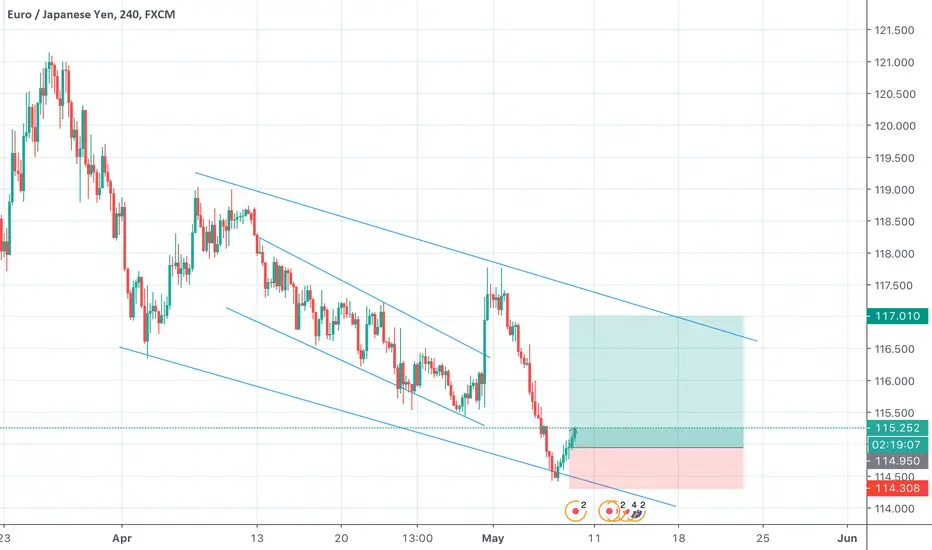
EURJPY LONGPrice is bouncing within a descending channel. As price has hit bottom of channel, I expect the price to hit the top of the channel, thus why I chose to place my take profit at the top of the channel. The bullish engulfing candlesticks on the 4 hour show bullish momentum
USDJPY - Golden week approachingCandlesticks showing loss of momentum as it approach the area of confluence.
With Japan's golden week approaching, this might boost JPY.

Trade Journal: Long $LK - Inside Day/Coiled Spring - 2/18/2020Ever since the Muddywater news drop and recovery, LK had been consolidating right under 39 before recently breaking out. LK had been holding above the rising 50MA indicating strength. On 2/13 and 2/14, LK made two inside day candlesticks in a row and formed a coiled spring on the 30m timeframe. This is an indication of future volatility and a possible breakout. My gameplan was to go long on 2/18 when LK broke out and above 39.
Entry - 39.93
Stop loss - 37.33
Target - 50

UTX Breaks to the UpsideAfter a month of sideways action, UTX broke to the upside to resume an uptrend. UTX candlesticks lengthened just prior to the run up.

JPM Dark Pool Quiet DistributionJPM has been running well over the past quarter. However, as the fractional and odd lot new investors buy, the giant Buy Side Institutions are selling. The white candlesticks over the past few days reveal just how heavy the Dark Pool large lot selling is, as the gains are below the previous highs. The risk is that the new investors may run out of capital, which could create a sell down at least temporarily.

CSX Bottoming FormationCSX is in a bottoming formation with higher lows but consistent highs within the bottoming action. The candlesticks are now in a common compression mode with moderate volume supporting upside action.
