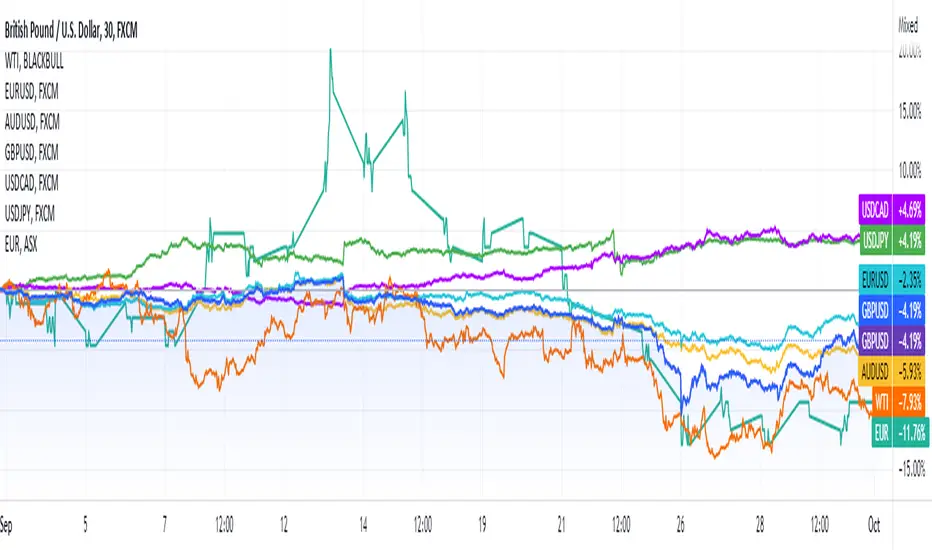
Bank of England raised rates by 75 basis pointsEUR/USD 🔽
GBP/USD 🔽
AUD/USD 🔽
USD/CAD 🔼
USD/JPY 🔼
XAU 🔽
WTI 🔽
After the Federal Reserve’s 75 basis point rate hike, the Bank of England has followed suit - though notably less inclined to continue aggressive tightening, being warier of an economic recession. GBP/USD lost over 230 pips to a closing price of 1.1165, while EUR/USD slumped from a high of 0.9943 to 0.9751.
Later tonight, Mitrade anticipated the US Nonfarm Payrolls to increase employment by 200,000 displaying the resilience in the labor market, hence justifying the hawkish stance of the Fed. Recent rate hikes saw USD/CAD climbing to 1.3745, and USD/JPY rising over 30 pips to 148.27.
Due to China’s zero-COVID policy and continued tightening among global central banks, the gold price rebounded from a month-low of $1,617.05 to closed lower at $1,629.65 an ounce. The commodity-sensitive AUD/USD pair declined and stabilized at 0.6287, as WTI oil futures fell to $88.17 a barrel.
Search in ideas for "COMMODITY"

WTI OIL Short-term breakout levels and one long-term to considerWTI Oil (USOIL) broke today above its 4H MA50 (blue trend-line) after three consecutive rejections and is going for the 1D MA50 (green trend-line) test where it was rejected on October 20. A break above it would be a short-term bullish break-out signal, targeting the top (Lower Highs trend-line) of the Channel Down pattern that the commodity has been trading in since June 29 (rough estimate 90.00).
Remember that this is the very same Channel Down that helped us take an accurate sell position 2 weeks ago as shown on the chart below:
If however the price breaks below the (dashed) Higher Lows trend-line, we will take it as a break-out sell signal, initially targeting the middle (dotted line) of the Channel Down, which is where the crucial 1W MA100 (yellow trend-line) is and then the September 25 Low (76.20) in extension (but only if the 1W candle closes below the 1W MA100).
Keep in mind that the only level we can buy comfortably on is upon a break above the 1D MA100 (red trend-line), which has been unbroken since July 05. That would target 105.00 initially.
-------------------------------------------------------------------------------
** Please LIKE 👍, SUBSCRIBE ✅, SHARE 🙌 and COMMENT ✍ if you enjoy this idea! Also share your ideas and charts in the comments section below! This is best way to keep it relevant, support me, keep the content here free and allow the idea to reach as many people as possible. **
-------------------------------------------------------------------------------
You may also TELL ME 🙋♀️🙋♂️ in the comments section which symbol you want me to analyze next and on which time-frame. The one with the most posts will be published tomorrow! 👏🎁
-------------------------------------------------------------------------------
👇 👇 👇 👇 👇 👇
💸💸💸💸💸💸
👇 👇 👇 👇 👇 👇

Brazil to enter the next round of the presidential electionEUR/USD ▶️
GBP/USD 🔼
AUD/USD 🔽
USD/CAD 🔼
XAU ▶️
WTI 🔽
A fine margin in the results has denied an outright victory in the Brazilian presidential election, both former and current presidents will go head to head in the next round. While the people are divided by their choice of leader, potential unrest lies ahead if the final result sparks controversies.
As an oil producer and commodity exporter, this could further disrupt the global supply chain. WTI oil futures declined to $79.49 a barrel and just surged to $81.67. Despite experiencing considerable fluctuations, recession fears kept gold prices mostly steady at $1,660.98 an ounce.
After rebounding from 0.9744, the Euro then closed to 0.9799 against the US dollar, and GBP/USD went higher to 1.116. Later today, both Germany and the UK will provide their manufacturing PMI readings for September, the market expects the manufacturing sectors would not change in terms of performance.
Tomorrow morning, the Reserve Bank of Australia is going to announce its interest rate decision, current estimates anticipated a 50-basis point increase to 2.85%. Meanwhile, AUD/USD recovered from a low of 0.6397 to 0.6402, recording a loss of over 100 pips. USD/CAD closed at a high of 1.3826, and the US manufacturing PMI will be available early tomorrow.
More information on Mitrade website.
September Commodity Trading at a GlanceSummary of the last September WASDE Report:
***WHEAT***
– U.S. wheat outlook for supply and use is unchanged this month
– Global wheat outlook raises supplies, consumption, exports, and ending stocks this month, as production increases for Russia and Ukraine, more than offset a decline in beginning stocks. Area harvested, yield, and production for Russia will all reach record highs. The Ukraine production forecast is increased as higher yields in the Forest and Forest-Steppe zones
***CORN***
– U.S. corn outlook is for lower supplies, reduced exports and corn used for ethanol as on reductions to harvested area and yield
– Foreign corn production is forecast higher with increases for China, Ukraine, Canada, and Mozambique more than offsetting reductions for the EU and Serbia. China corn production is raised as abundant rainfall
***RICE***
– U.S. rice this month is for lower supplies. Lowest U.S. rice production since 1993/94
– global outlook is for lower supplies, higher consumption, reduced trade, and lower stocks.
***SOYBEANS***
– US Soybean production is projected down with lower harvested area and yield. Higher cottonseed production.
– Worldwide, Ukraine’s soybean production is raised on higher area. China soybean imports for 2022/23 are lowered. Global soybean ending stocks are down mainly on lower U.S. and China stocks. EU soybean imports are lowered with higher supplies of other oilseeds.
***SUGAR***
– U.S. sugar stocks are reduced as combined lower production and imports are only partially offset by lower use. Deliveries for human consumption are reduced.
***LIVESTOCK***
– Beef production is raised for the second half of the year with higher expected slaughter for the period. Cattle price forecasts for 2022 are raised on current strength in demand, but forecasts for 2023 are unchanged.
***COTTON***
– U.S. cotton projections include higher beginning stocks, production, exports, and ending stocks this month.
– The 2022/23 world cotton projections include higher production and ending stocks relative to last month, and lower consumption.

Global Commodity Price Index versus SPXCommodities are basic good used in commerce of primary origin, produced on a large scale and used as raw materials by various economic agents.
Examples are soy, corn, cotton, meat, oil, natural gas, wood and water.
They are classified, according to their origin, into agricultural, livestock, mineral and environmental.
Its main function is the supply of raw materials for the production of industrialized goods.
Its commercialization works, according to the international market, through negotiations carried out on stock exchanges.
They are of paramount importance for the supply of primary goods for the functioning of society.
(Mundo Educação - UOL)
This index represents the benchmark prices which are representative of the global market.
They are determined by the largest exporter of a given commodity.
Prices are period averages in nominal U.S. dollars.
(fred.stlouisfed.org)
This index is at an all-time high, due to the high cost of energy and the world apocalyptic scenario.
The Stochastic RSI on the monthly chart is about to cross downwards.
Allied to this, the correlation with SPX is decreasing, which could indicate an important moment.
Historically, when these two technical events happened (stochastic crossing down and correlation falling), there was a sharp drop in SPX.
This can be seen in the red circles.

Market participants are alert ahead of US inflation statisticsEUR/USD 🔽
GBP/USD 🔽
AUD/USD 🔽
USD/CAD 🔼
XAU 🔽
WTI 🔽
On a weekly basis, the American dollar continued to lose ground throughout the early part of the day, but gained some ground during the US session. The volatility of the market was rather low, despite persistent US inflation figures.
According to the US Consumer Pricing Index, investors are expecting that the price pressures started to ease in July. However, the core annual reading is expected to increase from 5.9% to 6.1%. In the end, the Federal Reserve's monetary policy will be priced into the market rapidly by speculative interest. The Chinese and German inflation data will be released prior to the US inflation data.
The EUR/USD pair came close to touching the 1.0250 level but lost about 50 pip before the closure. The news that Russia has stopped shipping oil through the southern Druzhba pipeline due to problems with transit payments weighed on the common currency.
The UK government is preparing for organized electricity outages for businesses and homes this winter as a worst-case scenario due to the energy crisis plaguing Europe. Prior to the start of Asian trading, GBP/USD is trading at about 1.2060.
By day's conclusion, commodity-linked currencies had depreciated against the dollar, though losses are small. While USD/CAD is centered at 1.2890, AUD/USD trades around 0.6950.
One of the top performers was gold, which reached an intraday high of $1,800.49 per troy ounce. It was $1,795 at day's end. Although the day started with higher crude oil prices, it ended with only slight increases. The price of WTI is $90.70 per barrel.
Following in the footsteps of its European counterparts, Wall Street dipped, albeit losses were restrained. On the other side, the 10-year note's yield, which is currently 2.79%, increased a fraction.
#market #AUD #GBP #USD #DOLLARS #CAD #INVESTING #INVESTMENT #MITRADE #TRADING #PRICING #INDEX #INFLATION

Crude Kaput-edSo... Crude appears to have kaput and broke down quite a bit. Changed outlook, and the triangle has been readjusted and immediate target at 84 for the week ahead; and lower to 70 if the downside momentum continues.
With the long weekly candles (momentum), slicing through the weekly 55EMA, breaking down the support ranges, and alignment between the weekly and daily technical indicators; and in addition, a trend change pattern breakdown as well. These, together with this past week's breakdown, and the breakdown of the earlier triangle, more downside can be expected, as far down as 70.
That is what the chart is telling right now...
A very interesting, and admittedly, unexpected outcome for an energy commodity. Perhaps the spectre of a recession is that overwhelming.

Recession concerns dominate the headlinesEUR/USD 🔼
GBP/USD 🔽
AUD/USD 🔼
USD/CAD 🔼
USD/JPY 🔽
USD/CHF 🔽
XAU 🔽
WTI 🔽
As the dollar remained strong, EUR/USD reached a 20-year low of 1.0160 on Wednesday. Amidst predictions of a local recession and an impending energy crisis, the shared currency is among the weakest.
The GBP/USD exchange rate fluctuates about 1.1930, under pressure as the UK government crisis intensifies. Over thirty officials resigned, and many others begged Boris Johnson to quit. The 1922 Committee, comprised of Conservative backbenchers, sought to alter the rules that shield PM Johnson from the second vote of no confidence.
The FOMC issued the Minutes of its most recent meeting. The memo demonstrated that Federal Reserve officials concurred that rising inflation necessitated restrictive interest rates and are willing to become even more stringent if inflation persists. In addition, most respondents perceived an adverse risk to growth and a "substantial danger" that rising inflation may stay entrenched. The US Federal Reserve opened the door for another 75 basis point rate rise.
Wall Street struggled to register gains throughout the day, but significant indices ended higher. Although the FOMC Minutes' hawkish tone, policymakers refrained from discussing a 100 basis point (bps) rate rise, despite committing to do everything necessary to combat inflation. In addition, policymakers abstained from discussing the recession.
The yield curve for US Treasuries remains inverted. Currently, the 10-year note yields 2.93 percent, while the 2-year note yields 2.97 percent. Typically, an inverted curve is viewed as an early indicator of a recession.
Against the U.S. dollar, commodity-based currencies exhibited minimal movement. The AUD/USD exchange rate is around 0.6780, while the USD/CAD exchange rate is approximately 1.3040.
The USD/CHF exchange rate touched a new monthly high of 0.9743, while the USD/JPY pair finished at 135.85.
Gold reached a new 2022 low of $1,732.19 per troy ounce before the end of the trading day. The current price of a barrel of WTI crude oil is $98.40.
More information on Mitrade website.

The Dollar maintains its momentum ahead of the FedEUR/USD🔼
GBP/USD🔼
AUD/USD🔼
USD/CAD🔽
XAU🔽
WTI🔼
As anxiety dominates financial markets ahead of the US Federal Reserve's decision, the US dollar maintained its strength on Tuesday and Wednesday's opening hours.
Market participants had long anticipated a 50 bps increase, but on Monday, market chatter suggested the central bank may opt for a 75 bps increase. In addition, US officials will give updated Economic Projections, which might result in a protracted aggressive attitude if the new scenario suggests stagflation.
Regarding Eurozone, ECB member Klaas Knot hinted at more rate rises in October and December while maintaining a 25 basis point increase in September.
The United Kingdom delivered mixed employment figures, as the unemployment rate increased from 3.7% in March to 3.8% in April. Still, the number of persons seeking unemployment benefits decreased by 19.7K in May.
The EUR/USD pair stays above 1.0400, while GBP/USD trades at 1.1980, its lowest level since March 2020. The AUD/USD pair continued its decline to 0.6850, while the USD/CAD pair trades at 1.2955, as the weak performance of stocks and falling gold and oil prices sapped demand for commodity-linked currencies.
Wall Street continued under selling pressure, although the Nasdaq Composite managed to notch a 0.10% gain.
Yields on US government bonds continued to rise, with the yield on the 10-year Treasury note reaching a 10-year high of 3.489%.
More information on Mitrade website.

Ascending Triangle Setup on Silver, Target at 25.40Trend Analysis
The main view of this trade idea is on the 15-Min Chart.
Silver (XAGUSD) appears to be in an ascending triangle setup with the support trendline being created from the higher lows of 23.85 and 24.25. The resistance line of the setup is seen around 24.65. Completion of this target is projected to be at 25.40. A breakdown of the setup will be known if Silver falls below 24.20.
Technical Indicators
The technical indicators are displaying bullish signs for the commodity. The metal is currently trading above its long term moving average (200-SMA). Also, the Awesome Oscillator (AO) is green and trading above 0. The RSI indicates bullish price movement as well, with its level above 50.
Recommendation
The recommendation will be to go long at market, with a stop loss at 24.20 and a target of 25.40. This produces a risk/reward ratio of 1.64.
Disclaimer
The views expressed are mine and do not represent the views of my employers and business partners. Persons acting on these recommendations are doing so at their own risk. These recommendations are not a solicitation to buy or to sell but are for purely discussion purposes. At the time of publishing I have exposure to XAGUSD.

long term CCI trend changing signalAs you know, CCI(Commodity Channel Index) is the indicator of how difference from MA(Moving Average). If CCI(period) value is 0 then it is the same value of the SMA(price, period). Indication of overselling or overbuying will be counted by -100 and 100 value of CCI. What I chose value is 240. which is almost a year of period. My signal will be plotted this long term CCI indicator cross over -100. But I don't want it to be marked in case of long term CCI value fluctuating from -101 to -99 which will be marked frequently. Thus I put candle counter of 60 days after cross under -100 then only I count for cross over -100. By this I have very good signal to mark on the chart. Please enjoy my signal and have good profit from it~! Gazua~!

PLATINUM may be on the verge of a strong year-end rally!XPTUSD (Platinum) has had a strong rebound last week that started exactly on the Higher Lows trend-line of June 2020. The commodity may be repeating the 2020 pattern that lead to a massive end-of-year rally.
However it needs to get past (break and close a 1D candle above it) the 1D MA50 (blue trend-line). As you see since XPTUSD hasn't closed a 1D candle above it since May 18 2021 with the rejections on it being brutal every time. In 2020 once it closed above it, the price soon started a strong rally. Notice how the RSI is on Higher Lows now in similar fashion as in 2020.
** Please support this idea with your likes and comments, it is the best way to keep it relevant and support me. **
--------------------------------------------------------------------------------------------------------
!! Donations via TradingView coins also help me a great deal at posting more free trading content and signals here !!
🎉 👍 Shout-out to TradingShot's 💰 top TradingView Coin donor 💰 this week ==> Vergnes
--------------------------------------------------------------------------------------------------------

Palladium Hits Strong Resistance! What Next?Since our last post, palladium has made good progress, moving up $90 to meet the resistance
from February 2020. Price is at an interesting point, because a clean break above and we
should see price move towards the all-time high at $3017.
The weekly 50 simple moving average has aided this gradual upwards move. The first break of
$2875 was short-lived as price came tumbling down and reentered consolidation in April/May.
Price is still in consolidation, and the longer it does so, the bigger the move we can expect
in the direction of the breakout.
So should we see a breakout to the upside, which is the bias as the prior trend was bullish,
we can expect a solid long-term uptrend to unfold.
This is why we want to position ourselves to take advantage of any breakouts that may occur.
It will require some patience while price sets itself up, but the reward will more than make
up for the time sitting on the sidelines.
We will continue to follow the journey of this commodity.
See below for more information on our trading techniques.
As always, keep it simple, keep it Sublime.

WTI - RANGE BOUND!WTI - RANGE BOUND!
Commodities overall since last yr are on a rise as seen on commodity index, I mean look at lumber and various others the % of return has been great and this has been increasing due to inflation, lower dollar etc.
For now WTI - We are still within the range technically.
Pattern: Pennant
Support: 62.62, 60.30, 59.15, 57.20, 55.40
Resistance: 67.15, 69.75, 72.65, 75.15
A break to either direction for further clarification, the key trendline up staying above the bulls are still in control if we break below trendline up bears may start coming in.
Trade Journal
(Just a trade idea, not a recommendation)

Gold: "I like the commodity"Gold getting hit by rising bond yields, a side ways trading dollar & risk appetite in broader markets. But... I like the commodity. My longer term view is still 3000 gold. If it starts breaking down from here though I would worry about a technical sell off on broken support (Could be looking at around 1600s in that scenario). But if we get a contraction in volatility around these levels and let people get comfortable at this support you could easily see that 2000 mark broken in just a few weeks once gold gets moving and say goodbye to it for a long while. For this to happen watch 10yr yields like a hawk and hope for a reversal (Based on fed buying potentially if a taper tantrum comes). Also dollar would have to continue its slide down towards it's next support around the 88 mark. Long or short... Good luck with your trades!

Dollar would gain power next year...Dollar would gain power next year after Covid19 and money printing Crisis. This power will flow from tech to commodity.

Will October be Déjà vu for NATURAL GAS?Quick observation here. NG traders that are deep into the commodity's technical dynamics agree that Natural Gas is trading on patterns that are cyclical on the very long-term.
If cyclical behavior and seasonality play a big part on this, then why should the month of October be any different? Every 4 years since 2012, NG makes a bottom around March-April, then rises aggressively up until October, which initiates a pull-back. That pull-back appears to be a Bull Flag for a new High a few months later.
Will history repeat itself?
** Please support this idea with your likes and comments, it is the best way to keep it relevant and support me. **
--------------------------------------------------------------------------------------------------------
!! Donations via TradingView coins also help me a great deal at posting more free trading content and signals here !!
🎉 👍 Shout-out to TradingShot's 💰 top TradingView Coin donor 💰 this week ==> AxelShadah
--------------------------------------------------------------------------------------------------------

Sept20 - CPO (1M) - New Bull Cycle if Stays Above R@2.8-3.1kI just did a long-term analysis on Bitcoin, which yielded a similar outcome -- long term Bull Cycle.
Fundamentally, I'm suspecting this is a signal for what's likely to come next -> High-Inflation or Hyper-inflationary era due to overprinting of USD (global reserve currency), which is typically marked by inflated food/soft commodity prices , & a capital flight to alternative store of value .
Back to CPO, we've been in the WXY (Elliott pattern) or triangle consolidation phase for over 10yrs, since 2009 sub-prime plunge.
Post-COVID bounce does seem to be taking an impulse 5-wave form so far, suggesting a potential wave1 of new Bull trend, for as long as price stays above 2800-3100+ R-zone.
Successful standing above Major R1: ~2.8-3.1k, on the next test, will mark the end of long term consolidation.
Happy Hunting! 🥂🚀
-jk-

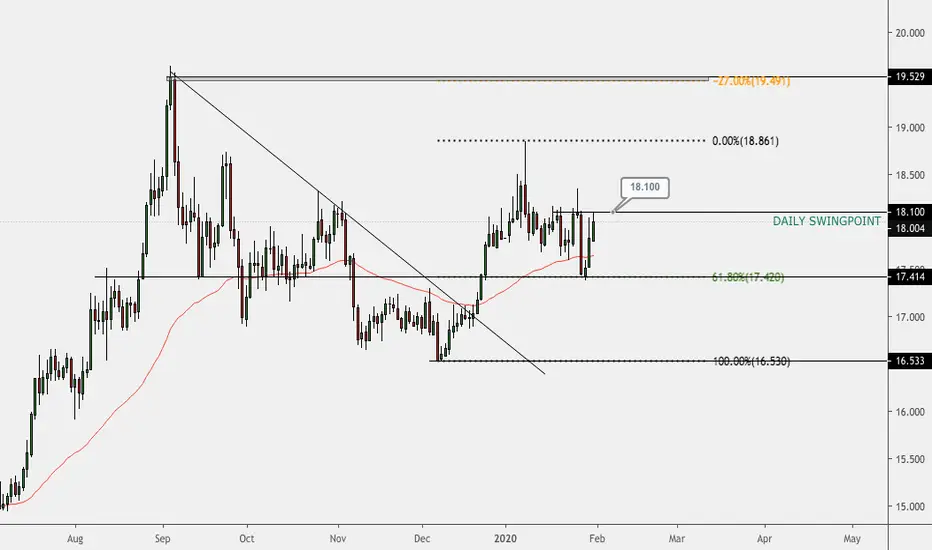
SILVER LONGI have a bullish bias on this commodity. Price has come and hit the 61.8% fib which lined up with structure and the daily 50 EMA. However, i will only enter long positions when the swing point at 18.100 has broken on the daily. While below the swing point price could still come back down before coming back up to the highs.
Visual CCI with Smoothing OptionVisual CCI by Bert2020
Displays the CCI (Commodity Channel Index) indicator with background colors making it more readable when the values go outside the bands.
Here's a list of included features:
All the CCI parameters (length and band limits) are configurable from the user interface.
The smoothing option (off by default) helps eliminate some noise by applying EMA when CCI values are outside the defined limits . It also merges events that belong in the same trend.
The colors and line styles are all configurable including the band and shape backgrounds.

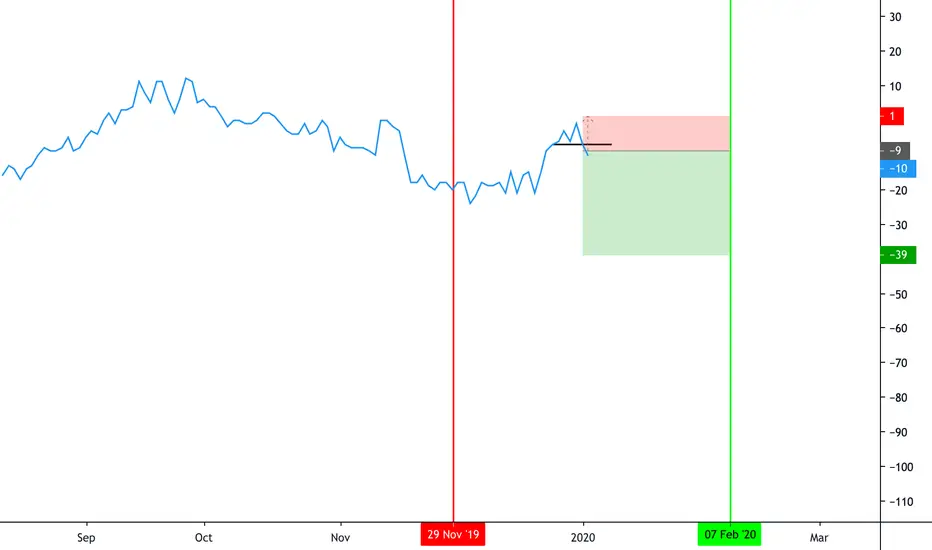
CCH2020-CCK2020 - Breakout on Cocoa SpreadCCH2020-CCK2020
There goes another one of our alerts in the commodity spreads.
In this case it is an intramarket spread on cocoa.
You buy the March futures (CCH2020) and sell the May futures (CCK2020)
After a retracement phase within the seasonal window, the breakout of the Middle Valley level between the two highs took place, thus forming the classic "Double Top".
The statistics of the past 15 years, together with the technical analysis, guide us in mentally positioning the Stop Loss, and in the platform the Take Profit.
SELL LIMIT @-09.00 STOP LOSS @01.00 TAKE PROFIT @-39.00
KEN2020-KEK2020 - Commodity Spread on Coffee FuturesKEN2020-KEK2020
Rising triangle in formation on this spread between two wheat futures contracts.
Statistically, in the previous 15 years of our seasonal window we have come to profit in 100% of cases with an average risk reward of 3:1.
With this strategy we started trading years ago, bringing us considerable profits that made us understand that operating in the financial markets was an incredible potential source of income if done with professionalism and discipline.

ZWZ2019-ZSX2019 - Commodity Spread TradingZWZ2019-ZSX2019
Wheat December 2019 - Soya November 2019
Interesting spread between the December futures contract of Wheat and the November contract of Soya.
As it is statistically deduced from our software, in this case the Moore Research, we have a percentage equal to 87% in which this difference is reduced, and therefore, a normal convergence of the two values of the contracts that bring their distance closer to 0 rather than move it away.
The very nice thing about this type of operation is the reduction of the volatility that can cause sometimes big problems. For example if on the soya there should be some important news its value could vary suddenly and the grain, being a correlated of it, would follow it consequently and it is for this reason that through the Spread Trading these potential unexpected problems are avoided.
www.mrci.com
