Crypto Mid-Week Analysis | Jan 12, 2022Crypto still testing MAJOR SUPPORT LEVEL! There is the roadmap ahead!
Search in ideas for "CRYPTO"

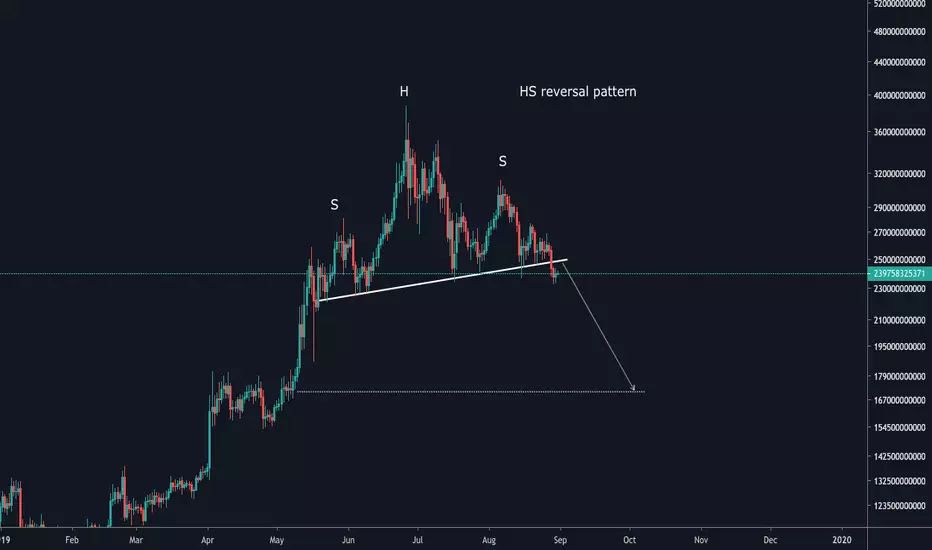
Crypto ICPUSDT (Sunshine After The Rain? )Crypto ICPUSDT (27 Dec 2021)
ICP in the slide (BIG slide) since beginning and we are seeing some rebound for the past few day.
It is facing its first hurdle near 28.65, and it may pass thru with one bullish push.
If it happens, I expect ICP may revisit to $38~$40 region.
Let's see.
DYODD, all the best and read the disclaimer too.
Feel Free to "Follow", press "LIKE" "Comment".
Thank You!
Legal Risk Disclosure:
Trading foreign exchange or CFD on margin carries a high level of risk, and may not be suitable for all investors.
The high degree of leverage can work against you as well as for you. Before deciding to trade foreign exchange you should carefully consider your investment objectives, level of experience and risk appetite.
The possibility exists that you could sustain a loss of some or all of your initial investment and therefore you should not invest money that you cannot afford to lose.
You should be aware of all the risks associated with foreign exchange trading,
and seek advice from an independent financial advisor.
DISCLAIMER:
Any opinions, news, research, analyses, prices or other information discussed in this presentation or linked to from this presentation are provided as general market commentary and do not constitute investment advice.
Sonicr Mastery Team does not accept liability for any loss or damage, including without limitation to, any loss of profit, which may arise directly or indirectly from use of or reliance on such information.

Crypto Markey first Target: 2.050 TThe Crypto Market has a downtrend and the first target is 2.050 T.

Cryptos: buy the stoploss that you would have planned for.Crypto is trappy, but the bullish trend is still intact. If you want to buy the dip, buy the stoploss. Not saying it will work out, but trap is just way too common here in this market.

Crypto bearish?! No, everything is fine!After a nice and long summer holiday I'm back for you all to help you out here and there to understand what is going on in the crypto markets. We have seen 7 consecutive green weeks and thus its time for a correction. Should you panic!? No.
Market maker vs. leverage and stop losses
The total crypto market (altcoin market displayed above) is looking very bullish regardless of the fast correction from this week. Traders have been stacking longs with high leverage and high profits and of course at some point its time for the market maker to bag his profit . Each time these fast corrections happen the same emotion is triggered: fear. With exchanges running low on ETH supplies and in general having sold truckloads of any coin, its is normal the market maker needs to bag up again. Fear is the perfect instrument for that together with a solid algorithm that hunts liquidations and stop losses. I haven't checked how many bulls got rekt on this dump but I bet there would be hundreds of millions of liquidations and that is free crypto for the market maker, which thanks you yet again for not taking profits or going long at a local high. Now, after a quick look on tradingview, it looks like most retail is going short right now, which is again a lovely deal for the market maker. Why?
TOTAL2 to 2 trillion
Well I expect a bullish reversal on Monday with the weekend providing choppy action. We could see some more downside to get rid of weak hands and in general provide some more liquidity to the market maker's longs. Yes he went long all the down from the previous highs back in April / May and he's building longs as we speak. I expect Monday or latest Wednesday for the market to reverse to the upside unless there is big news that prevents a bullish scenario. On the bigger timeframe we could be seeing something like a cup and handle forming although this is far from confirmed but it is a pattern I am looking out for. I do expect altcoins to smash their previous total cap and head for the 2tn mark. From there we can re evaluate, for now there isn't much to do in this market; I suggest you have a nice weekend and come back on Sunday night. :)
IMPORTANT: this is not financial advice, trade or invest based on your own risk and research.
MORE INFO: have a look at my previous analysis on why trends always reverse for further reference.

Crypto Bull Run : Opportunities that you should not miss!!! Crypto Breakdown :
Hello traders , here's my point of view about the crypto Market , Of course it's all about probabilities , everything is possible and everything can happen .With that being said make sure to let us know in the comment section your point of view about it , make sure to follow

Crypto 🐋 Whale BITCOIN and Ripple moving at trendBitcoin and Ripple moving at same price or same trendline to dip a more Market it's just big planing of Crypto 🐋 Whale and just watch and take benefits of Market Trends.

Crypto & Market Makers: how trends always reverse!The total crypto cap just fell out its rising wedge which means the market is in for a correction! Like I said at the start of the week, there were too many green days stringed together in cryptoland; which only means one thing: a correction is coming!
Be aware of the market maker!
Now let's have a conversation! We just came out of an insane run to the upside which many people believed Bitcoin (and alts) would go straight to the moon! Let me tell you something: the chance of such a scenario is zero. Why? Because (like I said) these markets are MADE by market MAKERS. If they let cryptoland run only run up without any retraces or corrections; they lose money. Are they in this business to lose money? No, they are not. They are not some sort of charity organization, quite frankly the opposite. This means that every time you buy or (even worse) place a leverage trade; they are on the opposite side of your trade. That means for them to make money, they need to bring the market to the opposite direction of where you think / want the market to go. Like I said earlier this week; BTC longs are at all time high; that means Bitcoin can never go the moon, impossible. Why? Because the market maker would lose money and guess what? They never lose money because they have enough liquidity to compete with Elon Musk, Bill Gates and George Soros at the same damn time.
How market makers always win.
So how do they work? Very simple: they use price action to trigger your emotions; equivalent to: Bitcoin to the moon or Bitcoin to zero. They run price in any of those directions, get traders committed to a move and before they know it reverse the trend in the opposite direction to bag THEIR profit. This what they do over and over and over again - and as longs as people act like people - they will win this game over and over again.
How to trade with leverage
So whats next? Well, first off; the market is likely to hit the liquidity box as seen on the chart. This is because the liquidity is there. What is liquidity? Liquidity are people's stops or liquidation points. Market makers will hunt those areas and that's why I never put a stop loss (in loss!) but monitor my trades in real time and close them when they are about to turn against me; like my last ETH trade. To be profitable with leverage you run a sum zero risk game, when in profit; trail your trade with a stop loss in profit or manually close it as soon as there are even just the slightest indications of price turning against you. Like I say in my bio: you do not hunt for maximum profit; you trade for maximum consistency of profitable trades, even if its just a couple procent. That said, if you want to be consistent in profit without staring at charts all day? You buy fundamentally strong coins at bear markets lows or DCA during bearish times, then you hodl until you see bull market mania. That's where you DCA OUT OF THE MARKET and wait for a bearish trend. Rinse, repeat. In general, only trade with money you can lose and never, never, never, ever sell a hodl portfolio at a loss. My own first chunk of a Bitcoin was bought in 2017, missed out on the top and hodled throughout the whole bear market and was sold at 64K 4 years later. (Why I sold there you can see with the analysis I made of April 14 linked below)
The state of the current crypto market
For the long term the crypto market is very bullish! There is no doubt in my mind about that. However we need to have a close look at how this mini bear market turns out. The runup of last week was unlike other runups with the RSI clearly breaking out of the bearish trend on the daily timeframe. However; the weekly and monthly time frame are still waiting for a confirmed bullish reversal. This is why I said at the beginning of the week that if you missed out on this latest move, accept that you missed out and sit on your hands. I have to admit that I missed it too as I'm trying to enjoy summer a bit after a winter full of trading. What I did do is hedge my risk; which means that deployed 20% of my stable coins into coins that I deem to be underpriced and I have 80% still waiting for the bottom of the current correction or possible the bottom of the bear market. Now, I will have some drawdown on that 20% of my portfolio in the coming week or two; that is likely but it is not a problem as I am 100% sure that those coins will at least 2x my buy in price in the coming year or (at worst) two years.
Support zones to consider
There are a few key support zones to consider; first the bullish support zone at the golden pocket. Staying around or above these levels for another week will most definitely lead us into more bullish action. Secondly; there is the liquidity zone; the preferred zone to take the market for the market makers; this is the most likely support zone. Thirdly we have a bearish support zone below that; even there we have a bullish scenario if we hold support at the bullish trendline. However if we break into the box or below our lowest low (dotted line) we might very well be in for more pain! Lets see what the weekend and the coming week bring us... Good luck to you all and trade safe!
IMPORTANT: this is not financial advice, trade or invest based on your own risk and research.

CRYPTO CHA CHA CHART STEPHAN DIAS MD CRYPTO CHART THAT HAS BEEN VERY EFFECTIVE FOR MYSELF SINCE I HAVE BEEN TRADING. WORKS GREAT. GOVE IT A TRY

CRYPTO WEEKLY #19 (2021)The crypto market is up for a rough week with Bitcoin in a downtrend, the majority (if not all) of the market will go through pain in the coming week. It is to be seen where we can expect a temporary bottom for BTC but if we don't find one above 42K, the market is going for a correction.
Currently we already see a head and shoulders on the total market cap without BTC and its trading on support inside the wedge. When we decisively breakdown from the wedge; I believe we will test support at the 1 trillion dollar supply zone and if that doesn't hold - we go for sub trillion levels of which the red target zone is the most likely one. Buy opportunities will come once we find a local bottom...
We could see some more fake out behavior to the upside or (even better) see money move from Bitcoin to the other coins and BTC becoming less relevant in the time to come... However this will take some time. A bullish scenario for (certain) alts is definitely not excluded yet however the risk / reward ratio for the market as a whole is unsatisfactory at time of writing.
IMPORTANT: this is not financial advice, trade or invest based on your own risk and research.

#Crypto #Bitcoin $BTC $BTCUSD Overall Signal -- Maintain Buy#Crypto #Bitcoin $BTC $BTCUSD
Chart TF 1D
Overall Signal -- Maintain Buy
TP: 58k (The next key level, expect alot of profit taking)
EMA abv 10; abv 20,50,100,200 - BULLISH
ICHIMOKU abv Kijun, Abv cloud - BULLISH
SStoch Overbought
MACD Buy
#PersonalOpinion
#DoYourDueDiligence
.
#Ethereum $ETH

Cryptos Collapse!! What to do ?? 😱Cryptos have gotten battered last night in the Asia-Pacific session. This is a proper crypto selloff that we have not seen in a while, because cryptos have been mooning for some time now. But these dumps should be anticipated and tend to come out of nowhere. This is not the end of the world and we are still very bullish of Bitcoin, but technical retracements do happen, and there were clear signs of over leverage and exuberance in the system. BTC appears to be finding support from $45K, a psychological and technical level as well as $45.6K. It could certainly pull further and $42K is the next support level. On the upside, it will be a bit of a struggle to reclaim $50K and $48.2K will be in our way first.

Crypto Legend Alex Vieira Live Trading on Ethereum ETHUSD $1,940Crypto Legend Alex Vieira Live Trading on Ethereum ETHUSD reduces for the first time his investment at $1,940 today after calling a bottom at $220. In 2017, he urged Ethereum investors to sell everything at $1,4005 making it public on YouTube Live forecasting a crash.


BTC to see crash to 8300$ before a rise to 9400$Crypto-AST BTC/USD Weekly Breakdown - 27/01/2020
Daily chart
- On our last major breakdown of BTC/USD, we noted that we should expect bullish price action on BTC to the 9200$ zone and after brief consolidation at this price, we would go on to the 9400$ price level. We also noted that in terms of the bigger picture, we expected BTC to finally ascend to the 10218$ resistance level at the downtrend line. None the less, we witnessed the bears take back charge in the market at 9200$ and slam dunk price to the 8250$ level to meet EMA 200 support on the daily chart and we have since remained pretty inactive in the market till we got a good idea of what was going up. This weekly BTC breakdown will attempt to decipher the unusual price action we are seeing in the market and try to make a clear sense of things for the week ahead for us to trade off of.
- First thing to note is that the ascending fan support (shown by the blue line on our chart) was broken to the downside in order for price to see the 8250$ support level but we are currently trading just above the supporting trend line. We are also just below the resistance of the descending channel formed since highs of 12093$. In order to break through the descending channel resistance, we would need to see a break above the 8800$ price level and this would be a good indication of price returning to the 9000$ region before continuing its journey to both 9200$ and 9400$ respectively in accordance with our previous thoughts about price action in our last weekly breakdown of BTC. Even though we are generally bullish to the 9400$ level and thereafter to the 10,200$ level, it is important to note that from current price at 8649$, we may see price taking a double dip to the 8300$ price level before we actually continue to see a retest of the levels mentioned above and for as long as we remain below the 8800$ resistance level.
- We should be ready to short the market to the 8330$ price level in the case that we break below 8570$ and we should be ready to long BTC to 9000$ and 9200$ respectively in the instance that we break above the 8,800$ level. Bare in mind, that these are farsighted insights and we will be updating you frequently on both situations.
- On the daily chart, we can see that there is a bearish divergence between the RSI/ROC momentum indicator and the price chart + RSI stand alone indicator. This is again evidence for us to expect some bearish price action to the 8330$ level and price may go as low as the 8250$ price level in reality.
4 hourly chart
- Once we zoom into our microscope by switching to the 4 hourly chart, we realise a lot of confirmations of our initial thoughts from above. Firstly, all across from the price chart to the momentum indicators, we are at resistance levels on the 4 hourly indicating that bearish price action is imminent. But as stated above, we should be careful to short the market unless we see at least a hourly candle closing below the 8570$ level as anything above that is indicative of us still being in the ascending fan support. However, before any bearish price action begins, we may test highs of 8700$ and anything below 8750-8800$ is still within the descending channel structure and its just there to stop hunt early shorters in the market. Moreover, EMA 200 support is currently at 8200$ on the 4 hourly and this is a more unconservative take profit for those that are a little braver and are willing to move their stops into profit and let the trade run to this level.
1 hourly chart
- Switching to the hourly chart, we can firstly spot that we are at the top of our scalpers channel with MA’s being used as consistent support. We can also spot that even our momentum indicators are in overbought regions and this is indicative of bearish price action about to occur. Switching to more specialist chart settings, we can see that on the hourly, we are again seeing that bearish divergence taking place on the momentum indicators and giving us more confirmation of our initial thought that we will see bearish price action before seeing the bullish phase of our analysis set in. Lastly, its important to note that EMA support on the hourly is at 8500$ and thus once we short after a close below 8570$, we would need to move our stops to entry as soon as we hit the 8500$ mark.
Summary
- We should expect bearish price action to the 8330$ mark after a close below the 8570$ price level at least on the hourly charts. After price reaches 8500$, we should ensure to move our stops to entry. The opportunity to raise take profit to 8260$ is there as long as we continue to move our stops into profit even further OR we can at least close 50% of our position at 8330$ and let the rest run risk free with stops wide to 8570$.
- If we break above the 8800$ and close above this price on at least the hourly, we should be ready to long to 9000$ and 9200$ respectively.
- For the longer term, we still see price rising to the 9400$ and 10,200$ price levels in the few weeks ahead.
CHECK OUT OUR TELEGRAM CHANNEL DOWN BELOW FOR TIMELY UPDATES AND EXACT ENTRIES!

ETH to see bullish activity to 230$ before the bears return!Crypto-AST ETH/USD Breakdown - 15/01/2020
Daily chart
- ETH found support at 116$ and is now trading at 165$ just below the EMA 200 resistance at 175$ on the daily. This price level is also a resistance price level now because before it was a supporting price level and as we know, once supports are broken they turn into resistances. We have used MA’s as support in order to support this bull move. It would seem as though we will probably break above this EMA 200 resistance at 175$ due to the mere fact that BTC, which the whole market follows has phenomenal bullish tendency towards the 9400$ and 10200$ level at the minute. This will mean that price should and would rise to the minimum of 200$, which is also a resistance zone. Even more so, I would suspect price would rise to a final destination of 230$ before the bears take back charge and this was a price level, which had kept the price of ETH down below this level since august no matter the level of bullish activity in the market.
- In the long run, following a rejection from 230$, we see price descending back down to 133$ very swiftly with final buy zones in our books for ETH at a mouthwatering 40$ ; you know where you heard it first, while they all scream bull run with every minor bull move!
4 hourly chart
- On the 4 hourly chart, we can see that again the MA’s are being used as support since the 160$ level to keep price up and the EMA 200 being used as support since the 133$ support zone. Now, price is trading at just below the 175$ level at 167$ currently in real time. I would advice that we wait for the 175$ resistance to be broken before longing to 200$ and 230$ respectively - with that in mind, I would advice to place stops for this long around the 155-160$ price level with the latter being the better stop loss giving room for stop hunting. It is important to note that momentum indicators seem kind of fatigued to the overbought zones and thus a good confirmation of bullish over ride would come with a break above 175$ as stated above given the current bitcoin scenario.
1 hourly chart
- On the hourly chart for ETH, we can see that there is somewhat of a bullish divergence on momentum indicators - this is a good sign because it reduces the fatigue on the bigger time frames felt by the bulls and gives us a pretty much guaranteed chance of breaking above the 175$ price level. We are also getting strong bullish candles once we switch to other candlestick settings which indicate the power of the bulls and the bears, with the bulls gaining great momentum. Finally, we can fine-tune our stop loss with it being at just below the 160$ level and just below MA supports ; but note that a tighter stop loss gives a higher chance of stop hunting taking place.
CHECK OUT OUR TELEGRAM CHANNEL DOWN BELOW FOR TIMELY UPDATES AND EXACT ENTRIES!

XRP TO SEE A RISE TO 0.31$!Crypto-AST XRP/USD Breakdown - 15/01/2020
Daily chart
- On the price chart, we can see that XRP is just below main resistance region of 0.25$. This price level was previously a support zone but as we know, once supports are broken they become ceilings. It is extremely difficult for XRP to now break upwards of this level and if this occurs this is a good indication of bullish momentum to highs of 0.31$, which once again is another key resistance zones. None the less, we can observe that EMA 200, which has historically kept price down is currently at 0.27$ and even in the case that we break above the 0.25$ price resistance, we will have quite a tough time trying to break through this resistance at 0.27$. This is all an indication that there are many near term obstacles for XRP to overcome and the chances are even if it overcomes these obstacles, there is very little chance of breaking above the 0.31$ mark. In essence, there is short term bullish price action on BTC which could take us to highs of 9.4k and 10.2k and this would translate into XRP price with a rise to highs of 0.31$. Furthermore, XRP is already in overbought territory across momentum indicators and this would suggest that there is no way that we could see breaks above 0.31$ to the upside.
- Short opportunities would arise again once we see resistance at the 0.31$ price level and this would give us to see a momentous trade with targets to 0.18$ to the downside from 0.31$!
- In the long run, we expect XRP to topple down to 0.10$ and 0.15$ in order to see good long term buying opportunities. To put this opportunity into retrospective, 100$ invested at a 0.10$ low would equate to a return of 3000$ at the conservative recent high of 3$. With regards to the bearish price predictions, we do not mean to be pessimists but rather that this is an actual reality and its good to keep this in mind in your trading plan.
4 Hourly Chart
- On the 4 hourly chart, we can see that MA’s are being used as strong support and the chances of breaking above the 0.25$ resistance level seem greater. EMA 200 indicator has been used as support from the 0.21$ level and this is also a great indication of the buying pressure in the market. From this we can say that a good entry would be just above the 0.26$ mark with take profit at 0.27$ and 0.31$. An early entry is also possible at current price of 0.238$ with STOPS at 0.213$. None the less, I would advice the conservative entry of a break above the 0.26$ mark as there is some bearish consolidation below the 0.25$ price resistance and a mark of strength in the bullish direction would only come after a break of the 0.25$ price level.
1 Hourly Chart
- On the hourly chart, we see further confirmation of bullish price action by the fact that momentum indicators are in bullish territory ready for lift off. We can see that MA’s are being used as support just under the 0.25$ resistance level with good bullish candles in practise. For those looking to enter early, this is a good indication that a early entry with targets to 0.27$ EMA resistance and 0.31$, isn’t such a bad idea with STOPS at 0.21$ and gives us pretty good risk:reward.
CHECK OUT OUR TELEGRAM CHANNEL DOWN BELOW FOR TIMELY UPDATES AND EXACT ENTRIES!

Bitcoin to see 4800$ price level!Crypto-AST BTC/USD Breakdown - 13/01/2020
DAILY CHART
- There is somewhat of a descending wedge on the wider scale of the daily chart with higher lows created at 19533$, 13093$ and 10523$ respectively. It is also important to point out that our fan structure (light blue lines indicated on chart) which has previously been used as support was broken through and now is acting as a resistance at the 8440$ price level whereby we saw a rejection and a high recorded at this price before consolidation into the 7900-8100$ region as the bears took back charge in the market. Now, it would be quite a feat if the bulls are able to cross above the 8500$ price level with this fan structure acting as resistance and with EMA 200 as a resistance at this level. I believe that bitcoin should be heading towards the previous price ceiling of 7600$ and if price ceilings are broken, they become temporary supports, so it’s safe to assume we may gain some consolidation at this level before any further bearish movement - this is inline with the fact that MA’s are at 7600$ for support. In the scenario that we see a bearish stop hunt, I would assume that price has maximum upward pressure to 8350$ in this scenario.
- For a more longer term analysis of the bitcoin market, we are eyeing a return to the 6800$ level with this level being broken leading to 6500$ and in the scenario that 6500$ is broken, our target is for 5823$ whereby we will find momentary support and consolidation at this level ; this seems in line with the fact that EMA 200 support currently lays at this level following a rejection from the support bound of the fan structure forming resistance. The most solid support of the fan structure comes at the 5000-4800$ level with this also being the supporting of the descending wedge and also being the support of the fan structure.
- We have a massive bearish bias in the market with our buy zones at 4800$, 3,300$ and finally but most likely of 2,200$! We will consider turns in the market and bull run psychology entering the market at any of these given price intervals.
4 HOURLY CHART
- Now lets focus in more on our microscope and come to a judgement for the 4 hourly chart on the BITFINEX exchange. We can see that there is a bearish cross over of MA’s on the 4 hourly chart about to happen. Moreover, we can see that the MA’s are being used as support and a final break of the open of the latest candle at 8060$ will lead to a break of the ascending support line and also would lead to us swiftly making our way to the 7600$ EMA 200 support! None the less, as long as this supporting trend line structure is kept in tact, we may have wicks to as high as 8300$ but more reasonably 8200$ before bearish price action resumes.
1 HOURLY CHART
- We see more evidence of the idea that we could see a bearish stop hunt towards the 8200-8300$ region before bearish activity really kicks in by the fact that we are seeing MA’s being used a support on the hourly chart. Moreover, the trend line was also used clearly as support. A minor bearish crossover on MA’s seems to be turning bullish and we saw clear bullish reversal candle formation on the hourly. Moreover, its evident that we may not see a straight price crash to 7600$ but rather we may see some support forming at the 7900$ level for price consolidation to retest the 8100$ previous price floor before price resumes its journey to the downside. With this evidence, I would advice not to short just yet unless we see the 8300$ level at the least or a clear reversal from the 8200$ level OR finally a break of ascending support trend line below 8060$ with conservative take profit at 7900$ and then re-entering once 7900$ is broken to the 7600$ price level.
CRYPTOCURRENCY MARKET ANALYSIS OUT OF THIS WORLD!
Follow us on telegram by clicking the link below ;)

Crypto Starts To Move | Easy 70% For The Next Targets Crypto (CROBTC) just made a strong move and is now trading above EMA10 and EMA100.
We are active here and aiming at 400%+ of potential profits.
Volume is still low, after such a strong move... Signaling that there is lots of room left available for growth.
Expect a retrace and then another jump.
Chart:
Thanks a lot for your support.
Namaste.

Crypto (CRO) Prints Big Volume | 65%+ Next TargetCrypto (CROBTC) printed one of the biggest volume bar since March 2019... This is a very strong signal.
This high volume came in on the 14-Nov. to break above EMA50 and EMA10. Now that CROBTC is trading above these levels, it can easily go higher.
You can find some targets, support levels, and additional information on the chart above.
Feel free to hit LIKE if you want to see more charts.
Namaste.