ELY - following 15 minute chart patternsELY - following 15 minute chart patterns --- as it climbs with new higher lows throught the channel
Search in ideas for "Chart Patterns"


20191105 XRPEUR Open Short PositionHi there,
Just and idea after analyzing XRPEUR Movement this year and areas, specially supply and demand, and some chart patterns that indicates the price could go down before it starts up.
Right now, it's starting to curve, giving sign of downtrend. As usual btc goes on the hand of btc and since you may see in some analysis i have made on BTC, this could go down too.
More than once i have noticed volume blocks on Kraken on 0.19 euros. This could be anothr sign too. So, in personal opinion, it could be a good place to open a short position for a couple of months while price goes down to demand area.
Again, Just personal Idea and not financial advice.
Cheers!
Charter X

An Unique View on the Chart Patterns in GOLD!We seem to be stuck in a pennant but to me looks bear flaggy also.
Anyway, here's the broad concept of the way I see the chart patterns playing out.
I'm aware many traders aren't seeing it this way, and I am grateful for that.


audnzd. classic chart patternsGuys, if you tade classic chart patterns pay attention to this head and shoulders pattern.

4h.gbpusd.classic chart patternsGuys, this is a pennant (triangle) pattern. It is a trend contination pattern, so I expect price to move higher. I don't trade classic chart patterns a lot but I use them for confimation mostly. Have a good day

IOP Bullish Chart Patterns *UPDATE*Originally thought this would break out of the cup and handle but now were riding the ascending triangle. Beautiful chart patterns all over this coin! Check the description for a link to my signal service!

NZDUSD - No brainer chart patterns2 chart patterns
Ascending channel and head and shoulders = EXTREMELY Bearish


EURCAD Multiple Chart PatternsHello, here we have some interesting chart patterns on this pair
i am in for short for the rising wedge
lets see how this works
best of luck

Bottom Head & Shoulder, 80% Sell OpportunityChart Patterns: "Bottom Head & Shoulder", "Range Double Top"
Candlestick Patterns: "Pin Bar" & "Engulfing"
Entry price: 1.09670
Stop Loss Price: 1.10250 (58 pips)
Take Profit Price 1: 1.08865 (80 pips)
Take Profit Price 2: 1.07830 (184 pips)
Estimated Duration: 1-4 Days
Probability to Meet Target: 80%

Double Top & Bearish Momentum, 70% Sell OpportunityChart Patterns: "Double Top", "Adam & Adam"
Candlestick Patterns: "Strong Bearish Momentum"
Entry price: 1.24000
Stop Loss Price: 1.24762 (76 pips)
Take Profit Price 1: 1.22994 (100 pips)
Take Profit Price 2: 1.22472
Take Profit Price 3: 1.21635
Estimated Duration: 1-3 Days
Probability to Meet 1st. Target: 70%

Chart Patterns:3 Step Rocket Booster StrategyFeel free to rocket boost this content to learn more.
What is the best chart pattern to follow?
I was studying technical analysis and then i saw this on breaking news
about the Google stock going up.
Using the rocket booster i saw this stock last week.
I was testing the strategy to make sure it will work..
This strategy is valued at about $700 worth of trading losses.
And using it takes time to understand.
If you have no idea on how to stick to a strategy
you may end up selling a winning position.
The Rocket Booster Strategy:
#1- The price has to be above the 50 EMA
#2- The price has to be above the 200 EMA
#3- The 50 EMA should cross the 200 EMA
If you learn to stick to this strategy then you will be able to have confidence in your
trading journey and technical analysis.
Rocket boost this content to learn more
---
Trading signal: Buy
Stock:Google
Date:19/12/2023
---
**Disclaimer:**
The information provided above is for educational and informational purposes only.
It does not constitute financial advice, and trading always involves
--
a risk of substantial losses, regardless of the margin levels
used. Before engaging in any trading activities, it is crucial to
--
conduct thorough research, consider your financial situation,
and, if necessary, consult with a qualified financial advisor. Past
--
performance is not indicative of future results, and market
conditions can change rapidly. Trading decisions should be made
--
based on careful analysis and consideration of individual
circumstances. The user is solely responsible for any decisions made
--
and should be aware of the inherent risks associated with trading in
financial markets.

UPDATE: Elliot Wave 5-WXY, Sell OportunityChart Patterns:
- Elliot Wave 5 (Motive) - WXY( Correction) Combination
- WXY is a combination 3-3-5 (Triangle)
- Head & Shoulders Chart Pattern
Entry Point: 0.95963
Take Profit: 0.95958
Stop Loss: 0.97680

Head & Shoulders Sell Opportunity Chart Patterns:
- Elliot Wave 5 (Motive) - WXY( Correction) Combination
- WXY is a combination of an ABC (flat) - ABCDE (Triangle)
- Head & Shoulders Chart Pattern
Entry Point: 0.97098
Take Profit: 0.95958
Stop Loss: 0.97536


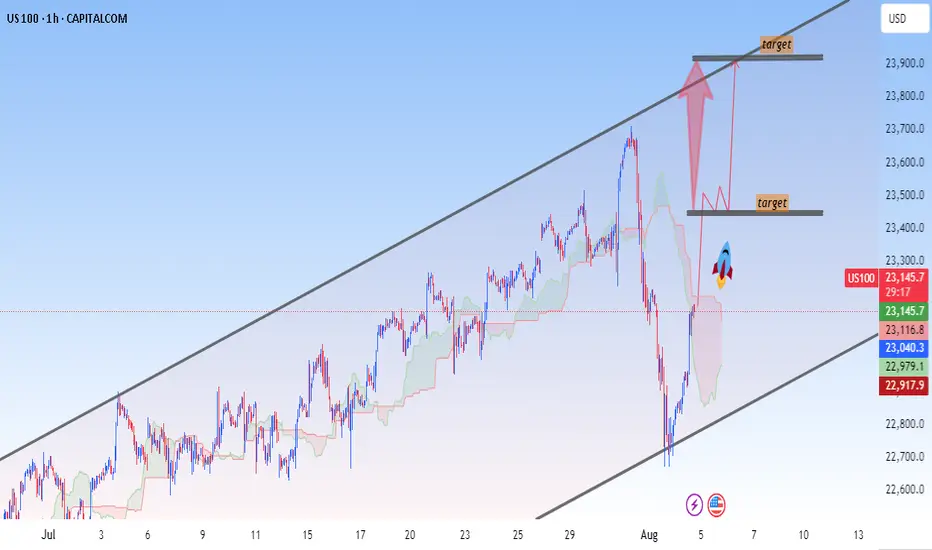
US100 Bullish Continuation Within Ascending ChannelChart Patterns:
Price is currently rebounding from the lower boundary of a rising channel.
Strong bullish candle appears after a sharp drop — potential reversal.
Two targets are marked with red arrows:
1. First (Short-term) Target: Around 23,500–23,550
2. Second (Extended) Target: Around 23,800–23,850
---
🎯 Targets:
🎯 Target Level Price Zone (approximate) Type
Target 1 23,500 – 23,550 Short-term
Target 2 23,800 – 23,850 Medium-term
---
🧭 Trading View:
The price has bounced from around 22,740 (support).
A breakout and retest near 23,300 would likely confirm continuation to your marked targets.
Keep an eye on Ichimoku cloud breakout for confirmation
NAS is fallingChart Patterns: On weekly timeframe, NAS reaches the D-point projection of ABCD pattern
Divergence: There is a very strong RSI Bearish Divergence on 4hr timeframe

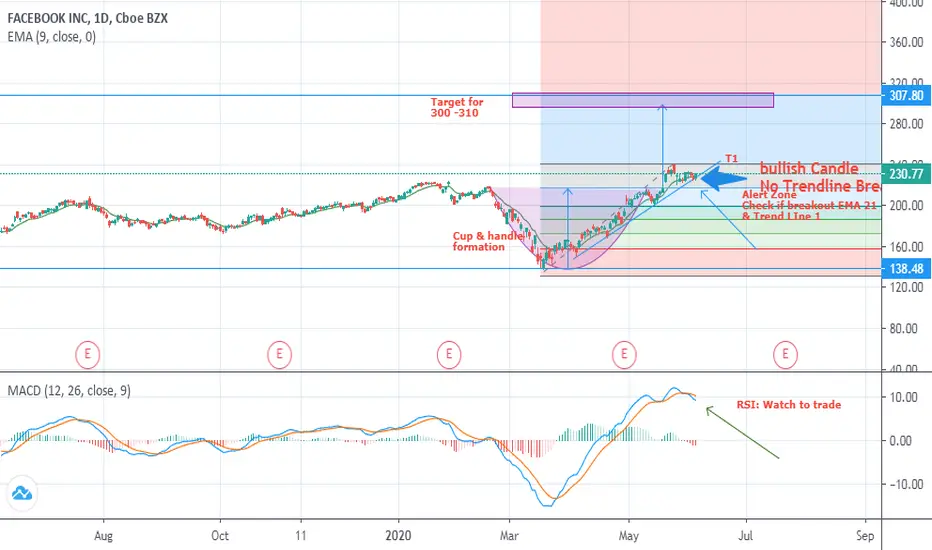
Analysis on FB Inc, US as 5 june 2020Chart Patterns: Cup & Handle Formation indicating next targe to $300 - 310
Candle: bullish Candle No Trendline Breakout as per 5 june candle
Alert Zone, Check if breakout EMA 21 & Trend LIne 1
RSI: Watch to trade
Trend ; Sideway, Watch to trade
Elliot Wave Corrective Wave, 70% Sell OpportunityChart Patterns: Standard Elliot 8 Wave Cycle, Corrective Phase
Entry price: 0.64128
Stop Loss Price: 0.64831
Take Profit Price: 0.62604
Estimated Duration: 2-5 Days
Probability to Meet Target: 70%

Break out Head & Shoulder goes Elliot Wave, 70% Long OpportunityChart Patterns: Break out "Head & Shoulder", Elliot Wave
Entry price: 0.97234
Stop Loss Price: 0.96597 (63 pips)
Take Profit Price 1: 0.97678
Take Profit Price 2: 0.98029
Take Profit Price 3: 0.99034 (180 pips)
Estimated Duration: 3-5 Days
Probability to Meet Target: 75%
