Flipping bias based on price actionFlipping Bias mid macro as price action is clearly respecting bullish scenario's.
Search in ideas for "FLIPPING"


Flipping closer than everBTC D. on its last breath. We didn't see a bounce in BTC D. like the cycle before, ether showing unusual strength in the bear market, while this should be the time that EtH D. should decline. What's gonna happen when the next real bull run starts? Ether will outperform Bitcoin even more! a flipping is nearby, im gonna bet it all on ether, only for this cycle tho. In the long run I still believe more in Bitcoin, but Ether's gonna blow up first. period.

Flipping A Hundred Dollar Account to A Thousand Dollar part 2 i am in to a challenge of flipping a Hundred Dollar account into a thousand dollar. the trade for analysis is the GBPUSD.

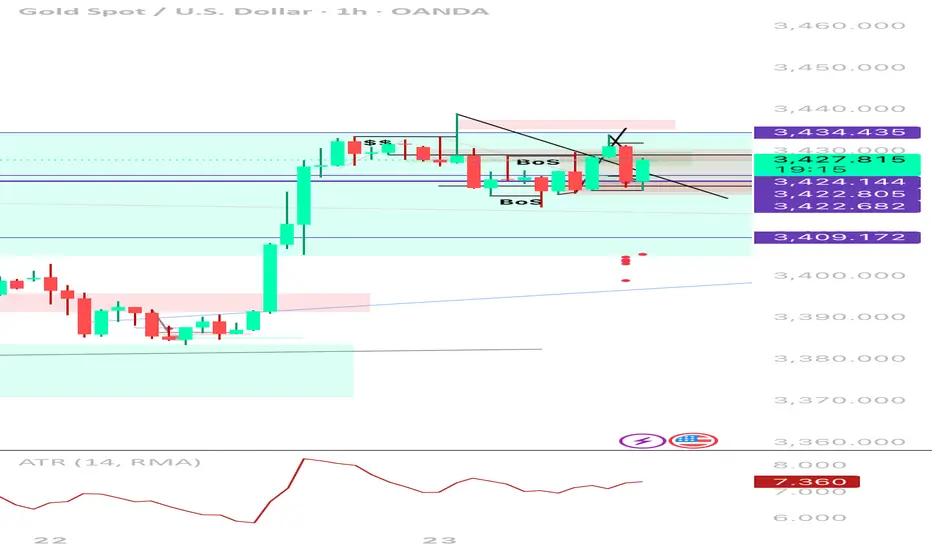
XAUUSD 1H | Sell TP Hit → Now Flipping Long After Liquidity SweeSmart Money Buy Setup | 1H Execution | Reversal from Demand Zone
Just hit full TP (396 pts) on a clean short from 3,434. Now flipping bias to long after price tapped into a key 4H OB and demand zone near 3,422. Price swept downside liquidity, mitigated the imbalance, and is now showing bullish intent.
⸻
🔄 Trade Narrative:
• ✅ Sell-side liquidity swept below previous HLs
• 🧱 Price tapped into 4H Order Block + FVG zone
• 💧 Internal liquidity vacuum filled (3,422–3,409)
• 🔁 Potential 1H BOS to the upside forming
• 🕯️ Bullish wick reaction from demand = early entry signal
• 📉 ATR low + building pressure = potential expansion incoming (likely NY)
Buy plan:
Entry Zone
3,422–3,424 (with confirmation on BOS)
Stop Loss
Below 3,409
TP1
3,434.435 (prior supply tap)
TP2
3,439.210 (range high)
TP3
3,455–3,460 (weekly extension target)
📌 Why I’m Flipping:
Price didn’t just reject randomly — it reacted exactly where smart money would’ve wanted to rebalance after the previous long impulse. This is the textbook scenario where you don’t marry a bias — just follow liquidity and structure.
🧠 Key Lessons:
• Don’t force continuation when the market is clearly absorbing
• Liquidity grabs often lead to strong reversals — watch BOS to confirm
• Same zone that gave you your TP? Can give you your next entry 💡
🔖 Tags:
#XAUUSD #SmartMoney #LiquiditySweep #OrderBlock #BreakOfStructure #BuySetup #PriceAction #1HChart #GoldTrading
Daily MACD flipping to red and what it portendsSee red circled MACD flipping. I like to watch when the MACD indicates it's about to transition from green to red or from red to green, at different time scales to see what I can learn.
I see that after the price hits an upper trend line as it did the last couple of days, as the daily MACD begins to flip to red, and especially if it's at the start of the week, then this to me is an indicator that the week will be bearish.
We see currently that the body of the current daily candle is lower now than the lowest point of the body of Friday's candle. This to me means: whatever happened on the weekend is about to be reversed. If the price went up on the weekend, then this week the price is going down.
During the day, I will look at 5m, 1h, and 4h candles and MACD to support the daily. Looks bearish folks, as clearly there is a convergence of sentiment at multiple time scales.
I saw earlier today, a tradingview analysis where the guy showed the price enter the falling wedge and then he drew some arrows pointing up and concluded it's going up. What the. You need to show MANY MANY different convergences and divergences of many patterns before making such a bold statement. Then at the time he had 5 people liking his idea. YOU CAN'T LIKE SOMETHING BECAUSE SOMEONE IS SAYING WHAT YOU WANT TO HEAR!!!! This is called an echo chamber - you are just hearing your own voice. You like analysis if it teaches you something, especially if it says the opposite of what you want to hear.
Always use analysis to prove yourself wrong, not to affirm that you're right.
I also love looking at hourly candles, and see what they have to say. Look at all the strong red hourly candles today (and volume) and you tell me whether you think this is a bullish start of the week? More importantly, is it impulsive or corrective? Compare with Saturday and Sunday hourly candles: a hodge-podge of red and green candles going back and forth - to me this is very typical of a corrective wave. So if the corrective wave is going up, and today the impulsive wave is going down - then have we finished Wave 4 correction or not? Answer: No. We are, as far as I can tell on subwave C of Wave 4 going down. Especially since we broke the H+S neckline (white line) 2 weeks ago.
So I have been trying to prove myself wrong again and again, but I can't so far. The price and volume keep affirming my analysis. H+S neckline broken (85% reliable), impulsive downward waves. Elliott wave mappings. Long-term trend lines. Nothing indicates we have finished Wave 4.

Shrimp Trying a Dolphin Move #FlippingSatoshisHey Guy, it's been a long time.
Another Colorchart with a visual on a low probability idea that could pay out if target of 15,000 is reach.
Hope you are enjoying the Fibonacci sequence highlighted.
In case you would like to support, you can join us right there... primexbt.com
#JustForMyTwitterPost #TheColorChartist #NoFinancialAdvice #ShrimpTrader #DolphinMove #FlippingSatoshis

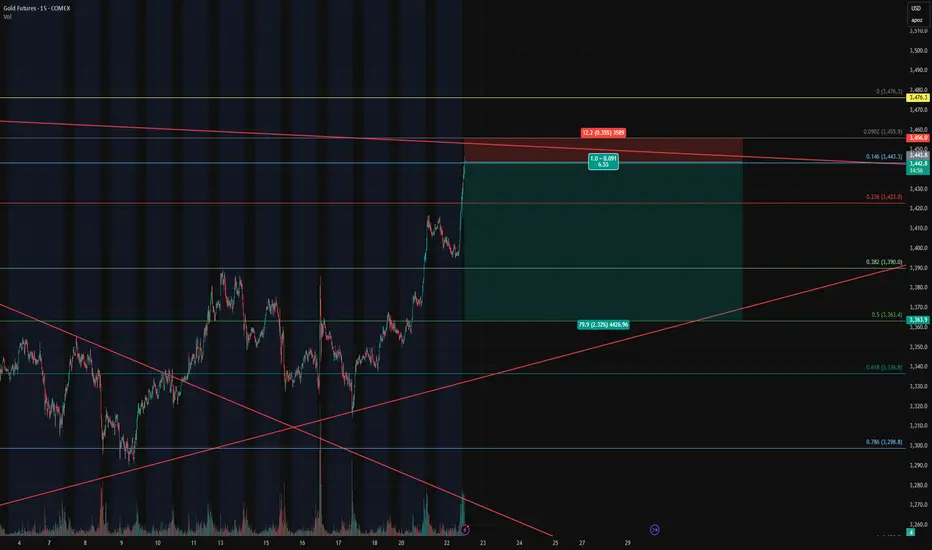
Gold Futures – Closing Longs and Flipping Short at Key Fib🔴 Gold Futures – Closing Longs and Flipping Short at Key Fib Confluence
Instrument : Gold Futures – COMEX ( COMEX:GC1! )
Timeframe : 15-Minute
New Position : Short
Entry Zone : ~3442
Target : ~3362
Stop Loss : ~3458
Risk/Reward : Approx. 6.5+
Setup Type : Reversal from Overextension / Fib Resistance
💡 Trade Recap & Strategy Shift
We’ve officially closed both our recent long entry and our larger swing long position, locking in substantial profit on this move off the 0.618 retracement.
Now, we’re flipping short based on the following:
Price reached the 0.146 Fib extension from the previous retracement leg, a level often overlooked but powerful when confluence lines up.
Trendline resistance from the upper channel has been tagged.
Momentum is showing early signs of stalling after a strong vertical push — textbook overextension.
The rally into this level lacked divergence or structural buildup, increasing the chance of a snapback.
🛠️ Short Setup Details
Entry: 3442 (after signs of exhaustion near Fib confluence)
Target: 3362 (prior structure + 0.382 retracement)
Stop Loss: 3458 (just above high / resistance zone)
Risk/Reward: 6.5:1 — excellent profile for a countertrend play.
📌 Watch For
A break below 3390 will be key confirmation of momentum shifting back down.
Failure to hold 3442 on a retest will invalidate the short and re-open the door for a squeeze higher to 3476/3480.
With trend exhaustion in sight and high confluence resistance overhead, we’re taking the opportunity to pivot short — fully aware of the volatility this region can bring.
SEIUSDT | Long | Flipping Resistance into Support | (April 2025)SEIUSDT | Long | Flipping Resistance into Support | (April 23, 2025)
1️⃣ Short Insight Summary:
SEIUSDT is looking strong on higher timeframes, showing signs of a clean retest. If this level holds as support, we could be gearing up for a solid move higher.
2️⃣ Trade Parameters:
Bias: Long
Entry Zone: Around $0.17 to $0.22 (confirmation of support flip)
Stop Loss: Below the recent swing low (approx. $0.18)
TP1: $0.28
TP2: $0.42
Partial Exits: Around $0.24 for a more conservative exit
✅ Risk-Reward Ratio: Approx. 1:2 to 1:2.5 depending on entry
3️⃣ Key Notes:
On the 4H chart, price structure shows SEIUSDT flipping a previous resistance into support — a classic bullish signal.
📉 30-min timeframe: Some money outflow hints at a short-term pullback or correction.
📈 4H and Daily chart: Money flow is coming in strong, backing the idea of continuation to the upside.
This setup fits well for a swing trade, with solid confluence across multiple timeframes. A hold above $0.22 increases confidence.
4️⃣ Optional Follow-up Note:
I’ll keep an eye on this and share any updates if the trade starts playing out.
Please LIKE 👍, FOLLOW ✅, SHARE 🙌 and COMMENT ✍ if you enjoy this idea! Also share your ideas and charts in the comments section below! This is best way to keep it relevant, support us, keep the content here free and allow the idea to reach as many people as possible.
Disclaimer: This is not financial advice. Always conduct your own research. This content may include enhancements made using AI.

TLT Flipping ResistanceIn my last post I discussed TLT as a great trade based on a technical basis and also confluent the macro-economic picture. With Trump as the new elect president, it is interesting that the narrative of a flare-up in inflation has not skyed yields and TLT recovers from a nice drop to 90$.
Here I am showing the last 2 times where TLT bottomed and then rallied. Each period of time took about 60 days give or take a few to thrust up through resistance. I believe we are experiencing a similar bottoming process now. There is a good chance that we receive some more opportunities to accumulate shares and leaps near 90$ again.
Flipping Resistance: As you can see, I have some trendlines drawn that seem to be boxing price in and out of certain areas. I believe we will see a flipping of this diagonal down resistance line and TLT move to the upside to test some horizontal resistance in the 100-105$ area.
Quotes from the great theologian Martin Luther:
"Every man must do two things alone; he must do his own believing and his own dying."
"All who call on God in true faith, earnestly from the heart, will certainly be heard, and will receive what they have asked and desired"
"Is it not a thing most abominable, that God who feeds so many mouths, should be held in such low esteem by me, that I will not trust him to feed me? Yea, that a guilder, thirty-eight cents, should be valued more highly than God, who pours out his treasures everywhere in rich profusion. For the world is full of God and his works. He is everywhere present with his gifts, and yet we will not trust in him, nor accept his visitation."
Hebrews 11:1
Now faith is confidence in what we hope for and assurance about what we do not see .

$CMT Flipping resistances at the 6h chart with great volume....$CMT Flipping resistances at the 6h chart with great volume....
Currently flipping 610 sats resistance into support and looking for new leg up into the 700sats...
UCTS Buy signal on the 6hs signaling the trend up (30% from buy entry)
Entry with tight SL below support.
#CMT

Kraft Heinz Signs Point to Bearish Trend Flipping BullishHi,
So this is a 3 Day analysis on Kraft Heinz.
Notice our Downtrending Bearish Channel that we've been bound to since September 2024.
Current Candle is in a clear breakout above the Upper border of Channel.
It still not set in stone exactly where we go from here and chances of fakeouts exist early into moves. Look for the next couple candle prints for more clues.
We are also currently above the 21 EMA, looking at past data, it has indicated further upside in many cases
With that the most attention grabbing feature in my opinion is the following:
Potential for a Bullish Divergence to play out. This sign where Price action prints lower lows but Indicators print HIgher lows is a Bullish Reversal sign, where if played out can bring in Bullish Momentum, flipping bearishness to Bullishness.
With that we have Momentum Indicators Signaling Bullishness
Both MACD and STOCH RSI are flashing BUllish Crosses. Which supports Bullish Momentum coming in. Looking at previous data everytime we've crossed Bullish, we've had Price move Up
Overlapping also seen with 1 Week timeframe.
Signs overlap between 3 Day timeframe and 1 Week timeframe. With 1 Week starting to show some life & Bullishness with crosses if we continue this direction till end of day today.
With all these Higher timeframe findings, it merits attention on Kraft Heinz. I will continue to observe.
Expect more updates.

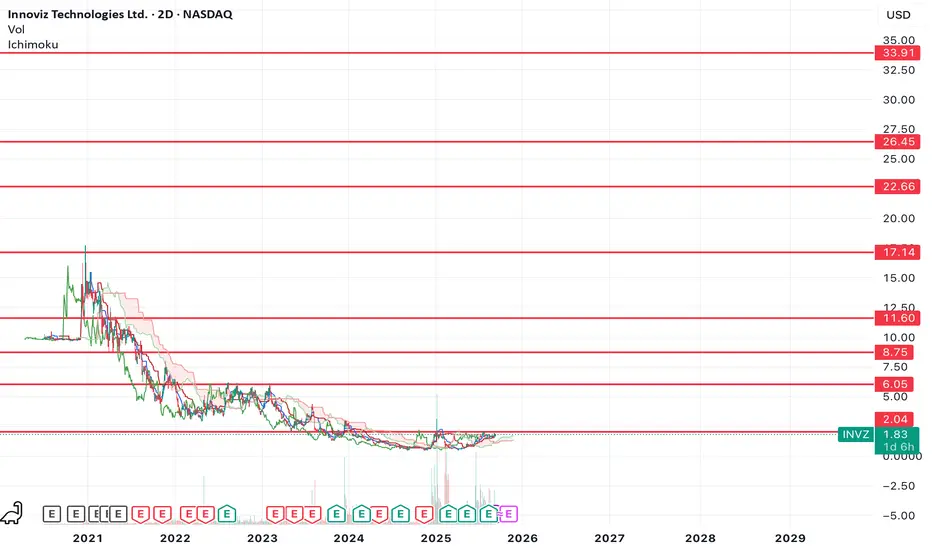
$INVZ - flipping $2.04, will bring a 10X tradeI've been watching Innoviz Technologies Ltd. for the better part of a year and it's starting to look good here.
Flipping $2.04 as support will confirm the start of a larger move that can take this 10x+ over the coming years.
I've marked off resistances on the path up.
Let's see how it plays out.
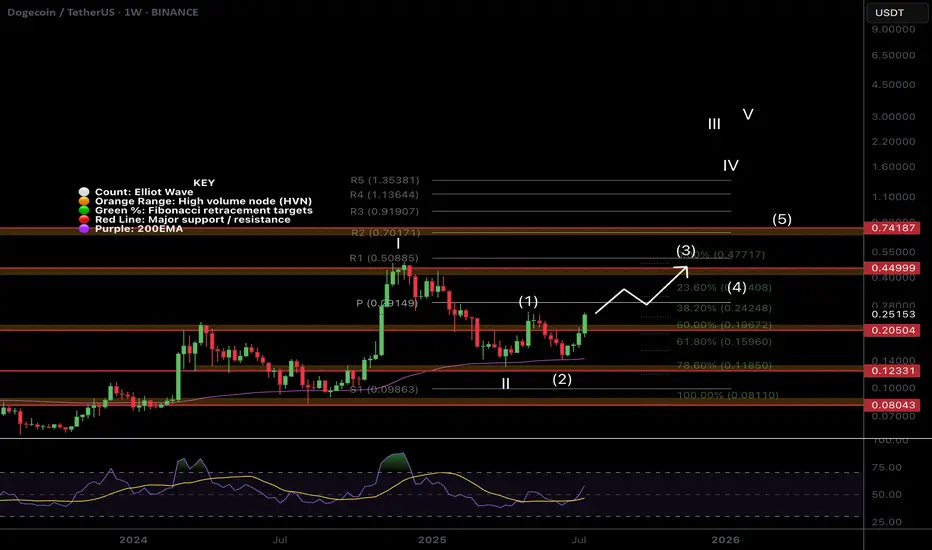
$DOGE Flipping to Bullish Structure!CRYPTOCAP:DOGE is coming to life after a second test of the weekly 200EMA as support and about to make a higher high, cementing in that higher low and flipping the macro structure bullish!
If the count is correct wave 3 of (III) should be powerful! The weekly pivot should put up a challenge as the first resistance before the High Volume Node at $0.45
Safe Trading
FARTCOIN – Flipping Long at Key LevelTaking the risk here—already played the short, now flipping to the long side.
Not expecting a new high, but this looks like a good spot for a bounce.
Price is sitting right at a mid-level and holding above the yearly open after a clean flip.
Treating this as a demand zone until it’s broken—if that happens, I’ll flip bearish and wait for a new signal. $fartcoin MEXC:FARTCOINUSDT

$QQQ Poised for Lift-Off: Flipping Resistance, Eyeing $470-$475!🚀 NASDAQ:QQQ Poised for Lift-Off: Flipping Resistance, Eyeing $470-$475! 🚀
As mentioned in my recent post, we’ve successfully flipped the $443.14 resistance into support—a key technical shift!
🔹 Momentum Building:
- Wr% Indicator: Making higher lows and advancing steadily towards the Red Barrier.
- Volume Gap: Still in play and ready to be filled.
With a higher low now established, I believe we’re set up for a potential move to $470-$475 next week.
📈 Let’s see how this plays out—exciting times ahead!
💡 Have an amazing weekend, friends!
Not financial advice

$WLD: Flipping the 1W LevelMIL:WLD appears to be flipping the 1W support zone that once fueled a parabolic run last year. A confirmed hold above this area can renew bullish momentum. Any sustained move below it would raise caution. This level acted as a springboard in the past, suggesting that similar strength might emerge if demand returns.
Potential Spot Entry: $2 – $1.85
The price corridor between $2 and $1.85 may serve as a favorable spot buy zone if MIL:WLD dips in January. Buyers who missed earlier rallies could find a second chance to enter. Watch for volume spikes and strong bounces in this region. Repeated defenses of the low end can signal that sellers are getting absorbed.
Eye on January Dips
A short-term retracement might align with broader market seasonality or temporary profit-taking. If price action slides into $2 – $1.85, maintaining a long bias requires observable support confirmations, such as wicks or bullish candles. This area can become invalid if the token closes decisively below $1.85.
Managing Risk and Expectations
A stop loss slightly under $1.85 controls downside if weakness surfaces. If the market struggles to stabilize, a deeper pullback becomes possible. Using partial entries and scaling in with caution can help mitigate volatility. Watch how MIL:WLD behaves around the weekly open and monthly pivot levels to refine timing.

$BTC Flipping Resistance to Support?!
Based on the provided image and the context from the web results, here's a layered analysis:
🔍 Analyzing the #BTCUSD Weekly Chart at All-Time Resistance!
We're currently witnessing Bitcoin testing an all-time resistance trendline, which is a significant milestone in its price history. Here's a detailed look:
1️⃣ Initial Growth: From late 2017 to early 2019, Bitcoin saw a significant rise, peaking at around $20,000 before correcting.
2️⃣ Bear Market: Post-2019, Bitcoin endured a prolonged bear market, hitting lows around $3,000.
3️⃣ Recovery Phase: The recovery began in 2020, with Bitcoin breaking through previous resistance levels.
4️⃣ Bull Run: The 2021 bull run pushed Bitcoin to new heights, surpassing $60,000.
5️⃣ Current Trends: Bitcoin has now reached an all-time resistance trendline, and according to Elliott Wave Theory, we still have the second half of the 3rd wave to complete. This suggests potential for further bullish movement. Possibly flipping the trendline from resistance to support.
The chart also features:
🟣 Ascending trend lines showing the overall bullish trend.
🔴 Purple lines indicating potential resistance points.
🟢 Green lines highlighting support levels.
Given Bitcoin's position at this critical resistance trendline, the question arises: Will this now flip resistance to support and begin the new age of Bitcoin?
According to Elliott Wave Theory, if Bitcoin successfully breaks and sustains above this resistance, it could indeed flip it into support, signaling the start of a new bullish phase. This would align with the completion of the 3rd wave, which is often the strongest in the sequence, indicating a powerful continuation of the trend.
However, this is contingent on several factors including market sentiment, regulatory news, and broader economic conditions. While the technical indicators are promising, the real-world impact of these factors cannot be underestimated.
What do you think about Bitcoin's potential to break this resistance and enter a new era? Share your thoughts below! 🚀💹
Please note that this analysis is based on the provided chart and general knowledge from related web results. For specific predictions, always consider multiple sources and do your own research.

ADA flipping resistance to support entry to 1.06ADA flipping resistance trendline to support entry to 1.06. Classic resistance/support flip entry here @ $1 to test the 1.06 resistance again. A break of that would be quite bullish.

LTC Flipping Resistance to Support on H4 ChartLItecoin, the original altcoin, is flipping resistance to support on the H4 chart. Currently, the price is testing an area for support. If the price bounces, we may get another impulse. RSI is 62 at time of publishing. target would be the 1.618 of the previous high swing low aroun 109 dollars.
Not financial advice. Do your own DD.
Thanks for viewing the idea.

MANA/USDT is flipping above the SuperGuppy dynamic resistanc💰 #MANA/USDT is flipping above the SuperGuppy dynamic resistance👀
This time we will make it back above the key zone and pump✈️
✔️1 Target - 1.5$
✔️2 Target - 2.1$
✔️3 Target - 3.85$

I don't believe the bullishness. Flipping bear again.Things are too overhyped.
I'm Flipping bear again.
Sub 50k...43k is my target.

Signs That US 30 Heading Down & Flipping from Bullish to Bearish
Signs That US 30 Heading Down & Flipping from Bullish to Bearish Market Bias
Timeframe: Daily
Market Bias: Bullish Market Bias
1. Price action congested to form a Support & Resistance Zone. A Shooting Star created a Major Pivot High of 38955 that acts as a form of a Resistance Zone. Opposite to that is a Major Pivot Low at 37120 acting as a Support Zone.
2. A very wide Inside Day (of 539 points) showed up to create a pause that can lead to a pause before continuation or reversal of the trend. Price action can move between the high and low of the Inside Day until one of the ends is broken.
3. A bearish candle rejected the high of the Inside Day as a sign that price action will break the low of the Inside Day for a long move downwards.
4. Another sign of a bearish move is that the bearish candle broke through the midline of the long, bullish candle (that serves as Support), so support was broken for a down move by price action.
5. If price action breaks through the Inside Day pattern's low at 38045; the bullish trendline (in green dotted line); and a Support & Resistance Zone, market bias will switch from Bullish to Bearish Market Bias.
