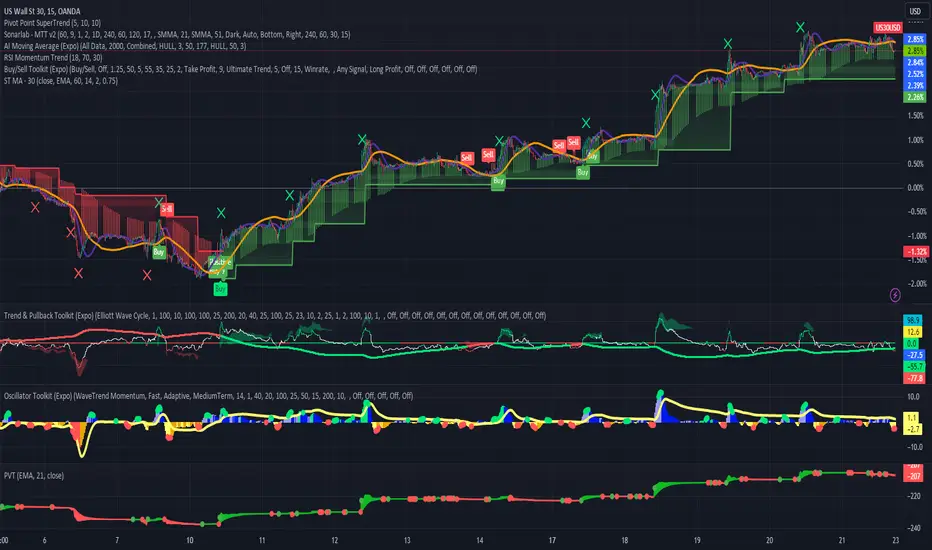
Indicators Galore!!!Super easy to understand. Follow curser and copy the indicators in your chart.
Good luck
Search in ideas for "INDICATORS"

Indicators that Warn of a Top or Bottom Before It HappensHybrid Leading Indicators use all 3 data sets from each transaction that occurs in the stock market. Today this lesson talks about Chaikin Oscillator and Chaikin MFI. Both are used on the same chart as the volume oscillator reveals the volume and price correlation to what the Dark Pool Buy Side institutions are buying or selling for long term holds. The oscillator also shows pro trader activity and indicates with a spike to the top or bottom of its chart a probable reversal of the trend the next day. When the Oscillator spikes to the top, then a profit taking day by pros or a run down is likely the next day.
When the oscillator hits a V shape at the bottom of the chart, the stock price is likely to move up the next day, warning those selling short to exit quickly. The oscillator also shows topping price and volume changes before the Flat Top forms. It also shows Bottoming development before the recent rebound in $NASDAQ:PYPL.
Money Flowing into or out of a stock is also a critical analysis for swing traders as it confirm whether you should continue swing trading to the upside OR if you should switch quickly to selling short. MFI in this chart is harmonious with the oscillator, both confirming a strong indication of the direction the stock will take over the next few days.
A bottoming formation starts well ahead of the actual final low. This is important to recognize early when selling short, to avoid a huge whipsaw day that can cause huge sell short losses.
When you can read the chart as easily as you read a book, your Spatial Pattern Recognition Skills are finely tuned and you can be proud to be a member of the semi-professional retail swing traders. Let that be your goal, along with consistent profits with minimal losses.
Raise your expectations.
Trade Wisely,
Martha Stokes CMT

Indicators are once again removed now???What is going on? Why do these indicators keep showing up and then disappearing on my account?
brschultzSP500

Indicators i use in my strategyi use 9 indicators in my strategy they are all non lagging and they do not repaint.
Indicators- Day TradeCombination of Gaps, Auto Fib, Linear Regression and Higher Highs, Higher Lows Technical Indicators

Indicators Point to Potential Bullish MomentumPolkadot (DOT) is currently trading at $6.190, with a slight increase of 0.67% over the past 24 hours. Not bad, not bad at all. But what does this tell us about the future of DOT's price?
Well, let's start with the Fibonacci retracement levels. The 0.5 Fibonacci retracement level is currently sitting at $5.922, and it has been acting as a strong support level recently. Meanwhile, the 0 Fibonacci retracement level is at $6.698, and it could potentially act as a resistance level.
When we take a look at the Bollinger bands, we can see that the upper band is at $6.528, the middle band is at $6.195, and the lower band is at $5.861. So, it seems like the price is pretty much hovering around the middle band, which could indicate a neutral stance.
But wait, there's more! The RSI is currently at 49, which is a sign of neutrality as well. However, the Stochastic Oscillators are at 54, which could indicate a potential bullish momentum building up.
The MACD is currently at 0.031, which is another sign of a potential bullish movement. And let's not forget about the EMA 50, which is currently at $6.201 and could act as a potential support level.
Now, let's talk about the volume. The Volume Oscillator is currently at -19.66%, which means that the volume has decreased, indicating a potential lack of interest from buyers or sellers.
So, what does all of this mean? Well, it seems like the price of Polkadot is currently in a bit of a neutral position. However, with the Stochastic Oscillators and MACD suggesting a potential bullish momentum building up, we could see a price increase in the future.
If the price manages to break above the 0 Fibonacci retracement level at $6.698, we could potentially see a bullish movement toward the next Fibonacci level at $7.691. On the other hand, if the price breaks below the 0.5 Fibonacci retracement level at $5.922, we could potentially see a bearish movement toward the next Fibonacci level at $5.145.
So, there you have it. While the current price of Polkadot may be neutral, there are several indicators that suggest a potential bullish movement could be on the horizon. Only time will tell, so let's sit back and see what happens.

BTC several indicators for short term longindicators for short term long:
-bullish butterfly
-faling wedge (orang line)
- head and shoulders (yellow)
We'll see in the next few hours
Disclaimer: This is not financial, investment, trade or other advice. This is my personal opinion which can very easily be wrong.
You trade at your own risk.


(short sell)indicators are pretty useless right now indicators are pretty useless right now, read price action and take your trades I'll take a full sell if it breaks 17.79.74

Indicators Trade - Short UsdJpyFollow indicators only.
Take profit at 50%, scale out the remaining 50%
4 reds = sell
4 green = buy

Indicators Trade - Short EurGbpFollow indicators only.
Take profit at 50%, scale out the remaining 50%
4 reds = sell
4 green = buy

Indicators Trade - Long UsdJpyFollow indicators only.
Take profit at 50%, scale out the remaining 50%
4 reds = sell
4 green = buy

Indicators looking positiveCould this be the support and the opportunity to break the downfall? Otherwise it's down to 17. Indicators on the daily looking opportunistic. Will wait and see.
In any case, lots of opportunity long-term for this company.
Not advice... Share your thoughts!

Indicators alarm on Ripple. Hello trenders,
Fast and short Ripple ring the bell on all indicators to make the move.
1st Tp 1 Usd then hopefully bull run.
M.M.M Make Motherfuc.in Money
Be wise: don´t work for the money, make your money work for you.


Indicators in overbought zone. Possible short.Historically after indicators reaches highlighted zones correction begin, but in case of suez canal and global demand - continuation is also possible.
On weekly chart RSI is also overbought.
Keep watching.

Indicators for UVXYThis is the UVXY at the hourly. I think I found indicators that help predict a VIX bull day.
1) The purple lines on the chart are the Bollinger Bands set at the daily scale.
2) Middle indicator is the Divergence Indicator. It's the RSI, but helps identify divergences with RSI.
3) Bottom indicator is the MACD Divergence Indicator.
Essentially, if the UVXY is or near oversold and has a bullish divergence (RSI or MACD), then a bull run happens shortly after. Whenever the UVXY touches/breaks the lower daily Bollinger Band, a bull run won't be that far away.
If this can be mastered with identifying wedge patterns, then you can make serious profits from volatility trading.

Nathan's Ultimate IndicatorsIndicators that try to show when the market is going up or down (no future data used)

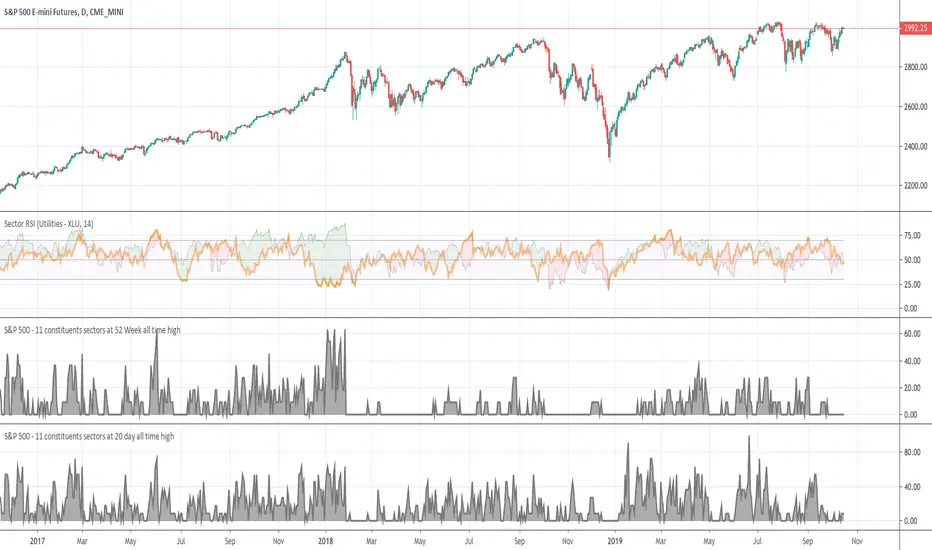
Indicators RSI SPX comparison by sector and SPX sectors at highsRSI SPX comparison by sector - choose the sector you want by clicking on the wheelchain icon in " Sector RSI " and also the indicators for finding the sectors how helped the SPX to be another leg higher ... note that this data in only valid in the current economic cycle 2009 to present day. Before 2009 the S&P didnt have so many sectors (current 11 sectors), so there are some issues regarding the analysis of this data because of the concept survivorship bias - this data doesnt handle that well. More info about the sectors: www.tradingview.com and also www.investopedia.com
SPY Short - Indicators/Patters/VolumeIndicators showing divergence/Chart pattern showing an even larger wedge than in 2018/Decrease in volume
I think we will see a significant drop in the very near future.

Indicators/Market OverviewA quick introduction, to the indicators/market overview. Mostly i will make videos about the Momentum strategy in crypto once alt season starts. My videos will be short and mostly about the trades i am actually taking.
I might make a quick Forex video for possible trade set ups with Momentum strategy and Auto-trendline strategy.
Sorry if my voice is too low on the video,i was super tired when recording the video. =)

Indicators aiming down. Time to retest 7500 ?Hello everyone
This is update for chart bellow
I think retest of 7500 USD line is comming and if bulls can´t hold it then further down to possible 6K lows
** This is not a financial advice so trade on your own risk and only capital which you can afford to loose **
