Search in ideas for "LTC@"


LTC Short term Short, Long term longI think LTC will meet mid 2-3 area by the end of June. Afterwards, there should be good entry opportunity

hey ltc is time to divorce ltc should divorce from btc or wont get independent ever and have a future

LTC/USDT Technical Analysis: Halving Analysis Points to Bullish LTC/USDT Technical Analysis: Halving Analysis Points to Bullish Trends
In this technical analysis of LTC/USDT, we will delve into the current price movements of Litecoin (LTC) and its potential for short-term and long-term gains. We will also discuss the upcoming halving event and its impact on LTC's price action. Please note that this article is for informational purposes only and should not be considered as financial advice. Conduct thorough research before making any investment decisions.
Key Takeaways:
LTC has experienced a strong bounce from its support level of $75 and is currently trading at $91, marking a 140% increase from the bottom.
The bullish sentiment is reinforced by the anticipation of the upcoming halving event, which may drive LTC towards a $140 target, representing a 70% increase from the support level.
LTC is currently facing resistance at the $98 level, but it is expected to break through soon and soar towards the $130-$140 range, which would be an ideal exit point for short-term investors.
After reaching the resistance zone, LTC could undergo a significant correction, potentially retesting the $50-$60 range. This dip presents an excellent opportunity for long-term investors aiming for substantial gains.
Looking ahead, LTC's long-term targets are projected at $300, $500, and $700, indicating its potential for significant growth during the next bull run.
Analysis:
LTC's recent performance suggests a bullish trend, supported by its strong rebound from the $75 support level. This positive momentum can be attributed to the forthcoming halving event, which is expected to enhance LTC's value proposition. With the price currently at $91, there is a possibility of a 70% surge towards the $140 target before the halving.
Nevertheless, LTC faces a resistance level at $98, but market sentiment suggests a breakthrough is imminent. Once this resistance is surpassed, LTC could embark on a bullish run, with the $130-$140 range serving as an optimal exit point for short-term investors.
However, it is important to note that after reaching the resistance zone, LTC may experience a significant downward correction. This anticipated dip could see LTC retesting the $50-$60 range, offering a favorable entry opportunity for long-term investors aiming for substantial gains during the next bull run.
Conclusion:
Based on technical analysis, LTC currently exhibits bullish tendencies, with the upcoming halving event serving as a catalyst for potential price increases. Short-term investors may consider exiting their positions in the $130-$140 range, while long-term investors can look to accumulate LTC during a potential dip around the $50-$60 range post-halving. With long-term targets projected at $300, $500, and $700, LTC presents an appealing investment opportunity during the anticipated bull run.
Disclaimer: This article does not constitute financial advice. Always conduct your own research and consult with a professional advisor before making investment decisions.
Follow us for more Quality Charts Analysis.
Thank you.

LTC Coils Within a Zone, Awaiting Breakout-LTC falls 30% this week
-Support at $250 has held LTC thus far
-LTC must break & hold $276 for try at 2021 high
LTC had a rough week falling nearly 30% from its high of $333. A recent mining center blackout in China left the cryptocurrency markets in the red the past few days. LTC was not immune to this market fall. Investors have been waiting a break of $333 as LTC has yet to reach its ATH although many other coins have.
Looking at the last few days of price action, it is evident LTC is stuck inside a zone. The bulls and bears have been fighting it out within the price zone of $250-$276. The chart has been ping ponging awaiting the next direction. Once LTC manages to break and hold one of these key marks, the trend should follow suit. At the time of writing, the 4 HR MA 100 is holding the price up.
LTC has been floating above a near 30 day long trend line. The price has bounced off this trend nearly 4 times. If the bulls lose control and this trend breaks, LTC risks a -12% fall to key support zone of $219. In the case that the bears lose steam, LTC must break above $276 and hold to experience a bullish price movement. At the moment it is too hard to pick a direction, the best thing to do is to await a break of either mark to stay unbiased.
While viewing the Stochastic RSI, we can see that the strength was rejected near the overbought dotted line. The strength must continue upwards & break into overbought to experience a price revival over the major resistance line. The regular RSI has been coiling within an ascending channel. This shows investors uncertainty of the impending move on the Litecoin chart. A break of either side of the channel will result in the according price movement.
LTC intraday levels
Spot rate: $260
Trend: Sideways
Volatility: Low
Support: $250
Resistance: $276

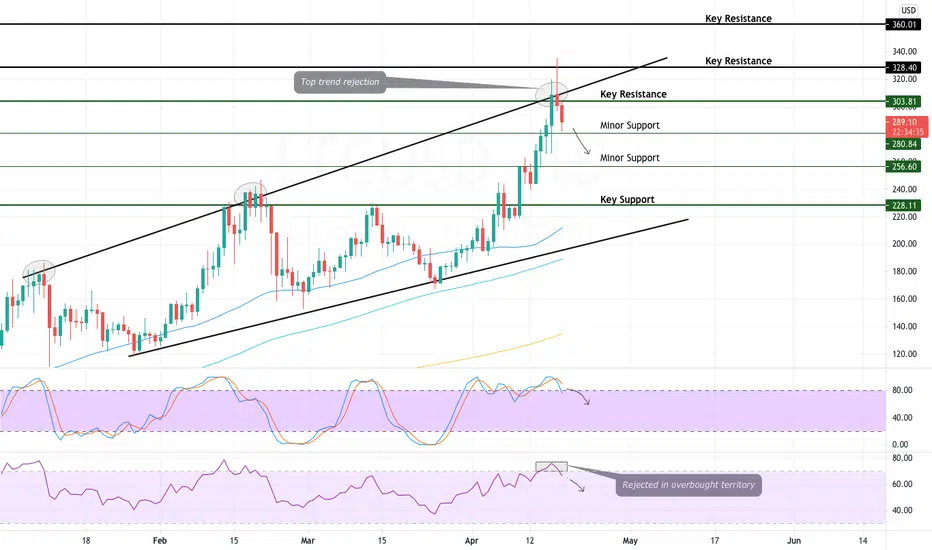
LTC Gets Rejected At 3 Month Trend Line-LTC hits 3 year high
-Price has rejected at 3 month trend line
-Key support & resistance to hold is $303
LTC holders have been waiting patiently for the currency to show strides this bull run and it has began to perform. LTC was up nearly 60% in the last two weeks, hitting a high of $333. This price surge lost steam as the price of LTC attempted to break its 3 month trend line.
On the daily chart, we can see LTC has been moving within a 90 day channel. The price has bounced off the bottom of the channel 3 times as well as the top of the channel. Each time LTC experiences a bounce on this channel, the price moves in the bouncing direction for at least a week. This could signal LTC may reach lows of $230-$250 in the near future.
The key resistance for LTC to break hold is $303. If the bulls manage to hold this level, LTC may have a shot at its all time high of $420. At the time of writing, the important level to watch is $280 as the bulls must manage to hold this level in attempt of continuing this bullish trend. If the bears continue control and the $280 support fails to hold, expect a drop to the $250 range.
Looking at the Stochastic RSI, we can conclude the strength was pushed to its limits the last 5 days. Two rejections at the top value in overbought conditions would usually indicate a reset to lower levels. The regular RSI also can confirm this view as the strength was rejected in overbought conditions. LTC is considered bearish until $303 is broken.
LTC intraday levels
Spot rate: $286
Trend: Bullish
Volatility: High
Support: $280
Resistance: $303
LTC eyes $300 as Bulls Test $250 Resistance-LTC reaches 3 year high
-Litecoin has biggest daily gain in 30 days
-$256 resistance break will set price free
Litecoin has been under the radar since the start of this bull cycle. The 10 year old cryptocurrency has been away from the buzz as DeFi has been the talk of the market. That hasn’t stopped investors from buying, LTC is up 550% in the last year. Although that seems like much, compared to other alt coins, it is not too impressive. LTC breaking resistance at $250 will set the stage for a try at its ATH of $420.
After a slow and steady rise from its March 2020 low of $25, LTC is testing an important resistance zone around $250. If this area can become support, LTC will see $300+ for the first time in 3 years. The $300 resistance level is also met with the top trend line of an ascending channel that has been respected for nearly 3 months.
As a result of the W bottom formed on $165 support, litecoin has managed to gain over 50% in value recently breaking its 2021 high. The W bottom forming is a bullish reversal signal as over the last month, price has been held up by the bottom trend line of its ascending channel. This confirms buyers are still in the market and are looking to squeeze more gains out of the OG cryptocurrency.
If the $250 S/R zone fails to hold, expect the price of LTC to stabilize around its $228 support level. This wouldn’t be a bad thing if it can hold this support as this would be the setup of a retest of a previous resistance.
While looking at the Relative Strength Index, It is easy to spot that the RSI had a clear break of a 30 day trend line and tested it as support 2 days ago. This can set the rug for LTC’s 1 day RSI to reach overbought territory, which is where most of the gains can happen. Confirming this bullish view, the Stochastic RSI has been forming a bull flag over the value of 66 which is bullish indication. This bull flag has been forming for nearly 2 weeks which signals consolidation is happening before a potential explosive bull trend.
LTC intraday levels
Spot rate: $256
Trend: Bullish
Volatility: High
Support: $228
Resistance: $256

LTC LONG TERM FA- AMAZING GROWTH AHEAD 5000% to 11000% GROWTH!LTC was once well know=n as the SILVER to BTC Gold.
LTC is a REAL heavily used currency, fast with low costs, small number outstanding coins 85 million NOT 100 trillion as some of the meme coin , with a real and respected development team. LTC is not a meme coin. I have been using it for transactions for over a decade.
LTC is poised for insane growth ahead as it has multiple strong fundamental analysis signals on a 3M interval chart.
1. a double bottom. 2 base on base where the 2nd bottom is slightly greater than the first.
and 3. the most important, the entire chart is a flag pattern
These signal together almost guarantee a price 50x to 100x multiples of its current valuation.
I wouldn't START selling LTC until you see a 50 bagger and sell into the 100 bagger.
The charts and TA are never wrong.
This indicates there will be a MASS adoption of LTC somewher in the very near future.
Be grateful you are in a REAL heavily used currency, low outstanding coins, with a real and respected dev team. LTC is not a meme coin.

LTC Eyes $300 as Bulls Refuse to Back Down-LTC has revived nearly 35% off its last low of $207
-Litecoin must hold minor support of $265 to continue up-trending
-Price has been stuck in an ascending channel for over 6 months
Litecoin hasn’t had much attention throughout this bull market as new and improved projects seem to be taking the stage. The OG cryptocurrency has only squeezed out roughly 130% in gains since 2021 which is tiny compared to other major cryptocurrency gains. If LTC manages to hold the $300 mark, investors may be in for a ride to ATH.
Litecoin has respectfully followed an ascending channel ever since BTC broke over $10,000. The price has bounced off each trend as bulls nor bears have managed to break the price free. If LTC continues to hold the minor support level of $265, price should test major resistance zone of $300. This will be a very important marker as it lines up perfectly to the top trend of its channel. If the bulls can break these marks, LTC will be ready for a wild ride to ATH.
In the case that bears start to take control & the minor support cannot hold, expect prices to retreat to major support range of $207-$236. This area can be depended on to provide large support as its also met with the bottom trend of the channel. In addition, the MA 100 also is near the bottom trend. This moving average has held the price for over 6 months. If these levels break down, LTC will be is trouble.
While looking at the RSI, we can conclude the 60 level is proving to be resistance. If this level can break, the strength is in the clear for a ride to overbought levels (70+). The Stochastic RSI has already risen to overbought levels. If this strength can stay in this level, LTC will be in a great spot to test and potentially break $300.
LTC intraday levels
Spot rate: $272
Trend: Bullish
Volatility: High
Support: $265
Resistance: $300

LTC updateLTC has made me money many times and It will continue to do so. In 2017 LTC had far better return on investment than BTC and I believe we will see at least a 9x from this level ($120) in 2018-2019. There are plenty of other Altcoins that will do 10x or more, but have a higher Risk/Reward ratio. So it all depends on if you are looking for something you can invest in, or day/swing trade. LTC for me is a Swing trade/investment, so I will be Hodling it again this year.
On the daily chart LTC is a long way from the Ichi cloud - likely to move toward it- and the TK lines have diverged from each other after the bearish cross significantly - likely to move back together. LTC found solid support around $100 and has used this area as support and resistance several times now - Strong buying block in that area (blue box). RSI has broken the bearish trend and just crossed above 50 - watching to see if it can hold this bullish break or if it fails and turns back down.
It is easy to see what happened last time LTC hit the support level around $100 and bounced with the Ichi in a similar situation - Starting Feb 6th. One of the tenants of TA - History Repeats Itself. I am looking for something similar to happen again here.
The parallel channel was created after LTC bounced out of the order block / support area and I will be watching for that long term channel to hold. A break out of it would be a bearish change for me and I would until it bounced off support again before buying back in.
For a short term Swing trade I am looking at sell zones around $155 - downtrend resistance - and $172 - ichi cloud resistance. If price action can move into the cloud and hold inside the edge, I will be buying on a retrace for a target above the cloud.
This is not financial advice. I am not your financial adviser. All ideas are provided for educational purposes only.

LTC/USD: Decisions are approaching - Waiting on King BTC's moveLTC obviously took the lead over "The big 3", since then BTC has moved 60% without making much effect on LTC's price, it has been sitting sideways for the past few days to 1 either give it's next leg up to target the 10 month old trend line which will meet with resistance around $300.
Scenario 1 : It'll breakout upwards IF BTC can break out of $11.5-11.7k out of it's major Log downtrend line.
BTC has a scenario that if it fails it this breakout it can retrace back to $8k around the dates of March 8-10. Ironically LTC has a very possible scenario to form a bull flag instead of a pennant if it fails the breakout bringing it back to re-test the break out.
Also this scenario is supported by the rising wedge formation. Base formation price of the rising wedge = retrace of the rising wedge breakdown which = exactly to the price of the breakout for a retest.
Scenario 2 : BTC breaks out of it's major log downtrend line around 11.5-11.7 I do see BTC targeting these levels as it also formed a rising wedge broke down and retraced the price of the base of the wedge. It then formed a falling wedge (bullish) and broke out upwards which it "should" make it re-target the previous top from the risiing wedge breakdown = ~11,600 which again, ironically makes it meet with it's log downtrend resistance. IF it breaks that will most likely make LTC breakout upwards as well from $216 Resistance.
This will be one exciting weekend to follow. Practice risk management and trade what you see not what you feel.
Remember bullish patterns inside bearish patterns don't win.
IF the do fail a breakout, charting the RSI on both LTC and BTC do show that March 8-10 can be zone of reloading.
Don't trade off this chart. It's only possible scenarios.
Here is my previous LTC analyses that I was updating on the daily.
Nothing has changed besides new trendline updates.

LTC - How fast can LTC grow? 166 to the MOON!!!???LTC has recovered very bullishly from this recent dip. I've mapped all the convergence points on the upcoming bull run. The more points and the larger the dip, the more important that point is as the new resistance to punch through. ALSO, there's a major linear trendline that hasn't been broken in months since 420.
LTC really has no real resistance as most of these dip points are of low volatility AND the bull run up to 420 was without breaking points MEANING, the next bull run for LTC only has to worry about one side of the mountain for convergence points, not 2, twice as much, both sides. This makes LTC unique in this way. Get ready for it's LTCBTC chart to change in ratio!!
I believe a 2x in the next month is very easy to imagine, similar to what ETH did a couple months ago going from 350 to 700. 600-840 LTC seems reasonable, settling in the 600-500 after a consolidation fib wedge. I'll line out charts when we have lines to draw off. LTC may follow BTC in its BEARish recovery at first so the market is still unsure. Transitions...

LTC Cup & Handle Into Support ZoneLTC had a great run the past couple days, coming up to $307 just before forming an ascending triangle. Many were hoping for a break upwards to continue the run to previous $360, (myself included). Although this didn't happen immediately we can see here that LTC is pulling back into a previous support zone with sharp tails which led to strong bounces in the past. Not to mention, Charlie Lee tweeted just one day ago: "For the next release of Litecoin reference client, we will reduce the relay fees from 0.001 LTC/kb ($0.30/kb) to 0.00001 LTC ($0.003/kb). We hope to have that out next week. Once people are using the new relay fees, we will reduce the actual min fee to 0.0001 LTC/kb ($0.03/kb)." This is an important catalyst for LTC growth and we haven't seen it's full effect play out yet. Once LTC falls below $260 demand will increase heavily, pushing price up to previous all time high. From there I believe that we will see a pullback, consolidation, and epic stretch to $500.

LTC/BTC finally ready for the bull market? I've been watching (and accumulating) ltc for almost a year now, I'll admit I was fooled by the false break out in April-May but I have used the last few months as an opportunity to pick up more at lower levels and improve my cost basis. The risk vs reward seems like a great play here. To me the upside potential is much greater than the downside unless you believe ltc is on the brink of existential collapse (possible but unlikely). As alway be safe, use appropriate stops, and consider all possibilities.
The chart is pretty self explanatory--the price is acting very similarly to what preceded the last bubble. Of course that in it of itself does not mean another bubble will come to fruition, but the timing and fundamentals also seem to corroborate:
Yuan devaluation (ltc market is dominated by the yuan pair unlike any other alt, an under appreciated fact)
*Hype dying down from other alts
Recent addition to GDAX
Roadmap/plans for new features added to the protocol (segwit, confidential transactions, possibly smart contracts)
New found appreciation for scarce, immutable, thermodynamically secured (POW based) blockchains
Also, in terms of the technical picture, LTC/CNY is very close to clearing both its 100 and 200 Day MA’s, where as btc is already well above them. If and when it does--the momentum should pick up. Interestingly enough, both LTC/CNY and BTC/CNY are each setting up for their 50's to crossover their 100's, but for LTC/CNY there's also a Golden Cross (with the 200 day MA) in the works.
*Eth has stolen the spotlight and liquidity from ltc over the last year, but now it would appear the hype has died down after all of the ongoing crises's (DAO collapse, Bailout, HF/ETC, ongoing DDOS attacks, now another dual hard fork on the way, blah blah). ETC had its big bubble, but has yet to reflate (has to do it's own HF as well). The privacy coin play got a huge bump with XMR and its adoption in a big dark market, but now that bubble has popped. Zcash still on the way, worth keeping an eye on, but still many questions remain about it. Haven’t followed Ripple much but I know it had a big bump in recent months that died down as well.

LTC Wakes Up — Bullish Adam & Eve Targets $150+LTC is gaining serious momentum, breaking through key resistance levels and printing a clean Adam & Eve bullish reversal pattern. The breakout signals a potential shift in the macro trend — and the chart is offering clear setups.
✅ Breakout Through $100 & Pattern Confirmation
LTC confirmed the Adam & Eve double bottom with a breakout above $100, a major psychological resistance.
The neckline retest around $105 acted as a Market Structure Shift (MSS) confirmation, with upside wicks signaling strong demand and a reversal.
$100–$105 Support Zone: Stacked Confluence
This zone offered a high-probability long setup due to multiple overlapping technical factors:
Yearly Open (via DriftLine - Pivot Open Zones ): $103.28
0.382 Fib Retracement: $104.67 (from $76.17 low to $122.29 high)
Anchored VWAP from the $76.17 low
POC of 1-Year Trading Range: ~$102
233 EMA & SMA (4H TF): Both moving averages aligned between $103–$100, acting as dynamic support
✍️ A clean, high-confluence demand zone between $100–$105 — ideal for long setups.
Upside Structure & Next Long Opportunity
➡️ Current Price: ~$127
A fresh long setup may present itself around $120 on a pullback
➡️ Pattern Target: $150
🌀 1.0 TBFE: $149.28
🌀 1.618 TBFE: $147.31
🔺 Key Swing High / Liquidity Pool (BSL): $147–$150 — an area to watch for possible rejection
🔴 Short Setup Consideration
➡️ Short zone: $147–$151
Only short on clear confirmation: SFPs, rejections, or bearish order flow
➡️ Downside target: $135 (1:2 R:R potential)
Macro Bullish Target: $198–$200
If LTC breaks and holds above $150, the next macro target becomes:
🌀 0.618 Fib Retracement (from $295.7 high to $40.3 low): $198.14
$200 Psychological Resistance: Major round number, likely to act as magnet and profit-taking zone
🛠 Indicators Used:
DriftLine — Pivot Open Zones
↳ For key levels like the Yearly Open, crucial in confluence stacking
📚 Educational Insight: Understanding the Adam & Eve Pattern
The Adam & Eve pattern is a classic bullish reversal formation that often marks the end of a downtrend or a major correction phase.
Adam forms first: a sharp, V-shaped low — often panic-driven or capitulation.
Eve follows: a rounded, more gradual bottom, showing accumulation and stabilisation.
Once price breaks above the neckline, the pattern is considered confirmed.
A retest of the neckline (like LTC at ~$105) is often the best entry point, especially when supported by confluence like Fib levels, VWAP, or key levels.
In LTC’s case, the breakout above $100 and successful retest at $100–$105 validates the pattern — with a measured move pointing toward $150, and a macro Fib target at $198.14 aligning with the $200 psychological level.
Summary:
With a confirmed breakout, strong technical confluence, and clearly defined targets, LTC is setting up for continuation. Watch $120 for long entries and monitor $150 for potential rejection.
_________________________________
💬 If you found this helpful, drop a like and comment!

LTC isn't done with its run yet.LTC is looking bullish right now and currently testing to break the symmetrical triangle. Target breakout price measuring if we breakout is around $260. If LTC fails to breakout, high $70s low $80s is in play. But will eventually rally back up when the bull market resumes. Unfortunately, LTC follows BTC and when BTC falls, LTC falls harder, when BTC pumps or holds, LTC pumps harder. I believe LTC is getting bullish but I am watchin BTC and seeing if it can break out. Or if its a bull trap. Either way. I believe the bull market is only halfway over so the real run hasn't started yet.

LTC/USDT possible inverse H&S Ltc/usdt
Possible inverse head and shoulder this pattern is bullish but not enough
I put analysis days ago about best buy area of LTC one of them after break of 52$
This pattern help and confirm past analysis
See here my previous idea about ltc :
We will buy ltc only if it break and closed above 52$ on 4h candel or daily candel
This trade is very low risk one because around 52$ is strong resistance multiple times rejected the price before ..once break I expect ltc will fly
And stop loss should be close again below 52$
If you search for low risk high reward trades this is one of them
Targets (take profit targets ) are shown in the chart

LTC/USD - Coinbase Daily Chart - not longing just yet LTC is a tricky one to predict. Consider that LTC has been leading the way earlier this year and not BTC. Although BTC gets the news, LTC was usually the first to move (pump) with BTC then eth/alts. LTC topped out June 22 '19 with BTC following June 26 '19.
While BTC is playing more of a traditional DOW theory thus far (and I use traditional in the loose sense here in the Crypto world) :
swinging up uptrend topped out --selling-------------------------------------> stabilizing
(Accumulation , Public Participation, Distribution , <-we are here -> Public Participation, Accumulation)
1 2 3 4 5
LTC seems to have taken a quicker ride up and down. That is why its hard to say if we are still in the early stages or latter stage of public selling (#3->4) . I would say short but if we are in the latter stages of selling... wouldn't it be worth it to wait till it we start accumulating again and go long?
I have two green lines that represent the uptrend LTC was on. The Black circles represent the head and shoulders pattern that was drawn and confirmed as they broke both uptrends. Not only that, we established a clear downtrend (red line) that has been tested twice and failed. Moving Average 20/50/200 are all above price along with the Ichi Cloud. Only thing I see as support are the support lines I drew around the 51.20 which held up for now.
Now normally (and most likely still do) I would say not to touch this because I usually want to see the price above a MA to feel safe however there is a clear channel that is happening (purple line). The falling wedge has at least 3 points where it bounced. Not only that but the RSI is in the undersold region. Perhaps for a scalp it would work but for a long hold I am skeptical.
Falling Wedge w/ undersold RSI and stabilizing MACD
vs
Price under all the Ichimoku indicators and below 20/55/200 MA as well as Bear market sentiment.
As you can tell I am not hype about longing LTC. Consider me interested if the following happens :
We fall to $39-42 region
We break my Solid Red line and retest it (must pass the retest obviously)
Until then, just let everyone else fight it out and sit back with CASH in your account.

LTC price or LTC´s joke?LTC price extended declines towards the $30.00 support level against the US Dollar. LTC/USD is likely to rebound in the short term towards the $35.00 or $38.00 levels. Yesterday, we saw a major downside move below the $35.00 level in LTC price against the US dollar. The LTC/USD pair moved down sharply and traded below the $33.00 and $32.00 levels. Looking at the chart, LTC price declined close to the $30.00 level after it broke the $35.30 support area. A swing low was formed at $30.30 and the price is currently consolidating losses.
The current price structure is short term positive above $30.00, but the price is trading well below the 100 hourly simple moving average. In the short term, there could be an upside correction above the $33.30 level.
The next major resistance is near the $35.30 level, which was a support earlier. Above this, the price could test the 50% Fib retracement level of the recent slide from the $43.05 high to $30.30 low at $36.67.
