ETH is dancing with the Most Important Golden Fib of its LifePlotted here is a single fib series, shown in different timeframes.
"Genesis Fib" refers to the Fibonacci series relevant since birth.
Every major turn has been defined by these Golden extensions.
This fib series helped call the top, as well as " Secondary Top " (click).
Used with local fibs, we derived a Price Roadmap long before retrace.
Last call was Relevance of $2933 to break downtrend, perfectly defined.
The Golden fibs are .618 multiples and thus of highest "Gravity".
Thus we are quite likely to "Orbit" this level for a few revolutions.
Eventually it will be "flung" from its orbit, up or down the question.
I will post updates as price action gives clues about next direction.
Use the "Make it Mine" under SHARING, to make your own copy of this.
If unable to save Multi-pane charts, here is a Single-pane version of this.
.
Search in ideas for "PLOT"

ETH heads up at Genesis Fib $2,933: key level to break downtrendPlotted here is a single fib series, shown in three different timeframes.
An asset's "Genesis" fib is like the "DNA" it was born with, and must follow.
Every level on this fib has been highly relevant and likely to cause reactions.
$ 2933 a "semi-major" (dark blue) ratio of the Genesis Fib series.
$ 2778 and 3123 are "minor" (light blue) ratios so not as strong.
$ 3431 is a "Major" (Golden) ratio, a .618 multiple so very strong.
This single fib series has called every major turn in ether's life.
It helped call the May 2021 Top and August Secondary Top (click) .
So now we are at a possible "lower high", which bulls must break.
.

Wedge Hedgeplotshape(OverBought, "Down", style=shape.triangledown, location=location.abovebar, size=size.tiny, color=red)

Plotting The Super Cycle.Since Covid novice investors have flooded to the markets and have been hooked on the high risk speculation game, These speculators look past quality companies with great balance sheets and a lot of free cash flow because they think short term and see limited growth and view them as overall boring. I think we're heading into a very large commodities boom cycle on the macro and companies that are producers will benefit largely off higher prices which will form another massive bubble to take advantage of. There will come a point soon from now imo where companies with poor fundamentals return to their real value (not much) and that $ will go to stronger fundamental business's rich with strong cash flows and long growth runways. In my mind there is no better play than mining stocks who are producers of Gold, Silver, Nickel, Copper, Steel, Potash and lithium, I expect the mining sector as whole to out perform index's for the next decade or so.


ETH heads up at $3913, a Genesis Level and possible "lower high"Plotted here is a single fib series, shown in three different timeframes.
An asset's "Genesis" fib is like the "DNA" it was born with, and must follow.
Every level on this fib has been highly relevant and likely to cause reactions.
.
My last target for ETH was also set by this fib and posted at that time:
.
If would like to make a copy of the Genesis Fib, here is a single frame version:

HSI & ESPLotted ES1! on the HSI1! chart.
I've noticed recently that China no longer impacts US futures.... looks like the Chinese quit trading US futures back in the last week of June.

BTC What Comes First?...Plotting some basic levels on BTC and using Fib Retracement to do it. Using lows from late November as the anchor, some interesting levels are apparent. First, the 50 fib has been a relatively clear pivot level on the chart where it was resistance at the end of 2020 as well as recently. Then you've got the 382 level to keep in mind. Now that BTC has broken above 50, the 382 would be the logical "next level" right? Well, hold your horses for a second because you've still got the 200DMA to watch....Look at the chart and you'll see that this has been resistance for the last few months and BTC tested it again this weekend. It was denied once again. So before anyone starts looking at the 382 level (which was an area of support during the big crypto breakout months), the 200dma could be the real level to watch for longs. We'll see what happens when the week gets started.
" The most prominent crypto penny stocks are the ones that mine cryptocurrency. These are few and far between, however, there are a select group of penny stocks to watch that engage in crypto mining. Next, we have the penny stocks that work with blockchain technology or are producing it. These could be tech penny stocks, software companies, or a combination of both.
Additionally, these companies could also be producing technology used in cryptocurrency mining. This includes machines used for mining Bitcoin, DogeCoin, Ethereum, and any others.
Lastly, we have the ancillary crypto penny stocks. This could be companies that have crypto holdings, ones that offer NFTs, or companies that are working to utilize blockchain technology in their practice. The level of involvement that a penny stock has in the cryptocurrency industry, should illustrate how large its correlation is to the frequent moves of crypto.
So the more involved a company is, the more likely it is to swing from crypto price swings. And, the less involved, the less likely it is to do so. In 2021, there is a whole list of penny stocks that work with cryptocurrency or blockchain-related tech. And knowing how and where to find them will be your greatest asset. Considering this, are these the best cryptocurrency penny stocks to buy now? "
Quote Source & Read More: Best Penny Stocks to Buy Now? 3 Cryptocurrency Companies To Watch

MATIC MACRO TREND LINEplotted MATIC macro trendline.
looking to enter back into this sometime at the end of May.

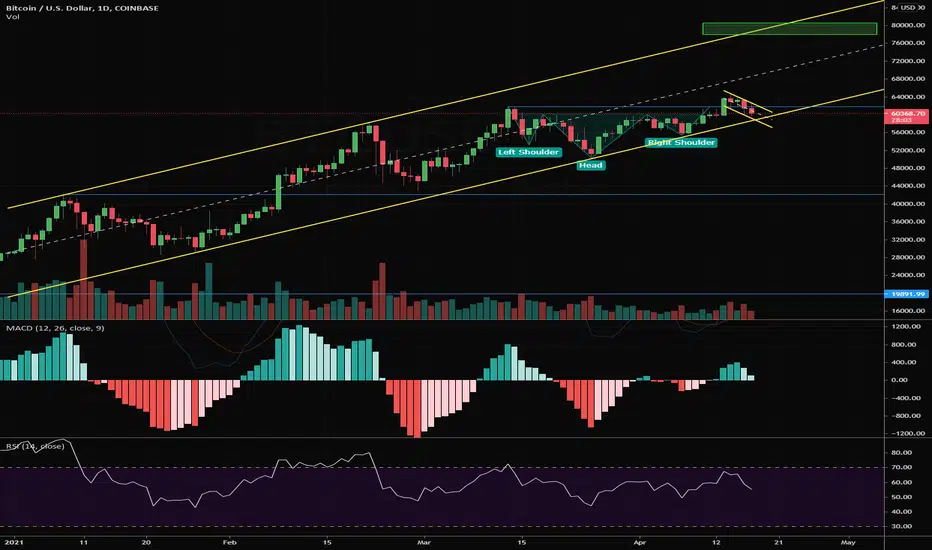
BTC Channel 80K Target if plays outPlotted this channel on BTC, looks good with possible targets into 80K range if plays out
XRP Major Fibonacci LevelsPlotted a Fibo and here are the key levels that we need to keep an eye on... 1st is the 2.24 area, next is the 2.77 area, and the 3.63 area is the Major Fibo level that XRP really needed to break.


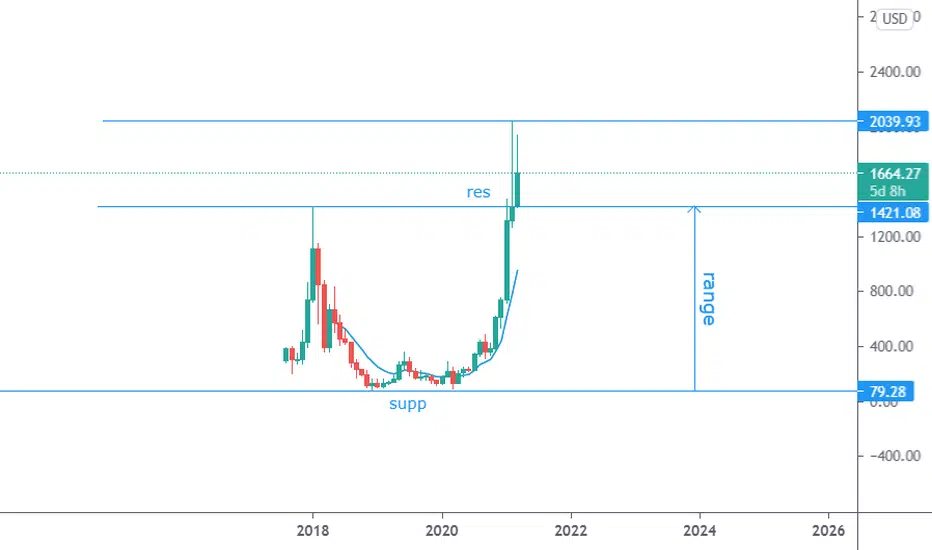
Finding stronger supportPlotted estimated support levels. Swing to 3.8-4 then to 6.6 then to 9.8-10.

Plotted retracement of last retracement + trend linesASI still shows potential to pull back but if we see a similar fate to last time we will bottom out around 40 and then pull back up to 70+

EOS/USD Break out towards resistancePlotted this triangle yesterday and we have recently had a break out. Expecting EOS to break through the upcoming resistance within a couple of days maximum - especially with lurking news of grayscale adding them to their fund and the growth of the entire market.


One Potential End Point for ESPlotted a potential finish to kiss the top descending trend line on ES. Could be down from there, not sure how much, but this ending to the day seems plausible based on the events that have transpired thus far.
=FIB

When RSI Trend Lines CrossPlotting RSI trend lines, we can see something is going to occur at end of the day today based on their crossing, and February 4th as well it is looking like.
Which direction? My guess is up today, but no guarantee. Only certainty at this point and for the upcoming weeks, I think, is choppiness.
I wouldn't go in either way yet until we break some trend lines and see some significant movement in either direction. Lot of retail cashing out, lots of big money holding it up still.
Trade safely.
=FIB

Buy $TSLAPlotting some wave theory on $TSLA. Looks to me like they are flagging currently (typical of a wave 4). Earnings report next week should contain lots of exciting things for the company. Keep the price consolidation on watch for any breakouts. Potential wave 5 price target on the chart.
This is not trade advice. Just my trade ideas. The levels on my chart are roughly drawn.


IDFC first bank trendlinePlotting idfc bank trend line to figure out support and resistance price...

gold price levels denominated in usd/gramsPlots the gold price (USD) for the quantities (grams) identified as support or resistance in the indicator settings. Measuring the price of Bitcoin relative to the value of gold is a way to keep track of its purchasing power. The resistances identified record the bitcoin/gold ratio at the time of creation and continues to track it in US dollars.
