Potential Harmonic Plot for RVN - New to HarmonicsYes, this is neutral, I'm plotting points that don't exist yet.
Neutral until point C is confirmed at the .886 RT
Pink trend lines show confluence for the 1.618 RT from point A-D pivot point
3 targets placed with fib plotted for reasons why (.382 for minor RT, .618 golden zone RT, 1.618 ultimate bullish gartley target)
Time will tell...
Search in ideas for "PLOT"

RSI w/ Multi-Time Frame Ability. Plot A 2nd RSI Diff Time FrameAvailable Options on Inputs Tab!!!
RSI with ability to change first RSI to a different Time Frame.(Defaults To Current Chart Time Frame).
Ability To Turn On/Off Background Highlighting if First RSI is Above/Below 70 or 30 Lines.
Ability To Turn On/Off Background Highlighting When First RSI Crosses Above 30 Or Below 70.
Ability To Turn On/Off "B" Or "S" When First RSI Crosses Above 30 Or Below 70.
Ability To Turn On/Off Mid-Line Plot.
Option To Plot 2nd RSI to show different Time Frames on same chart!!!
Ability To Use Different Look Back Period If You Plot 2nd RSI.

NQ PlotI titled my last post as NQ and posted an ES plot, lol. Anyways, they both look the same, but just to avoid any confusion, here's an NQ plot.
MFI oversold. That's basically all you need to know.

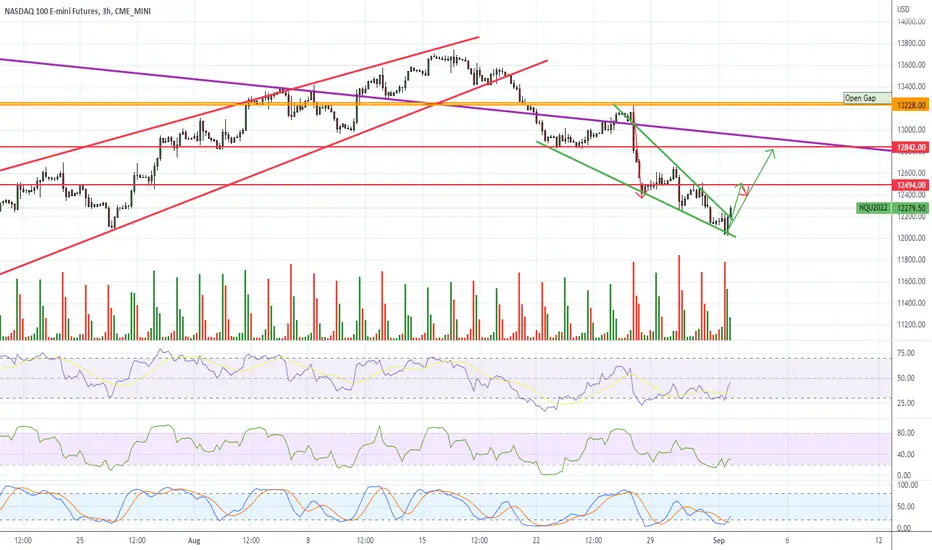
NQ Wedgie Revised PlotI did the wedgie plot earlier today as fast as I could to show my followers, now that I have more time, I realized the wedgie is bigger than the original plot.
This means the target is more than likely the higher resistance line. So up Friday, dip Monday then up Tuesday is the projection for now.
3 day short squeeze rule is definitely in effect, no shorting until Tuesday afternoon or Wed. I think cash over the weekend then buy calls Monday afternoon if the pattern holds.
ZECUSD at "a" support but is it "the" One? Zcash plot, bounce?ZEC has been one of the strongest Alts this run.
Of course it crashed along with the entire market.
But now it is at a pretty strong support zone.
Given the momentum, it is likely to slip one zone yet.
It is possible we get a good bounce here in the meantime.
But overall $62.50 looks very interesting for long term buy.
.
See some of my other plots and trade calls below.
I also plot Forex and Stocks, take a look at my profile page .
LINK re-entry (caught the spike)
LTC to $150 call (near perfect plot)
BTC bottom 3.1k (caught the EXACT bottom)
MATIC top Warning (caught the EXACT top)
NEO Rocket Launch (great entry, massive profits)
ETH breakout (instant Profits, no drawdown)
MATIC rocket (massive Profits, breakout entry)
ZRX breakout (massive Profits, short wait)
XLM breakout (massive Profits, instant Win)
ADA breakout (PERFECT targets, massive profits)
FET top warning (EXACTLY on time)
DASH top warning (EXACTLY on time)
Of course, I have had total FAILS on some ideas too, not going to pretend.
But all of my plots show PRECISE entries, TIGHT stops, and EXACT targets.
Precision is the way of the Fib. Almost every turn happens at a Fib Line.
.

BTC - Hit the plotted dip to the $96K support linrTarget reached as plotted. This should be a solid entry for BTC.
If entering a leveraged play try to stay under 10x as we do not have a bullish confirmation that the price decline has stopped looking at micro.

SMART MONEY PLOT TRENDLINES Duplicate idea from original idea with SMART MONEY TRENDLINES. This is also a new short position double top but on a 1HR TF. Reads differently from other 5min double top idea called “be on the look out possibility”.
The red trendlines are the original smart money trendlines from original idea, the green one is the most updated one which smart money has formed into a Regression Trend.
Now you see they visit their PLOTS. They touched their trend line but at a later time which was at a higher value than the $69,890

EUR/USD: zones are plotted. Time to monitor before executing!As the current structure stands, we are shifting our bias towards bears for the upcoming period of time.
The price has been able to bounce off the 1.068 - 1.069 area of support and is making its way to the 2 important recently penetrated key zones plotted on the graph:
1.086 area of resistance that lines up with the lower barrier of the portrayed channel and the 50% Fibonacci retracement level drawn from the top of the impulse
and
Fresh support now turned into resistance of the 1.08 key zone that aligns with the 38.2% Fibs.
Now, we wait for the price to approach the highlighted zones and match our entry criteria before we execute and look into riding the trend continuation.

Quarter point Plotting the GBPUSDLerning to quarter point plot. I placed the horizontal lines on the wicks of t the candlesticks to how closely the market moved in that direction.


Kava Plot.Timeline seems a bit off with this plot so I'm not sure however these are the fib targets based off previous moves, upside looks quite nutty from here but that's crypto.

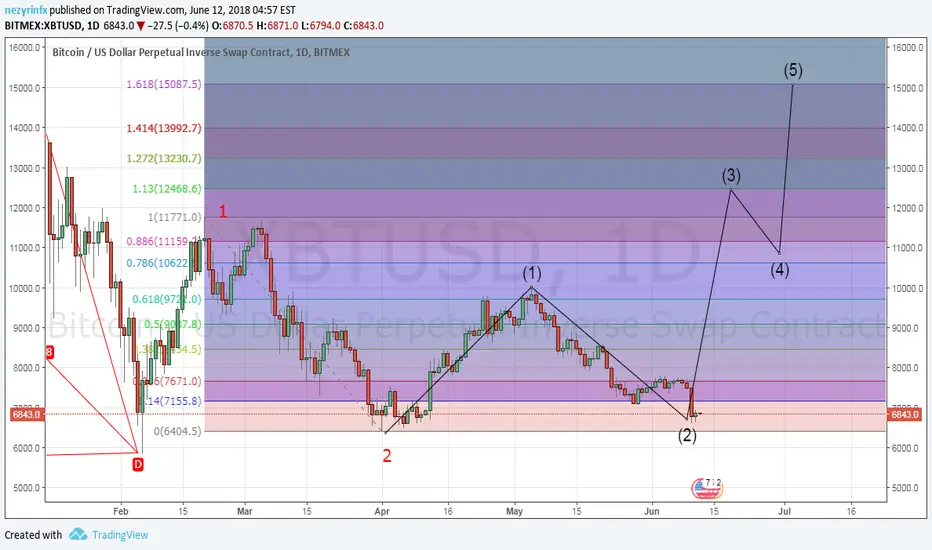
BTC.USD alternate plot with one more Leg UP before retraceAlternative plot/count to my primary expectation posted here (click) .
I think this is LESS likely path ahead, but has not been ruled out yet.
This pullback could be a wave 4 retrace and now starting the wave 5.
The requisite "ABC" of wave 4 is plausible, with the C being 5-part.
Reasons I think this is less likely:
- Wave 4 would have pulled back too far already to be strong bull.
- Wave 3 would not be very impressive, should be fast and furious.
- The entire bounce thus far "looks" more corrective than impulsive.
$ 7503 - 7512 (blue zone) is the KEY decision point, break below makes this path much less likely.
$ 7642 - 7656 (near red) is first resistance to look for clues, bulls want to shoot straight through it.
$ 7770 - 7744 could create a pullback to retest lower zone, still acceptable and bull if bounces there.
This is an UPDATE to my Bigger Picture which has been playing out very precisely:
.
Part of my ongoing Bitcoin analysis, been hitting every important turn (click):
7860 Retrace Call
7650 Resistance Map
6850 Bounce plot
5882 critical number
8700 Top Call
21k possible target (still possible)
9k bounce call
14k target call <=Perfect TP
10k target call
7.5k bounce call
3.1k bottom call (EXACT 2018 bottom)
Of course, I have had total FAILS on some ideas too, not going to pretend.
But all of my plots show PRECISE entries, TIGHT stops, and EXACT targets.
Precision is the way of the Fib. Almost every turn happens at a Fib Line.
.

Tradingplan from 7.5k to 6k plotted. This should help you trade the retrace.
Plotted by BFT Core Algo 1.6.
7187.5 -> 7500 -> 6872 -> 7187.5 -> 6250 with likely liquidation wicks to 6000.
Looking for more up after 6250-6000 consolidation

BATUSD hit targets and bounced, Now What? target Zones plottedBAT hit an expected support and bounced, see previous analysis below.
The bounce was exactly from a lower support to higher former support.
Close up looks like a clean 5-wave Impulse, calling for an ABC retrace.
3200-3230 bounce would be very bullish.
3050-3100 bounce would be 'normal' for early in move.
3160-3150 is a mid support (2.236) may well bounce it.
Ideally bulls are eager enough to step in BEFORE .30 round number.
Thus a break of the 3060 line would be of CONCERN or at least less bull.
But a break of the Impulse (fib 1) at 2960 would be DEVASTATING !!
The ABC plot is of course purely a GUESS so path is whatever.
The FIB zones are SOLID, reaction to them is worth observing.
Check out the Fib zone reactions in previous plot below .
Previous Analysis looking for the bounce:

The Rise Of BitcoinCash - Plotted SpeedBump Resistance Lines Lets get right down to it. First the disclaimer.
Not financial advise, dont bet the farm... you know dont make any bets based on this opinion. Seek financial advance from a qualified advisor and do as much research as possible before making any trade.
The Update
~~~~~~~~~~~~
Sorry to the people that follow us on Twitter waiting for these and previous plotted lines on a chart. We face certain problems trying to calculate on such a big currency such as BCH. The straight answer is that there are alot of different exchanges and those pools of volume must be taken into account before coming up with the lines. We chose BITFINEX for plotting our resistance lines since it has the least amount of drift when calculating using (Vs. BTC).
If you followed us on Twitter (here twitter.com) , we posted the first few lines of resistance already which seem to be holding up very well. Up till now our 3712 was our outer orbit of resistance. This is because it will take a very large amount of volume above this line to break it. And looking at the numbers today (right now) there isnt enough escape velocity to break it. We believe (and hope) this will result in some consolidation. $BCH needs to digest the move that has already happened to keep things together.
New SB Resistance lines
SBR9 =9355.48
SBR8 =8001.6
SBR7 =7371.06
SBR6 =6052.67
SBR5 =5799.1
SBR4 =4403.7
SBR3 =3712.52 (Contested - needs a lot of volume to break)
Support =3333.23 (Resistance Defeated)
Support=3122.09 (Resistance Defeated)
Lurker Buyer =3077.87 (Last seen a while ago. Not seen since.) Will post when #Mudspike occurs.
Who is #MrBlackhole
~~~~~~~~~~~~~~~~~~~~~
There is a very large buyer we have detected in 3 cryptocurrencies and seems to have a very heavy influence. It seems this person/bot is buy side only and does not sell. This is why we branded him MrBlackHole. That said this is has made predicting movements higher easier because there is a very predictable incremental jumps buying levels. For some this sounds like pixie dust and hog wash. But if you look at our twitter and Trading view posts on VTC Vercoin, we have been able to predict levels of resistance before it even trades there. More recently we have been initiating coverage on BCH but unfortunately we do not have the sources to keep it up. So we will not be providing on going coverage beyond what we have posted here. The computing power, data storage and time required is .... taxing on our resources.
We will be providing coverage on one other coin in the coming days as soon as we verify the numbers. Now that we are finished with $BCH we will be focusing on the quieter coins.

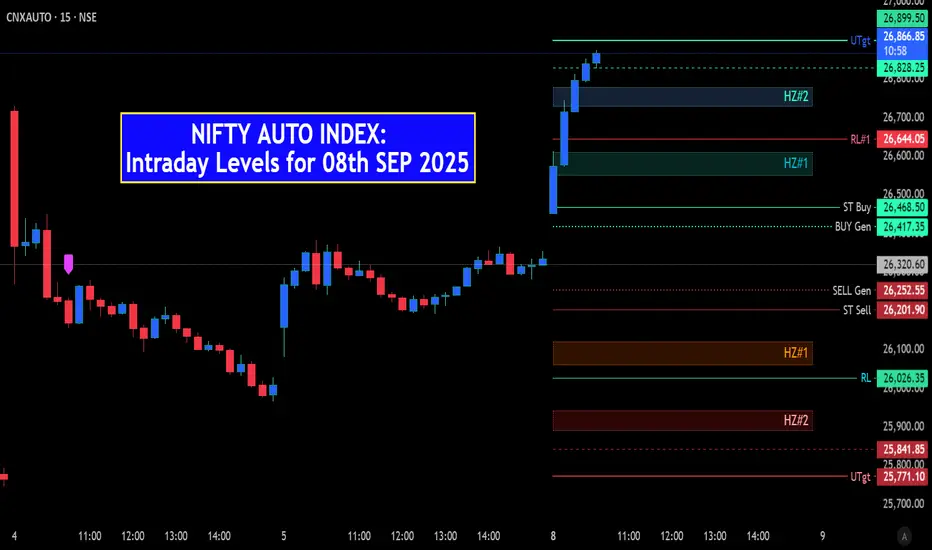
NIFTY AUTO: OME CORRECTION AHED INTRADAY LEVELS plottedCNXAUTO: Intraday Levels for 08th SEP 2025
SOME CORRECTION AHED.
POSITIONED NEAR UTgt LEVEL.
Constituents of weightage stocks can slip from yheir TOP
^^^^^^^ Plot Levels Using 3 Min, 5 Min Time frame in your Chart for Better Analysis ^^^^^^^
L#1: If the candle crossed & stays above the “Buy Gen”, it is treated / considered as Bullish bias.
L#2: If the candle stays above “Sell Gen” but below “Buy Gen”, it is treated / considered as Sidewise. Aggressive Traders can take Long position near “Sell Gen” either retesting or crossed from Below & vice-versa i.e. can take Short position near “Buy Gen” either retesting or crossed downward from Above.
L#3: If the candle crossed & stays below the “Sell Gen”, it is treated / considered a Bearish bias.
L#4: Possibility / Probability of REVERSAL near RL#1 & UTgt
HZ => Hurdle Zone, Specialty of “HZ#1 & HZ#2” is Sidewise (behaviour in Nature)
Rest Plotted and Mentioned on Chart
Color code Used:
Green =. Positive bias.
Red =. Negative bias.
RED in Between Green means Trend Finder / Momentum Change
/ CYCLE Change and Vice Versa.
Notice One thing: HOW LEVELS are Working.
Use any Momentum Indicator / Oscillator or as you "USED to" to Take entry.
📢 Disclaimer
I am not a SEBI-registered financial adviser.
The information, views, and ideas shared here are purely for educational and informational purposes only. They are not intended as investment advice or a recommendation to buy, sell, or hold any financial instruments.
Please consult with your financial advisor before making any trading or investment decisions
Trading and investing in the stock market involves risk, and you should do your own research and analysis. You are solely responsible for any decisions made based on this research.
BEARISH PLOTTER READER! (2HR TF)Good Day Traders
I wanted to use a higher timeframe, but the two-hour timeframe was more convenient because my bearish plotter is pointing out only the two-hour timeframe from all timeframes. This lets me know BITCOIN will make its way down for a minor trend.
I've done some price range measuring. I have two custom gaps left out in the open from all three measurements. This can only work with my bearish plotter.
Two red long rectangles are the left opened gaps which price can potentially hit those targets.
The green gap is genuine.
I drew a parallel trend line starting point from the top of the wick to the last bottom candle wick. I've measured the longest trendline and cloned it which is the most recent white parallel trendline.
BITCOIN is behaving as if it wants to keep pushing up. There's no way of telling. It's pushed up in the past on a daily timeframe regardless of stochastic RSI was overbought but don't count on it.
Pay attention to the most recent candlestick. The candlestick has almost filled the green gap which my custom MA has predicted an uptrend moving forward but it is just guidance.
MY ADR MA, please follow it and see the way it plays out.
Summary:
Does this mean the price can fall to those 4 prices, it's a possibility, but so far it's touched the most recent green gap.
Based on a 2-hour volume, it all makes sense. We have three levels of the highest volume.
This is only a two-hour timeframe, it's just guidance by using a strategy. I had to create my own gaps. As I created them; WALA!, look at the first red gap
let's see how it plays out, so don't panic. We're in a 3-YEAR BULL RUN.

BTC hit our targets EXACTLY, now in Retrace Watch: EARLY PlotPart of my ongoing analysis of Bitcoin moves (see links below).
BTC hit our last targets EXACTLY and is pulling back as expected.
This is an EARLY plot of possible retrace targets to be looking for.
Primary question is WHICH order of waves need to be corrected.
$ 9461-9528 is the "Minimum Expected" retrace target.
$ 9167-9204 is "Likely to be Hit" and should bounce a bit.
$ 8314-8374 is my "Best Guess" even if it seems too bearish.
As the retrace develops, I will fine tune the targets and post a new Idea.
.
My previous charts catching every key turn and giving early warnings (click the links below):
10.2k Targetted <= Hit within $18
9.4k focussed target
8.2k to 10k wave 5
9k barrier Foretold <= Warning in Time
8k ReBag in HiRes
8475 Top Call <= Mapped within $5
Sub 7k Foreseen
Big Picture Fibs <= the 3 Fibs of Life
7800 Dump Warning
7080 Rocket Foreseen <= within 20 cents!
14k target call <=Perfect TP
10k target call
3.1k bottom call <=EXACT 2018 bottom
Of course, I have had total FAILS on some ideas too, not going to pretend.
But all of my plots show PRECISE entries, TIGHT stops, and EXACT targets.
Precision is the way of the Fib. Almost every turn happens at a Fib Line.
.

ICX.btc dig out of hole? Bounced EXACTLY as plotted now what ?See my Previous Analysis that caught the bottom EXACTLY (click) .
Icon bounced where expected in the plot above.
Now we have a crucial Support that needs to hold.
And we have nearby Resistance that needs to break.
1898-1906 sats is the Crucial support that most not break.
2020-2025 sats is the immediate Resistance just above us.
1950-1952 sats would be the ideal Bullish bounce to see.
If we get move past resistance, I will plot targets at that time.
Too early to assume "bottom" is in, since many alts just keep diving.
Confirmation of bottom would break of 2k sats and retest with bounce.

How to Use Manual Levels PlotterBy defining a Structure of the Market you are trading, you can utilize the scaffolding of price as a means to take Low Risk Trades with High Rewards. Take this example of the ES. Levels were drawn beforehand on a larger TF chart. I define the structure of the market as places where either 1. Buyers Beat Sellers, and price shoots up, or 2. Sellers Beat Buyers, and price shoots down. It is at these points of control where price tends to revisit. By analyzing the price action on lower TF charts, we can take minimum 1:3 RR trades as price crosses over these levels. My indicator () makes it a bit easier to keep track of the levels for each instrument you're trading, whether you're on the computer or mobile. By observing Price Action on lower timeframes, we can analyze the trend and strength of the market to take a trade with a predetermined target(the next level above or below) and a predefined risk of 1/3 the profit target.

How to plot Fibonacci levels in a chartHere in this video we have discussed the process of plotting Fibonacci Extension and Retracement in a chart to identify probable support and resistances for future.

Log Plotting Future Hype...Big Boy wave plots here - anticipating the future tech bull run that imo is already underway - majority are still overly bearish on markets and the future ahead...so that clearly means we're going to melt up higher.
