Bitcoin - The Bull Scenario As you all know, there is a lot of uncertainty running through the crypto market at this time. Many worry that Bitcoins parabolic trend is broken and an even more serious correction could be on its way.
However, Based on Trendline Analysis the chart above shows a very different possibility.
We recently just bounce off two historical trendlines, one at the low of 9200 and most recently again at 9800, which created a very precise higher low.
This all of which is happening in what appears to be a giant Bull Flag.
Taking this analysis a step further; As seen in the chart below, BTC has had several large corrections in the past. All of which have lead us to new highs.
Based on ratio analysis, plus the magnitude of this last leg. BTC should've have seen approximately an 49% retracement from its all time high.
So as long as a larger correction is not in play, the 53% correction should suffice.
My Plan of Action:
The key thing for us to do now is to keep the daily close above that dashed line.
IF it is held, I expect a nice bounce within the next couple days.
IF this line is not held, there is still hope for the Bulls. I would then look for entry within the green support zone shown above.
IF we are able to successfully break up from the Bull Flag, The lines above mark possible resistance.
Clearer Target Points will be determined after this occurs.
Things to watch out for:
A Daily Break below the support zone, could be a very dangerous sign.
I will likely close all long trades if this should happen.
Also, this post does mean I am Bull. I am merrily showing the possibilities.
Yes, the ratio chart above seems promising, however if you zoom out further, the chart tells a very different story.
Meaning there is still the strong possibility of a larger correction in play.
Requiring all of us to think and react dynamically.
I wish you all the best of luck.
DISCLAIMER:
Please note I am only providing my own trading information for your benefit and insight to my trading techniques, you should do your own due diligence and not take this information as a trade signal.
Search in ideas for "RATIO CHART"

01-14 Gold to Silver ratio Chart (by Got Goldies)You can see Gold ratio is topping out. These are more than 1 year tops. I believe about a 5 year top.

Aventus - doubling within some days, $70 in a month or twoThis is not financial advice. I am a rookie trader (please ignore the "pro" mark).
I'm hugely bullish on Aventus. I bought a bunch.
WHY BUY?
It broke out of a bearish Fib. circle set some days ago and got that pushing it up.
It is soon hopefully gong to break out of a giant bearish Fib. circle set (upwards).
It has some great circular symmetry with the mid size circle set that is bullish and is in the bottom of that.
Everything will in in a symphony push the price up together to the moon.
Looking at the AventusBitcoin ratio we find some great symmetry and potential for a rise (ratio chart below).
Everything is looking awesome.


11-28 Gold to Silver Ratio Chart (by Got Goldies)Looks like the ratio popped. That's okay its only a quick fix.


10-05 Silver to Gold Ratio Chart (by Got Goldies)And now you can make a forecast.. i.e look at my USD charts from 2-28.

10-05 Silver to Gold Ratio Chart ( by Got Goldies)And I can teach you the different types of topping formation based on this SGR chart.


Beaware of shorting USDPY.The chart i have put up here is Ratio chart between US & Japan 10 year Bond price. this ratio chart has inverse correlation to $/Yen. Ratio chart which is a blue line broke down from the channel is likely to continue lower given the momentum on weekly & daily chart, which is likely to send the pair higher from here. I am also doubtful whether issue between N.K. & U.S. would actually escalate further as china is urging restraint over North Korea. Moreover the world knows about the destruction which nukes can have, but you never know as both Trump & Kim-Jong-Un are extreme minded people they can worsen the situation though.

‘Margin of safety’; accumulate towards a $9 cost basisMarathon Oil Corp. $11.31
July 13th 2017
Energy has underperformed the S&P 500 by -21% year-to-date. Marathon is down -35% and trades at a 22% discount to tangible book value, despite being relatively well positioned to withstand lower crude oil prices (figure 1).
At 6.2x EV/EBITA (9.0x sector average), there are signs that patient investors will be rewarded by the company’s current valuation.
Tactical Summary
Speculative positioning: Speculative positioning is extremely short, for only the third time in 15 years (not pictured) . Notably, the current extreme has set a new record, surpassing even the pessimism that surrounded the stock in 2016 when crude oil was trading 40% below current levels. This is a bullish signal for contrarian investors.
Patient money flows: Real money investors are accumulating at current levels (not pictured) . Although the stock declined further following a similar condition in 2015, the current setup has a coincident extreme in speculative positioning, which was not the case then. The last (and only) time there was similar confirmation was in 2016, when the stock registered a 14-year low before trebling over the next 9 months.
Technical analysis: Although momentum is currently negative, the RSI oscillator is oversold on a weekly and daily basis which suggests that price may begin to stabilise (see chart) . A new regime of outperformance would be confirmed by a crossing of the two moving averages shown in the ratio chart in figure 6.
Trade management: Price is currently around the 61.8% Fibonacci retracement level from the Feb ‘16 low (see chart) . With fundamental value present, investors may look to establish a position here and accumulate towards a basis of $9.25, coincident with the 78.6% pivot. Whilst our valuation ‘margin of safety’ would have grown a further 20%, a break below this level would suggest a retest of the 2016 low ($6.50).
Disclaimer: This report is compiled for professional investors and intended for the named person's use only. It may contain confidential, proprietary or legally privileged material. Data is provided for informational purposes and should not be considered sufficient to base an investment decision on. This information should not be regarded as a solicitation or recommendation of any particular security or to engage in any trading strategy.

Gold and Silver ratio Chart (by Got Goldies)50 to 1 one year from now. I call that cujo corner up top. Its a special way to understand the topping formation.

ETHBTC: Ethereum is in an uptrend in the intermediate term$ETHBTC shows a strong uptrend in place, with a good chance of accelerating after this weekend, which is charged with news, as the Enterprise Ethereum Alliance group releases a demo of the technology they have been working on, and a series of important events take place during next week and during June. If we hold up here, and just close here or higher, the weekly will confirm a new uptrend signal, with a considerable target, which I have labeled on chart here.
At the same time, we have a monthly uptrend currently active, which indicates two targets as logical and highly likely to be attained, 0.14 something and around 0.25 BTC, in the ratio chart here. Refer to my other $ETHEUR posts for the fiat targets and analysis. Although the chart is slightly different, strong trending moves in $ETHEUR will correlate with the $ETHBTC ratio going up for the most part.
Good luck if already long, if not, buy into it during a few days, price shouldn't drop below 0.0359 technically speaking, and any retest of the zone below would warrant a buy, but hopefully, it doesn't happen and it just trends up from here onwards.
Cheers,
Ivan Labrie.

ETC BREAKOUT?ETC BTC ratio chart broke out of red triangle ( with decreasing volume) while shooting away from the 100 dma and through the 23% fib retracement.
ETC also broke through hard resistance line X and looks to be headed for the top of the fib zone.
Eventually ETC will see resistance at the top of zone 4 (top of the blue channel).
Line X and the middle blue line of the diagonal channel offer support
Watch for stochastics to embed above 80 and RSI to spike above 70... if this happens ETC could be headed for all time highs.

ZEC/DASH+XMR: Probably good to swap your XMR and DASH for ZECLooks like a turning point here in the ratio chart of these coins pitted against ZEC. ZECEUR and ZECXBT hit a huge support level which is an ideal long entry, so, if interested in riding the potential uptrend continuation play in it, consider taking at least partial profits from any holdings in DASH or XMR that you may have, to invest in ZEC. It is relatively stronger now, and also cheaper, so, it might catch up to these two other similar assets.
Cheers,
Ivan Labrie.

ETHBTC: ratio chart updateETHXBT has been rallying steadily for now, and is approaching a strong resistance zone. We can expect a short term top or consolidation here, if not, aim for the next level on chart.
I'm holding my positions and won't sell until the monthly targets are hit.
We can trade this pair in the short term though, and capture short term declines with margin positions. Keep an eye on the key levels above, and my next updates.
Good luck,
Ivan Labrie.

Copper/Oil spread: once again getting out of handWe have an interesting spread between copper and oil, with the ratio chart showing signs of outperformance in Copper, relative to Oil today. We might be at a local bottom for this ratio, which paves the way for AUDCAD longs, as well as trading Copper and Oil futures/CFDs as a pair, going long Copper, whilst simultaneously going short Oil.
This is a very interesting signal, so keep an eye out for the effects of it. Check related ideas for the previous signal' results.
Cheers,
Ivan Labrie.

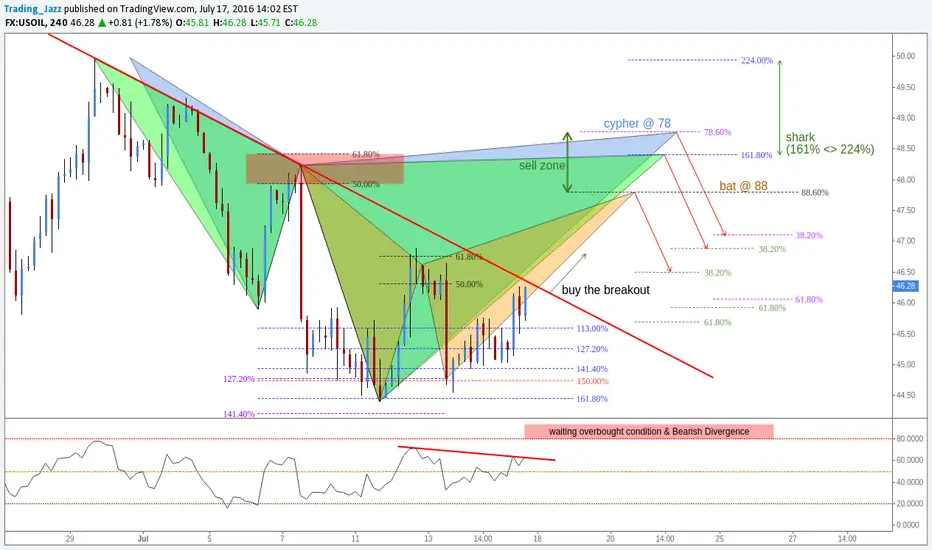
(4h) Structure Breakout // Bearish Patterns LevelsFX:USOIL
Buy the Breakout, Sell the advanced pattern;
The Shark
The Cypher
The Bat
Full Ratios
Safe Trades;
(Weekly) To buy @ Cluster // Finishing ABC(D) correction ?FX:EURNZD
Wait for Divergence:
The Bat:
The Shark:
Ratios:
Safe Trades;

TD/CUBI: TD offering an interesting shortTim West has shared this setup in the KHL chatroom this week. I'm posting it so everyone sees it, in case you missed it.
We can enter shorts in TD, and additionally longs in CUBI to create a pair trade (or simply take the short).
Position size if trading the pair involves risking going long with 7% size in CUBI, and short TD (with the same size), simultaneously. This gives us a 1% risk if the ratio chart falls to 0.58, which will happen if TD moves up 7%, or if CUBI moves down 7%.
If interested in my trading signals, or in personal tuition, contact me privately. I'm offering a considerable discount on a packaged course which includes access to my private trading signals list for a year.
Cheers!
Link to Tim West's chatroom: www.tradingview.com
We discuss setups like this often there. Feel free to stop by and subscribe to his indicator pack. If you have any questions ask.

(2h) Completed Gartley @Cluster // Eventual Shark // IF=THEN ®FX:EURJPY
GARTLEY
Point B:
61.8% can not touch 78.6% XA
Point C:
38.2% to 88.6% AB
Point D:
78.6% XA
127% ext AB
Target:
TP1 38.2% AD
TP2 61.8% AD
SHARK:
Point B:
61.8% XA
Point C:
113% to 161% AB
Point D:
161% to 224% BC
88.6% to 113% XC
Target:
38.2% to 100% CD
Safe Trades;
(third wave by Calmstreet) ;)
open.spotify.com
