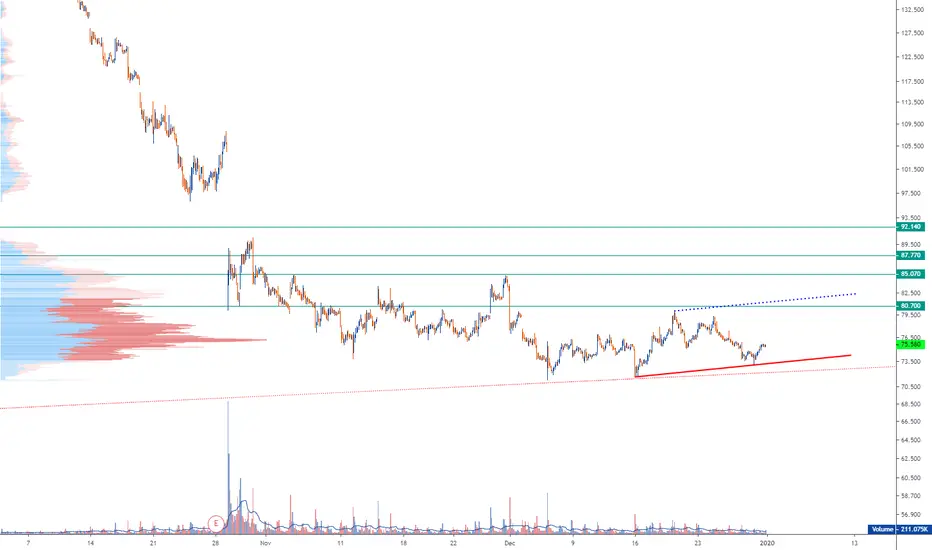
FX journey #2 | Position 1Here are some reasons, we have uptrend here. We have also our Stop loss under the channel's support.
This journey is similar to tradingviews paper trading so do not risk your money.
Search in ideas for "TRADINGVIEWS"

Possible reversal on ABSAJSE:ABG has broken through the downward trendline that it has been obeying since 5 June -the stochatic is also looking good for a reversal. If confirmed with tomorrow's price action, I might consider entering a long position with the target at around the 10000 level.

GBPUSD TRADE IDEA I'm Goin to to watch this closely and patient
And if my analysis goes right after that I'm Goin to do what to do it kkkk
As i always tell don't take my words serious make also your analysis if they match is good if I'm wrong tell me and drop your comments in the comments below thanks

BYND Trend Lines Resistance LinesGreen Lines based off of Tradingviews Pivot Points. I have to ask them how often those update and if they are legit. I assume they are legit but one should trust and verify. If anyone has let me know, please, could save me some time. Just curious how they pull their numbers.
NASDAQ:BYND
Wheat long @ 526.83stop @ 512.00 target TBD will buy on dips as well down to 519.00 my rates are 100 x tradingviews

Strange Hourly Chart PresentationHi everybody,
I am just curious about the TradingViews' XAUUSD hourly chart. In particular, there is a gap up and a red hammer candlestick on 15 September 2019, 22:00 GMT.
Shouldn't it be a long green candle stick that represented the trading activities in the particular hour ?
I am comparing the above chart with the chart provided by Dailyfx.com which data I believed is provided by TradingView.
Would somebody please clarify on this non-synchronicity ?
Thank you so much for your kind attention.
Regards,
Johan Syah

CONGRATULATIONS! BITCOIN is Officially in The Bull Market!Dear Bitcoin-Lovers!
D4rkEnergy is back to spread more LOVE and WISDOM to the Crypto-Community. Today - 21.6.2019 - we are officially in the Bull Market. If we look at US Stocks we normally say, that a Bull Market occour after a 20 % (18% is the right number though) increase in price from the low. Bitcoin is up more than 200%.
In crypto we normally dont define a Bull Market in such way due to high volatility. So we are instead looking at 2 other things:
- MAs (Moving Averages). Notice how the 50Ma is above 100MA, which is above 200MA. And above all the MAs are the price.
- Volume Profil: If the Price is below the Purple Volume Area (Where 70 % of all trades are generated, we are in a Bear Market. If the Price is IN the 70% Volume Area, we are an i neutral zone. And IF we are above, which you can see we are, we are i a Bull Market.
What to Expect Now - And some general advice:
-Bitcoin Will Continue its Parabolic Movement, and go THROUGH 10,000 USD, and whales will help to continue their plan to kill Shorts and get new retailers into the Market.
-Dont gamble to much on Altcoins (especially BTC-pairs) hence BTC will continue to make spikes, and sudden moves, which will ruin altcoins. We can therefore expect to see an increase in BTC-Dominance.
Congratulations!
D4 Loves You <3
PS. Please hit that LIKE-Button like a BOSS!
PPS. D4rkEnergY Will later today be in TradingViews TV Show, TradingView Sessions. It will be aired later today!

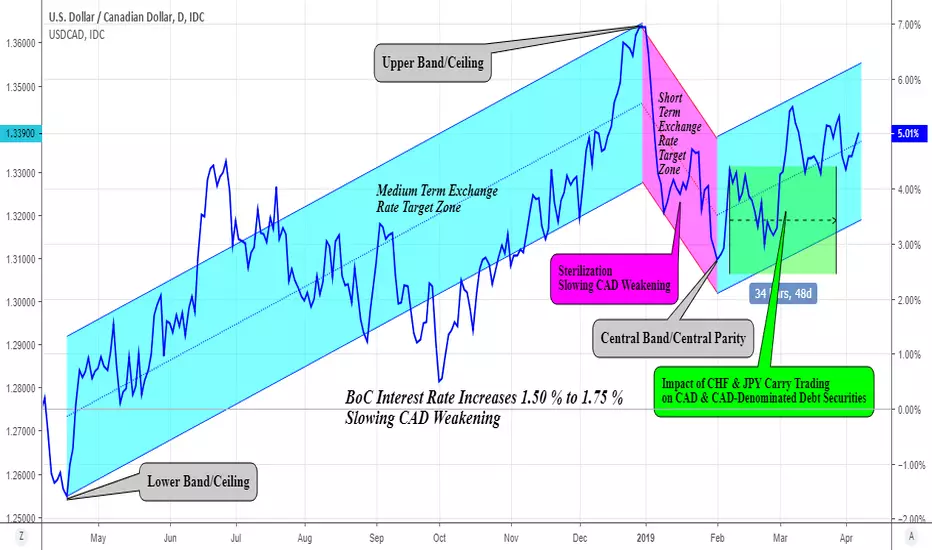
JLS: USDCAD Target Zone Analysis for TradingThe Fed and BoC managed the USDCAD target zone for 10 % width of medium term exchange rate target zone in compliance to Louvre Accord but wider and narrower subject to the actual average traded weighted rate of USDCAD to JPY, CHF and EUR at upper band/ceiling and at lower band/ceiling by their price stabilization/compression rate. The pair moved from their disequilibrium to equilibrium in compliance to equilibrium exchange rate.
At upper band/ceiling, BoC undertook sterilization to slower the weakening of CAD against USD as permitted by the central banks' consensus in addition to the strengthening by the BoC increases on interest rate from 1.5 % to 1.75 %. The consensus allow for BoC to sterilize up to 50 % of the medium term exchange rate target zone to central band/central parity. In the past I estimated that the sterilization will be up to 1.3100 and ended at this level. This sterilization was opportunity for CHF and JPY carry traders for carry trading on CAD and ACD-denominated debt securities and to drive the CADJPY and CADCHF to upward wider than 5 % or wider than USDCAD. However, both Fed and BoC maintained the USDCAD to be sterilized up to estimated 50 % of the medium term target zone as permitted by the consensus, ended at 1.3100.
The impact of the CHF and JPY carry trading activity however to put the USDCAD to be prolonged at central band/central parity for the benefit of BoC, also called the honeymoon affect. However, should the JPY and CHF carry trading activity to be dismissed then the USDCAD will be jumped sharply to upward to visit her new upper band/ceiling of medium term exchange rate target zone. The pair however may pauses at current actual upper band/ceiling before bullish back for another 5 % from the current actual upper band/ceiling. At what exchange rate the new upper band/ceiling is measured by the average weighted rate on the USDCAD to JPY, CHF and EUR. However, the combination of price and percentage charting by this TradingViews could be useful to gauge the next 5 % price bullish .
This methodology is based on the guidelines and procedures for the assessment and measurement of target zone and sterilization by the Fed and global central banks in compliance to Plaza, Louvre and EMS agreements. It was also publicated by CEPR (Center for Economic Policy Research) and NBER (National Bureau of Economic Research).
JLS: AUDUSD Target Zone Analysis for TradingThe Fed and RBA managed the AUDUSD target zone for 10 % width of medium term exchange rate target zone in compliance to Louvre Accord but wider and narrower subject to the actual average traded weighted rate of AUDUSD to JPY, CHF and EUR at upper band/ceiling and at lower band/ceiling by their price stabilization/compression rate. The pair moved from their disequilibrium to equilibrium in compliance to equilibrium exchange rate.
At lower band/ceiling, RBA undertook sterilization to slower the weakening of AUD against USD as permitted by the central banks' consensus. The consensus allow for RBA to sterilize up to 50 % of the medium term exchange rate target zone to central band/central parity. In the past I estimated that the sterilization will be up to 0.7400 but ended at 0.7390. This sterilization was opportunity for CHF and JPY carry traders for carry trading on AUD and AUD-denominated debt securities and to drive the AUDJPY and AUDCHF to upward wider than 5 % or wider than AUDUSD . However, both Fed and RBA maintained the AUDUSD to be sterilized up to 5 % or estimated 50 % of the medium term target zone as permitted by the consensus, ended at 0.7390. Previously, I consistently stated that AUDUSD was sterlized to 0.7400 but ended at 0.7390.
The impact of the CHF and JPY carry trading activity however to put the AUDUSD to be prolonged at central band/central parity for the benefit of RBA, also called the honeymoon affect. However, should the JPY and CHF carry trading activity to be dismissed then the AUDUSD will be dropped sharply to downward to visit her new lower band/ceiling of medium term exchange rate target zone. The pair however may pauses at current actual lower band/ceiling before pressured back for another 5 % from the current actual lower band/ceiling. At what exchange rate the new lower band/ceiling is measured by the average weighted rate on the AUDUSD to JPY, CHF and EUR. However, the combination of price and percentage charting by this TradingViews could be useful to gauge the next 5 % price drop .
This methodology is based on the guidelines and procedures for the assessment and measurement of target zone and sterilization by the Fed and global central banks in compliance to Plaza, Louvre and EMS agreements. It was also publicated by CEPR (Center for Economic Policy Research) and NBER (National Bureau of Economic Research).

JLS: GBPUSD Target Zone Analysis for TradingThe Fed and BoE managed the GBPUSD target zone for 10 % width of medium term exchange rate target zone in compliance to Louvre Accord but wider and narrower subject to the actual average traded weighted rate of GBPUSD to JPY, CHF and EUR at upper band/ceiling and at lower band/ceiling by their price stabilization/compression rate. The pair moved from their disequilibrium to equilibrium in compliance to equilibrium exchange rate.
At lower band/ceiling, BoE undertook sterilization to slower the weakening of GBP against USD as permitted by the central banks' consensus. The consensus allow for BoE to sterilize up to 50 % of the medium term exchange rate target zone to central band/central parity. This sterilization was opportunity for CHF and JPY carry traders for carry trading on GBP and GBP-denominated debt securities and to drive the GBPJPY and GBPCHF to upward wider than 5 % or wider than GBPUSD . However, both Fed and BoE maintained the GBPUSD to be sterilized up to 5 % or estimated 50 % of the medium term target zone as permitted by the consensus. Previously, I consistently stated that GBPUSD will not break 1.3300/75 no matter how high GBPJPY and GBPCHF.
The impact of the CHF and JPY carry trading activity however to put the GBPUSD to be prolonged at central band/central parity for the benefit of BoE. However, should the JPY and CHF carry trading activity to be dismissed then the GBPUSD be dropped sharply to downward to visit her new lower band/ceiling of medium term exchange rate target zone. The pair however may pauses at current actual lower band/ceiling before pressured back for another 5 % from the current actual lower band/ceiling. At such, GBPUSD may pauses at 1.2400/1.2600 before the pair pressured down for another 5 %. At what exchange rate the new lower band/ceiling is measured by the average weighted rate on the GBPUSD to JPY, CHF and EUR. However, the combination of price and percentage charting by this TradingViews could be useful to gauge the next 5 % price drop .
This methodology is based on the guidelines and procedures for the assessment and measurement of target zone and sterilization by the Fed and global central banks in compliance to Plaza, Louvre and EMS agreements. It was also publicated by CEPR and NBER.

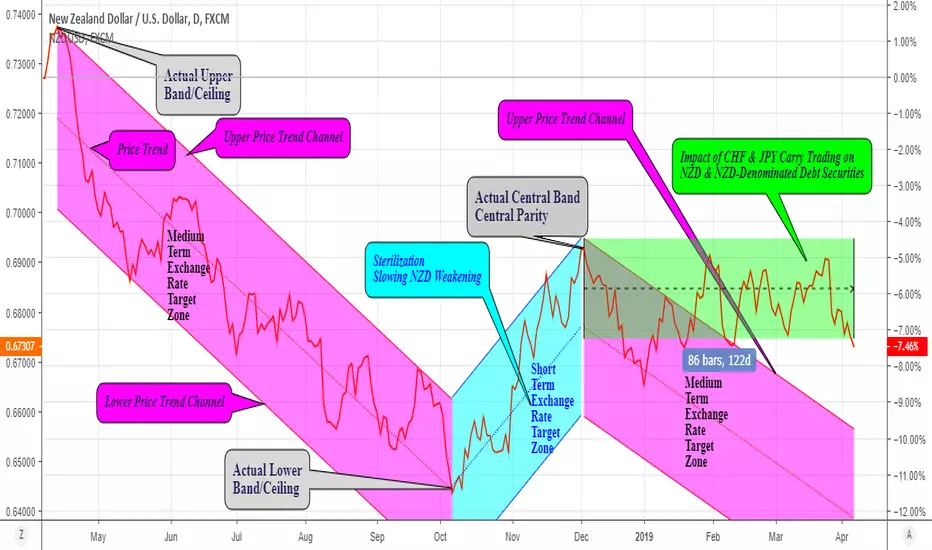
JLS: NZDUSD Target Zone Analysis for TradingThe Fed and RBNZ managed the NZDUSD target zone for 10 % width of medium term exchange rate target zone in compliance to Louvre Accord but wider and narrower subject to the actual average traded weighted rate of NZDUSD to JPY, CHF and EUR at upper band/ceiling and at lower band/ceiling by their price stabilization/compression rate. The pair moved from their disequilibrium to equilibrium in compliance to equilibrium exchange rate.
At lower band/ceiling, RBNZ undertook sterilization to slower the weakening of NZD against USD as permitted by the central banks' consensus. The consensus allow for RBNZ to sterilize up to 50 % of the medium term exchange rate target zone to central band/central parity. This sterilization was opportunity for CHF and JPY carry traders for carry trading on NZD and NZD-denominated debt securities and to drive the NZDJPY and NZDCHF to upward wider than 5 % or wider than NZDUSD. However, both Fed and RBNZ maintained the NZDUSD to be sterilized up to 5 % or estimated 50 % of the medium term target zone as permitted by the consensus.
The impact of the CHF and JPY carry trading activity however to put the NZDUSD to be prolonged at central band/central parity for the benefit of RBNZ. However, should the JPY and CHF carry trading activity to be dismissed then the NZDUSD be dropped sharply to downward to visit her new lower band/ceiling of medium term exchange rate target zone. The pair however may pauses at current actual lower band/ceiling before pressured back for another 5 % from the current actual lower band/ceiling. At such, NZDUSD may pauses at 0.6400/0.6500 before the pair pressured down for another 5 %. At what exchange rate the new lower band/ceiling is measured by the average weighted rate on the NZDUSD to JPY, CHF and EUR. However, the combination of price and percentage charting by this TradingViews could be useful to gauge the next 5 % price drop.
This methodology is based on the guidelines and procedures for the assessment and measurement of target zone and sterilization by the Fed and global central banks in compliance to Plaza, Louvre and EMS agreements.
Gold long My previous post was short for gold. But now I have redraw the chart and I see a Bull flag forming on 1h and 4, it's hard draw it right on tradingviews chart because my brokers 4h candle closes in different time. but if bull flag is right we may see Gold going up to 1260, maybe even today.

Spreads UPDATEStill, with no clear explanation, this is the reason why
I WOULD NOT BE HOLDING ANY FUNDS ON EXCHANGES.
GDAX - Finex spreads have widened dramatically:
Not because of tether, but because of the widening spreads at a time where liquidity has NOT dried up. The spreads widened DURING the 6K sideways trading. Volatility was LOW at the time.
Yes, the spreads were exceptionally wide during the parabolic cycle. This can possibly be due to the enormous influx of users on exchanges rapidly buying up bitcoin during the 2017 psychological mania.
HOWEVER
The widening in spreads in the low volatility environment at 6k was EXTREMELY suspicious to me.
As stated by the Willy Report in 2013/14:
"Combined with Willy still being active, this caused the spread between Gox (Mt. Gox) and other exchanges to get completely out of hand. At the pinnacle of it, on January 26th, Willy (Willybot, a bot insider that manipulated the price of bitcoin and had the capacity to buy bitcoin for $0) suddenly became inactive – and with it, the price retraced back to a more reasonable spread with the other exchanges."
"In total, a staggering ~$112 million was spent to buy close to 270,000 BTC – the bulk of which was bought in November. So if you were wondering how Bitcoin suddenly appreciated in value by a factor of 10 within the span of one month, well, this may be why."
"So how did all of this trading activity affect the price of Bitcoin as a whole? The answer is, unfortunately, enormously."
"The huge volume spike on July 28 15:14 is where the big buying starts. 15,000 coins get bought in the span of 30 minutes. According to the trade data, buying continues until the 31st, 15:55. After a four day pause, there’s some small buying on August 5th, but it really picks up again on the 12th at 21:32. Buying continues on-and-off, with some large spikes especially on the 19th, 27th and the 30th, where ten of thousands of coins are bought. Basically, all the huge green volume spikes in the above chart are the handiwork of Markus, and Markus alone." (Markus is a secondary bot noticed alongside WillyBot)
So, what's up with the GDAX spread?
The spread in my chart (BTCUSD - BTCUSD ) is in fact trading at the lowest point EVER. (At least that's what I see compared to the drawn out daily chart which, by Tradingviews logic will use the daily close to calculate the spread.
Using, bookmap.com 's chart's I maintain that sell volume is exceptionally aggressive and that, evident in this video, www.youtube.com there appears to be one or more aggressive bots placing significant downside pressure on GDAX books. In the video we can see, in the initial frame, the large red squares in the depth chart. These are the positions in question. They seem to have an endless supply of bitcoin, which I have observed since June. The bot's continue to place between 60-85 bitcoin diversified within the 10-20 points NTM (near the money) on the ASK side and appears to be 24/7.
Although hard to see in the realtime GDAX book, the aggregation of the ASK in the Bookmap charts, combined with the visualised depth chart makes these positions very clear.
This is my only explanation for the spreads, and nowhere else have I seen anyone have any better explanation (or any at all).
Although my data is not granular, one thing that can be clearly shown is the extremely suspicious spreads and more importantly, the timeliness of these spreads widening before price action.
In the above chart we can see that exchange spreads (GDAX-FINEX) widened significantly in a very controlled and stable manner until finally falling off AT THE SAME TIME as the enormous "pump candle" of the 15th of October. The spread seemed to tighten once again, as if the market began to re-balance, albeit slowly.
Then once again, the spread began to widen again, directly into the first sell of November.
Even more interestingly, during the pump of the 15th of Oct, at one point, GDAX traded OVER $1007 CHEAPER than Finex.
My fear is that this is only a 1 minute chart, and the Tradingiew spreads are using the candle close as data points. It is possible that, during that one minute candle, the spread was indeed far greater than this 1007 point value.
Although my data is not granular, the Willy Report of Mt. Gox in 2013 illustrates and proves that inter-exchange spreads CAN be influenced and OR caused by malicious bot behaviour. I do not suggest in any way that GDAX is a malicious exchange or that GDAX is acting against their TOS. Further I don't suggest that any other exchange is engaging in suggested or implied behaviour. It's entirely possible that this trading is simply being conducted by a client, retail or third party trader on these exchanges. Additionally, I could be entirely wrong and that the inter-exchange spreads are caused by an entirely different issue. I suggest that you read The Willy Report here: willyreport.wordpress.com and draw your own conclusions.

timing of U-turn's $NEO (by Gann)There is many way to 'u-turn' by Gann calculations, but i think, that this is most important. (signed red dotted line's) Point that was destinate early is marked in days past. As u can see, it was full checked. My apology abouut many details on chart (it depended with bugs tradingviews.com bugs)

LinReg curve geom. offsets could fit Arithmetic & Weighted MA'sFUN MATH FACT
A Simple LinReg curve could be used to calculate from TradingViews linreg function, quite simple both Arithmetic (Simple) Moving Average if we take as plotting point HALF OFFSET BACK from study periods (Periods/2). This also happens for the Weighted Moving Average if we took A THIRD OFFSET BACK from study periods (Periods/3).
CHEERS!

Long on breakout of downward channelThe end of the Month rally of Friday, took us to just above the 50% retracement level of the entire January sell off, and just below the 50% retracement level of Decembers swing high.
A new month and a new week has seen some profit taking, as we have moved down the channel shown here
Since US market open we have touched the top and the bottom of the channel, and we are currently going for a re-test of the highs, but without much conviction. There is an opportunity here if we can break this channel to the upside, or perhaps we will remain in downward consolidation for the rest of the day.
Watching for a break. If we break above the top trend line and it is confirmed by close of a 5 minute candle, I will look to go long on any pullback.
It's taken me so long to go through Tradingviews verification system to get this published we have now broken the channel - So looking for long opportunity on retest of top channel line for 5 point target

Short $EURUSD Trading Idea #forexShort 1.1275 Stop 1.1290 Target 1.1160. I do not belive 1.1288 (last friday NFP's high) to be broken before tomorrow US Retail Sales(if they are worst then expected, then yes we can see retest in 1.1400 area). Good luck to all.
Details here: tradingviews.weebly.com
