ADA / CARDANO roadmapADA appeared almost unexpected for the most of traders and took high spot in market cap. Went so high so fast that i'm not sure if there's anything but speculation behind that buy wall. However it seems to be legit long term project.
For now ADA is slowly drifting down.
1. If there will be a confirmed breakout of triangle - a trend reversal.
2. If it goes to 0.00004 - 0.00003 zone it's first stop to buy , but buy carefully and slow.
3. If ada goes below the pink line it's in free drift downwards and buying there is good. We are far away from there yet to see how things will unfold.
Search in ideas for "ada"

ADA | Cardano |ADA/ETHADA/ETH
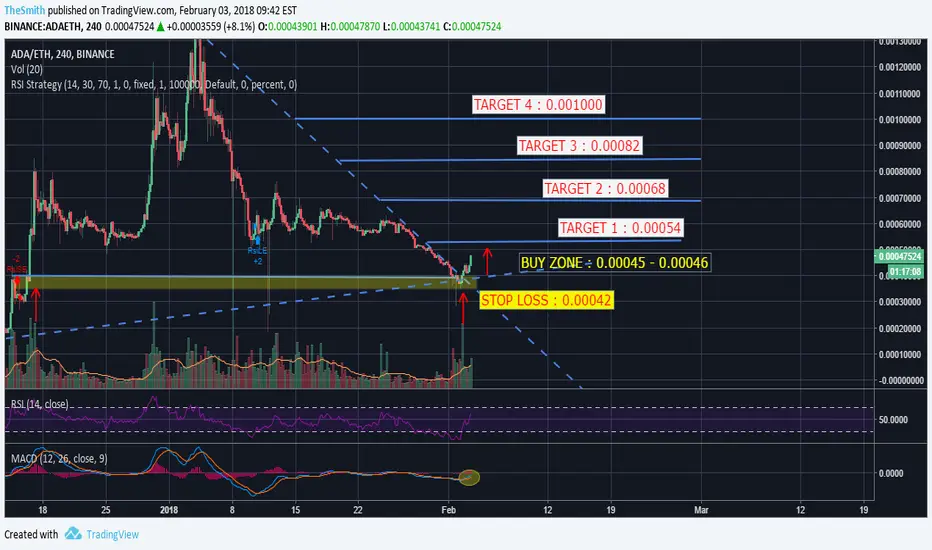
I think ADA will up with support Triangle Pattern And MACD
You can buy a fews and hold it .
Buy zone : 0.00045 - 0.00046
Profit Target :
(1) 0.00054
(2) 0.00068
(3) 0.00082
(4) 0.00100
Stop loss : 0.00042
GoodLuck Everyone
ADA - Elliot Wave Major structure trendline comlpeteADA doesn't have a major trendline yet. I believe we've completed the 1st leg of wave 1 of a larger Elliot Wave (1-2 of 1-5). When looking at ADA on a 1 week cycle I found a major trendline. I added the resistance and baseline to this trendline. I'll trade on these lines from now on. ADA to the MOON!!! @°


ADA — Fib Harmony With EMA/SMA SupportADA has been in a downtrend for the past 18 days and is now approaching a cluster of key support levels. Today, price tapped the 0.702 Fib retracement ($0.7841) — an optimal area for long entries.
The main focus, however, is the 0.786 Fib retracement, which aligns with a liquidity pocket and multiple layers of confluence, making it the most ideal entry zone.
🧩 Confluence at 0.702–0.786 Fib Zone
0.702–0.786 Fib retracement → prime long entry range
Liquidity pocket → sitting around the 0.786 Fib
200 EM ($0.7424) / 200 SMA ($0.726) (daily)
21 EMA ($0.766) / 21 SMA ($0.735) (weekly)
Pitchfork lower support line → intersecting the zone
0.618/0.666 Fib Speed Fan → adding another support layer
🟢 Long Trade Setup
Entry Zone: 0.702–0.786 Fib retracement
Best Entry: Around the 0.786 Fib
Stop-Loss: Below $0.70 (to be adjusted after seeing more price action)
Target (TP): $1.1757 (–0.618 Fib, in confluence with key high & buy-side liquidity at $1.1747)
Potential Move: +50%
R:R: ~1:4.5 up to 1:7 (depending on entry)
Technical Insight
ADA is testing deeper retracements within its current downtrend, the 0.702–0.786 Fib zone combines structural, dynamic, and liquidity-based confluence.
The added support of the weekly 21 EMA/SMA strengthens this area as a pivotal level for bulls to defend.
If held, this zone could fuel a swing long setup with great upside potential.
The $1.1747–$1.1757 zone is both a high-confluence take-profit area and a potential short opportunity, given the liquidity resting above that level.
🔍 Indicators used
LuxAlgo — Liquidity Sentiment Profile (Auto-Anchored)
Multi Timeframe 8x MA Support Resistance Zones → to identify support and resistance zones such as the weekly 21 EMA/SMA
➡️ Available for free. You can find it on my profile under “Scripts” and apply it directly to your charts for extra confluence when planning your trades.
_________________________________
💬 If you found this helpful, drop a like and comment!
ADA (repeat the pattern)ADA /USDT
ADA keeps repeating its old patterns as it’s clearly obvious in my chart
Breakout is going on lower time frames
Looks like an easy 2X
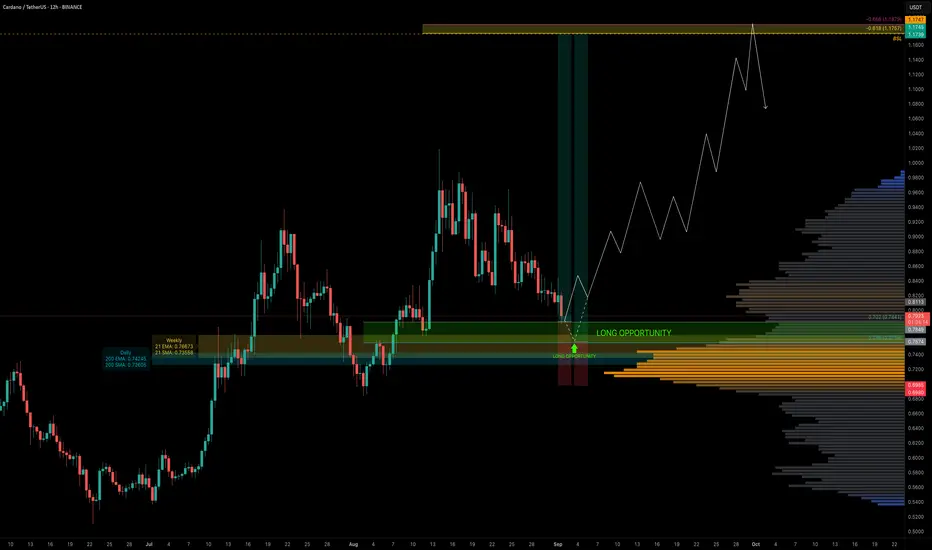
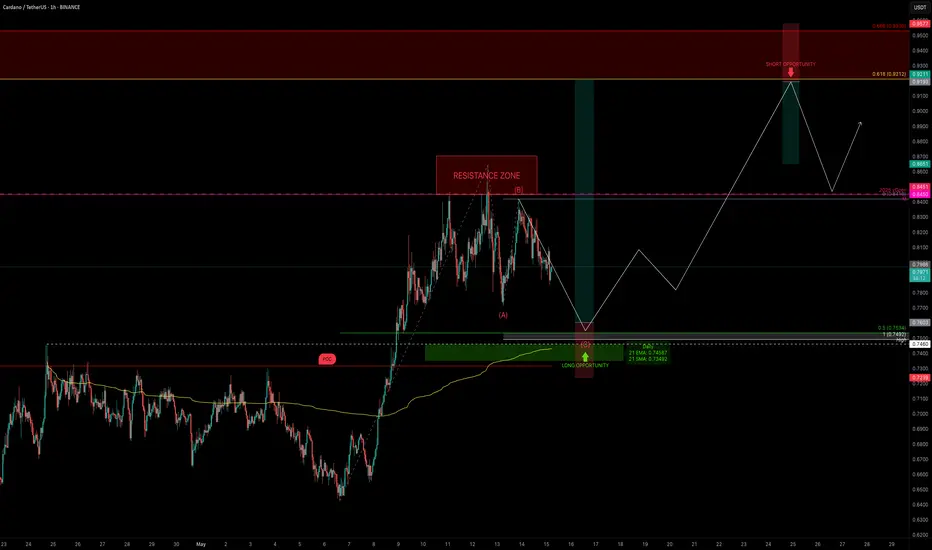
ADA Correction Nearing Completion — Trade It Like a ProADA is respecting structure beautifully and currently consolidating after completing a 5-wave impulse move. The key question now is: where are the next high-probability trade setups?
Let’s break it down step by step.
Market Structure & Elliott Context
ADA has completed a full 5-wave bullish sequence, and—as expected—is now in a correction phase. This appears to be forming a classic ABC correction.
Using the Fibonacci retracement tool:
0.5 retracement of the entire move sits at → $0.7534
This aligns perfectly with the previous swing high at $0.746 — a level that has yet to be retested
The 1:1 trend-based Fib extension of a potential ABC correction puts Wave C at → $0.7492
Confluence Check:
This entire support zone (~$0.75) is stacked with technical alignment:
✅ Previous swing high: $0.746
✅ 0.5 Fib retracement: $0.7534
✅ 1:1 extension: $0.7492
✅ Daily 21 EMA: $0.7455
✅ Daily 21 SMA: $0.7347
✅ Point of Control (POC): ~$0.7318
✅ Anchored VWAP: Also sitting in this zone
✅ Pitchfork golden pocket: Aligns as dynamic support
All of these support indicators point to one thing: this ~$0.75 zone is a high-probability long entry area.
🟢 Long Setup
Entry zone: Ladder between $0.77 – $0.75
Average entry: ~$0.76
Stop-loss: Below $0.7318 (under POC)
Target: $0.9212 (0.618 retracement of the recent down wave)
R:R: ~5:1
Potential upside: +22%
🔴 Short Setup (on Rejection Only)
Entry: $0.9212 (0.618 Fib retracement of downtrend)
Stop-loss: Above 0.666 Fib → ~$0.958
Target: previous swing high or yearly open
R:R: ~1.4:1 (it can be adjusted tighter upon confirmation)
This short setup isn’t ideal in terms of R:R unless we see clear rejection. But with confirmation — like an SFP, bearish engulfing, or divergence — the stop can be tightened, making the risk-to-reward much more favourable.
📘 Educational Insight: Why Structure Beats Emotion
In trading, the strongest setups occur where multiple tools converge—Fib levels, EMAs, VWAP, volume zones, and past price action. When these align, it’s not about guessing—it’s about preparing.
The key is to wait for structure to come to you, not the other way around. Patience allows clarity. Clarity allows precision. And precision pays.
💡 Final Thoughts
The plan is clear. Levels are set. Now it’s just observation and discipline.
Good trades don’t chase attention — they present themselves to those who wait.
___________________________________
If you found this helpful, leave a like and comment below! Got requests for the next technical analysis? Let me know.
ADA (Cardano) – Long Swing Setup from Major Support ZoneADA is currently trading within a critical support area ($0.71–$0.73), offering a compelling higher low opportunity. With BTC holding strength, ADA may be gearing up for a rebound, particularly if it maintains structure above the support.
🔹 Entry Zone:
$0.71 – $0.73
🎯 Take Profit Targets:
🥇 $0.80 – $0.84
🥈 $0.98 – $1.02
🛑 Stop Loss:
Daily close below $0.66 (loss of higher low and structural invalidation)

ADA/USDT RECOVERY TIMEADA/USDT RECOVERY TIME
There is good chance that Ada/usdt will return to up 1 USD level

ADA – Is the $1 Support Zone the Next Target?ADA is currently trading within a well established range-bound structure. Here’s the breakdown of this setup:
1. Key Levels to Watch
$1.00
This is the most critical support zone and psychological level.
The Golden Pocket (0.618 Fibonacci retracement) lies perfectly at this level, adding strong confluence for buyers to step in.
Resistance:
Around the 0.786 Fibonacci retracement level (~$1.107), where price could be rejecting. The 0.786 Fibonacci level coincides with the Point of Control (POC) of the trading range.
The anchored VWAP (Volume Weighted Average Price) aligns with this resistance, creating a high-probability short opportunity!
2. Trade Setup: Low-Risk Short Opportunity
Given the confluence of the following:
0.786 Fibonacci level (~$1.107): Resistance zone.
Anchored VWAP: Adding overhead selling pressure.
Order Block & Golden Pocket at $1: Strong support target.
This creates a low-risk short setup:
Entry: Near $1.107
Take-Profit: $1.015
Stop-Loss: Above $1.113 to limit risk exposure.
3. Risk-to-Reward Ratio
Risk: ~1% loss (tight stop above resistance).
Reward: ~8% gain (targeting the $1.00 support).
This gives us an 8:1 risk-to-reward ratio, making it a highly favorable trade setup.
4. Supporting Indicators
Volume Profile: Price has significant volume accumulation near the current range, indicating strong resistance around $1.10-$1.12.
Bearish Structure: Price remains below the anchored vwap (yellow line), indicating bearish momentum.
Conclusion
ADA is showing strong confluence for a potential short opportunity with minimal risk and significant upside reward. A retest of the $1 support is likely, given the combination of the Fibonacci Golden Pocket, order block and anchored VWAP resistance.

ADA/USDT 1H AnalysisADA/USDT 1H Analysis: Bullish Momentum in Play
On the 1-hour time frame, ADA has just broken out of a bullish pennant pattern, and the price is moving upward. However, there are key levels to monitor if you're holding a long position:
Black line: This level represents the Daily Point of Control (POC) and the Weekly Open, making it a critical area to watch for potential resistance.
Pink resistance zone: A significant resistance level where price action may slow or reverse.
If you're currently long, exercise caution as the price approaches these levels. Confirmation of a breakout beyond these zones could signal further upside potential.
Let me know your thoughts and feel free to share your feedback! 👍

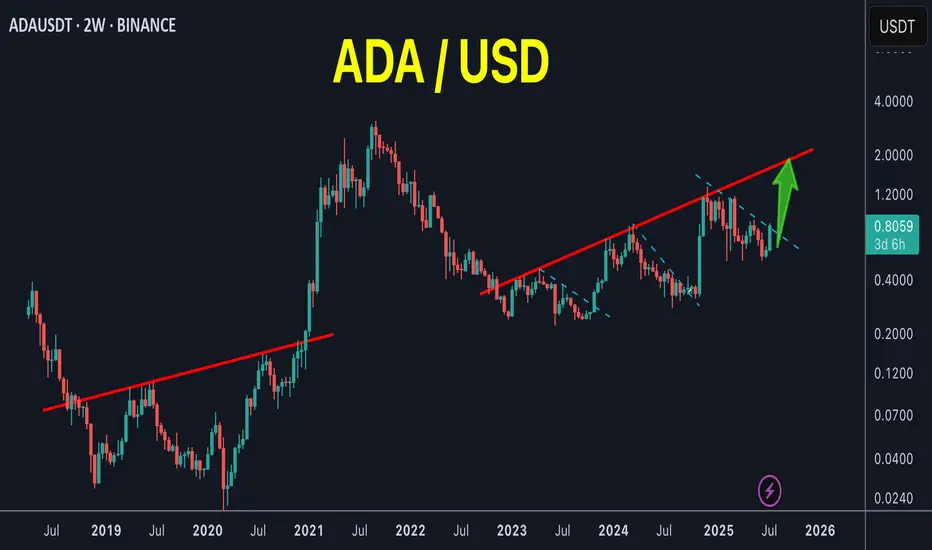
ADA - It will happen, but not yetADA is not ready for lift up but it should happen starting 2025. However, 0.22 should not be broken under any circumstances, otherwise ADA could visit 61.8% at 0.13. The structure looks good for a rounded bottom with the tipically Mount Everest in the middle.

ADA Long Opportunity 30%+ BreakoutADA reaching the end of its falling wedge pattern and overdue for a break out. For weeks we have been downward consolidating and with strength back in the market and Ether setting up for a breakout as well I expect to see ADA breakout to last years highs. In December we touched the 0.67 - 0.68 range and I can see this set up putting us back there. Great Long opportunity if you have waited for an entry point.

ADA Long Opportunity 30%+ BreakoutADA reaching the end of its falling wedge pattern and overdue for a break out. For weeks we have been downward consolidating and with strength back in the market and Ether setting up for a breakout as well I expect to see ADA breakout to last years highs. In December we touched the 0.67 - 0.68 range and I can see this set up putting us back there. Great Long opportunity if you have waited for an entry point.

ADA - CARDANO - in charles we trust ; the neverending story IVADA - CARDANO - in charles we trust ; the neverending story IV
Ok, this ship looks to me to be turning.
its all there on this blessed chart. which i diligently read the tea leaves for you to succeed in this casino.
cardano did 100x+ TWICE. from the same frigin price point in two different cycles. iam pretty sure she goes for a third. does it all play out exactly the same? maybe, prob not, but i bet it will be pretty similar.
key points here;
check that momentum signature at the bottom there. the same shape. same levels basically. maybe we get that second option for another nuke 40% or so but my money (irl) is on that relief bear market pump first. then some black swan to wipe everyone out again and thats when cycle 3 begins.
this will be my last ADA chart for awhile. think ive been over doing it. now we've had some interesting price action it was time to do this last one and sit back and see what happens.
I AM ACCUMULATING
lfg. take me to the promised land charles.

ADA's situation+next targets and expected movements.ADA has created an Inverse head and shoulder pattern which means a great bullish trend is on the Horizon. If the price follows this pattern's expected movement,we shall see it reach 0.7 pretty soon or at least in mid term duration. The expected movement is as much as the measured price movement ( AB=CD ).The break out has occurred . We might even see a correction one more time before ascending further. keep in mind that the next big resistance for ADA will be around 0.7.
_ _ _ _ _ _ _ _ _ _ _ _ _ _ _ _ _ _ _ _ _ _ _ _ _ _ _ _ _ _ _ _ _
🌍Thank you for seeing idea .
Have a nice day and Good luck.

ADA Cardano Possible PathADA is very likely to touch the narrow channel shown in the chart. For this, two path is possible, first, giving up the price and second, wasting our precious time. If you are going to buy and hold ADA, you can buy it in several steps. Do not risk all in current prices. please be aware that the channel can also be breached so watch the reaction carefully.
Notice:
This is just a personal view.

ADA - cardano update ; an alternate bottom theoryADA - cardano update ; an alternate bottom theory
Yellow fractal is the same as the other one but stretched out. The momentum signature fits quite well. Zoom out on the chart to see the momentum similarities.
Would mean the bottom is very close and quite soon. Double tap then up only.
That bigger drop option, the momentum doesn't feel right.
note the chart i did back in december i think it was; attached.
macro is pretty darn bad still, everything is still melting, inflation still high, dxy looks like it wants to pump again, at least double top imo, soooo not sure how a bottom could be close. but maybe huh, the financial world is a big irrational casino right now. anything could happen.
going to keep a close eye on this. imo ada is the perfect 'market signaler'.


ADA to 0.65!ADA is forming bear flag, and it is right below crucial resistance zone (0.42). If ADA breaks 0.42 we might see huge green candles in November.

ADA BUYAda AB=CD Hormonics. The patterns are just for visual. ADA is trending upwards. 5 waves impulse to take out structure. Price retraced into the sponsor of the drive to break structure. I feel we could see another leg up. See chart for target.

ADA can do what ETH did 2015-2018ADA correction looks similar to ETH 2016 correction after a major bull run wave. Afterward, around 70% drop then continue up-trend to high targets.
ADA is one of the coins I prefer to stack over time. Can have high growth in the future.

ADA BIG MOVE COMINGADA is making good support near 0.437 and getting resistance at 0.47. If ADA can break this level then it will go to the 0.5-0.55-0.58 level.
!! BUY & SELL in the chart !!
