ADA - Potential Buy SignalADA quick daily chart update:
ADA is safely above its 50EMA.
ADA is above its 61.8% Fibonacci Retracement Level. ADA needs to close this daily candle above this level.
ADA is above its Volume Point of Control (POC) for this visible range.
ADA is above its Bollinger Bands Middle Band Basis which is a 20 Period SMA.
Overall volume is still relatively low, but looks like we’ll end a 3rd day as green.
The Relative Strength Index (RSI) is indicating momentum is slightly upwards at about 57, with room to move up before ADA gets into the Overbought Zone of the RSI.
The Moving Average Convergence Divergence (MACD) is indicating that the MACD Line (Blue Line) has crossed back over its MACD Base Line at 0.0 which indicates that a 12 Period EMA on the Price Chart has crossed back over and above a 26 Period EMA on the Price chart. This is a very good thing 👍. The MACD Line looks like it may cross back over and above the Signal Line (Red Line) any day now, which, for most traders is a BUY signal. Notice that the Red histogram is getting smaller and has become less RED. Once the MACD Line crosses back over & above the Signal Line, we will then start to see green Histogram bars created.
If the MACD follows through, and the crossover is seen as a buy signal then we may see ADA attempt a potential move to a new All Time High over the next couple of days. Hopefully over the next few weeks, well see ADA attempt another attack at its Pitchfork Median Line 👍
I hope this is helpful with your Trading or Hodl-ing 👍🔥🚀🌍🌔🪐🛸👽
Search in ideas for "ada"

ADA wants to switch the standard channel to the bull channelADA is likely going extremely bullish if BTC retests 38k.
On my view BTC will come back to 38k before a possible dump, orders around 35k on BTC are huge right now.
In the meanwhile ADA will move to the big boys channel (BULL channel in green) if BTC retest 38k. Lets just hope it doesn`t fall into the old channel again.
Next target 0,44
after that pull back to 0,39, and bulls to 0,6
after that pull back to 0,44 and bull to 0,9-1,18
if we stop in 0,9 we are pulling back to 0,6 to come back to 1,18
ADA is seeking 2017 ATH soon, is too stable and everyone is adding to their portfolio with Staking involved (10% yearly of ADA is not bad at all).
My recommendation to ADA investors.
HOLD 50% in Staking
50% in trading (ADA is very predictable and stable to swing trade)
Have a good one, leave ideas and thoughts, and good ADA bull run for everyone.
ALERT: once BTC decides if is going up after touching 38k we can set some scenarios, and possibly selling ADA, otherwise keep your ADA in your pocket.

ADA is coming back with a huge profit!ADA had one of the biggest hype in history. ADA made over 1000 % in one month and owners got a nice profit from ADA. After that ADA started falling down and no one knew when ADA would come back. The comeback of ADA is just happening.
If you trade ADA you never make a mistake because it is one of the greatest coins in the market with a huge potential in the market. The coin is still quite undervalued and that is why you have the best chance to buy this coin and wait and wait and wait because, in a few years, you will make lots of percents. Cardano is home to the Ada cryptocurrency, which can be used to send and receive digital funds. This digital cash represents the future of money, making possible fast, direct transfers that are guaranteed to be secure through the use of cryptography.
ADA will publish their new roadmap in 17 days which will affect the market and will push it higher. ADA will be also added to Cryptopia . According to developers, we will see a lot of great news in the future.
Recently, we could see the highest volume in a day. That means only one thing - someone invested a lot of money to break the trend line and wanted to make uptrend. Indicators show that the uptrend has just started. The profit can be possibly more than 220 % .
Enter:
0.000027 - 0.000028
Sell:
1. 0.000035
2. 0.000048
3. 0.000060
4. 0.000068
5. 0.000082
6. 0.000088
7. 0.000100 (ATH)

ADA Rides Ascending Channel to Key Resistance-ADA rejects off key resistance of $1.45
-25 MA acting as support
-Channel has held price from large breakout
Cardano has started its revival off June lows as price has risen nearly 45%. ADA has been overall a very strong coin as it is still currently up nearly 4000% since lows of last year. $1.00 seems to be a floor for ADA which is near previous ATH of 2018. As long as Cardano can continue rising off this low, this is a great setup for higher prices soon.
While looking at the chart, we can see a clear ascending channel has held the price for the last few weeks. As long as ADA can stay within this range, price revival will continue to previous levels of June. The price recently experienced a rejection at its key resistance of $1.45. This area has shown to be a mark where if broken, ADA prints a large pump. With that being said, price needs to hold major support zone of $1.36-$1.39 to have a shot at breaking it.
Along with the major support zone, ADA has been held up by the 25 MA. Throughout the last month, each time price has tried holding this mark, it has failed. If this continues to hold, ADA may test its key resistance along with a mid term trend line that price has been stuck under for nearly 6 weeks. Once bulls manage to break these two marks, price will be free for a large rise, with a short term uptrend confirmed.
While looking at the Relative Strength Index, we can see a trend line that has been respected for nearly a week and a half. As long as strength can continue to hold this trend, a push past $1.45 Is imminent. The MACD has resorted back to bullish territory and is consolidating for a large move. Once the MA’s produce a bullish cross, the price should react very positively.
ADA intraday levels
Spot rate: $1.425
Trend: Bullish
Volatility: Medium
Support: $1.36
Resistance: $1.45

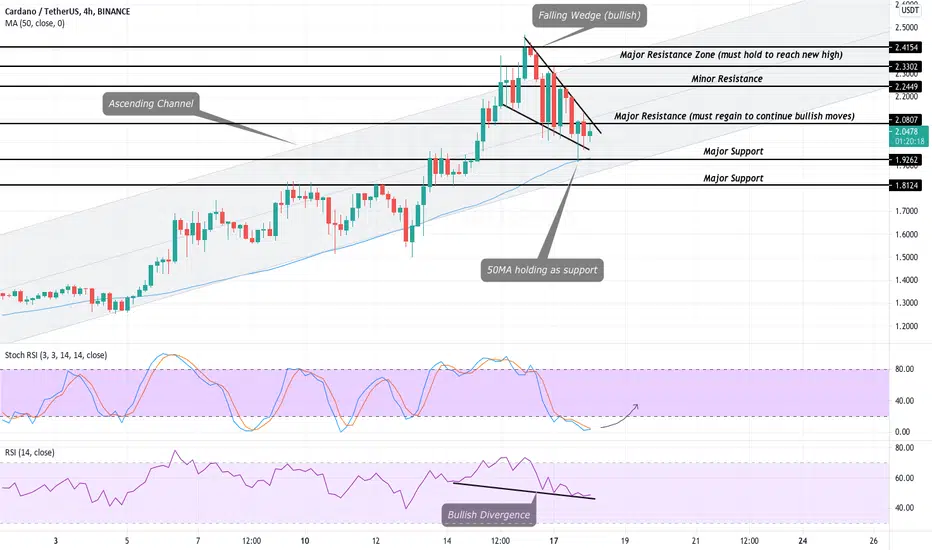
ADA Forms Falling Wedge As Crypto Market Takes a Hit-ADA reaches ATH of $2.45 the last week
-Price has formed a falling wedge pattern
-ADA currently is being held up by the 50 MA
Cardano has had an amazing run the last year as it is up over 100x since its bottom in March. Cardano has been trading within an ascending channel the last few weeks and is superiorly strong.
Strong support for ADA comes in around $1.92. At the time of writing, Cardano has bounced off this level strongly and is attempting to break its major resistance level of $2.08. If ADA fails to break and hold $2.08 it may be on its way to another leg down to the 50MA which has half the price up for a few weeks. If this level fails to hold, expect a larger retracement to $1.80 for ADA.
Cardano has formed a bullish falling wedge the last few days as the cryptocurrency markets fell over 15%. ADA must break above its top trend of the wedge to be considered bullish again. Major resistance of $2.08 must hold for ADA to continue up-trending. The price looks to stay within the ascending channel for more time as it has respected both trends for almost 3 weeks now.
While looking at the Stochastic RSI we can conclude a bullish bounce for ADA is soon to come. Strength has been lying in the oversold region for 2 days and has formed a bullish curved bottom. The regular RSI also confirms this standpoint as an evident bullish divergence has formed.
ADA intraday levels
Spot rate: $2.04
Trend: Bullish
Volatility: High
Support: $1.92
Resistance: $2.08
ADA - The Future Looks BrightADA - quick daily chart update:
ADA is back above its Bollinger Bands Middle Band Basis which is a 20 Period SMA.
ADA is back above its 50EMA.
ADA is back above its 50% Fibonacci Retracement level.
I haven’t added these onto this chart but FYI, ADA is above its Ichimoku Cloud Conversion Line (Tenkan Sen) and Base Line (Kijun Sen). The Ichimoku Cloud Lagging Span (Chikou Span) is indicating momentum is upwards.
ADA has found some resistance from its 61.8% Fibonacci Retracement Level. ADA needs to close a daily candle above this level.
The Chaikin Money Flow (CMF) is indicating Accumulation has increased with the CMF (Green Line) at 0.14.
The Moving Average Conversion Divergence (MACD) is indicating that the MACD Line (Blue Line) might soon cross back over its basis at 0.0, when this happens, it indicates that a 12 period EMA on the price chart has crossed back over a 26 Period EMA on the Price chart, which is a good thing. We may also get a buy signal with the MACD Line crossing back over the Signal Line (Orange Line). Notice how the last 2 Red Histograms have got smaller and less red. Crossing back over the 0.0 Basis will start a new green histogram.
To put things in perspective, very soon, over 5 Million students in Ethiopia will start using the Cardano Blockchain, The most popular dApp on Ethereum according to dap-radar.com has about 617,000 users. Many people have called Cardano a scam, when all the hate and bullsh*t fades away, people will eventually start to realise just how big this Ethiopia Educational deal, as well as the other various other Africa Deals that Cardano has in the pipeline including the Ask Doctor App, are absolutely huge! Cardano is now the most LEGIT blockchain out there, with actual use cases on a Government & GLOBAL SCALE. The longterm future of Cardano ADA is very bright indeed……. And my beloved VeChain VET of course 😜👍
I hope this is helpful with your Trading and Hodl-ing 👍🔥🚀🌍🌔🪐🛸👽

ADA (Cardano). A New Hope!ADA (Cardano)
Why there is a Big Hope?
1. Potential next Coinbase listing smartereum.com
2. Yoroi Wallet (light wallet chrome) Launch. for Android & iOS on develop twitter.com
3. Trezor Hard Wallet Support twitter.com
4. Partnership with HERO Group & Launch Emurgo Indonesia twitter.com
5. Launch Native Library React (Open source). it will help the community, specially developer to build their own projects. twitter.com
6. Nano Ledger S Hard Wallet support (soon) twitter.com
7. ADA integration on Metaps Plus twitter.com
8. Launch ADA Crypto Card on South Korea twitter.com
:)

ADA/USDT Technical Analysis Update: Bullish Breakout Potential &ADA/USDT Technical Analysis: Potential Bullish Breakout in Sight
Cardano (ADA) is currently trading at $0.41, showing a 39% increase from its recent bottom. In this technical analysis, we will discuss the potential for a bullish breakout in ADA/USDT and the target price if it occurs.
White Neck Line Resistance
Left Shoulder, Head, and Right Shoulder Formation
Potential Target Price
Stop Loss
Conclusion
Inverse Head & Shoulder White Neck Line Resistance:
The current price of ADA/USDT is testing the white neck line resistance, which, if broken, could trigger a bullish breakout. Therefore, traders and investors should keep an eye closely on the current price level and monitor the price action closely.
Left Shoulder, Head, and Right Shoulder Formation:
The left shoulder, head, and right shoulder formation is a well-known technical pattern used by traders to identify potential trend reversals. In the case of ADA/USDT, the pattern has already formed perfectly, with the current price level testing the white neck line resistance.
Potential Target Price:
If the breakout occurs, the potential target price for ADA/USDT is $0.73, which is a 76% increase from the breakout level. However, it is important to note that this is not a guaranteed outcome, and the price may fluctuate depending on various factors.
Stop Loss:
To mitigate potential losses, traders should place a stop loss below the neck line support. This will limit the downside risk in case the breakout does not occur or the price reverses.
Conclusion:
In conclusion, the current price level of ADA/USDT is testing the white neck line resistance, and a bullish breakout may occur soon. However, traders and investors should do their own research and analysis before investing in any cryptocurrency. Technical analysis is just one tool that can be used to make informed investment decisions.
Hey, it's CryptoPatel here!
I'm passionate about providing you with the latest insights and analysis on the world of cryptocurrencies.
If you enjoy my content and want to show your support, please like, share, and follow me for more high-quality updates.
Thank you for your support, and let's continue to stay connected for more exciting content!
LIKE
Share
Follow

ADA - quick 1d chart updateADA is trying to close a daily candle back above its Falling Wedge Pattern. If ADA manages to close today's candle above the Falling Wedge Pattern then its next resistance will be found at around the $1.415 - $1.451 resistance area.
ADA is back above its Bollinger Bands Middle Band Basis 20 Period SMA for this 1d timeframe and has successfully re-tested it as support. Note that the Upper and lower bands have a lot of room to expand before becoming over extended on this 1d timeframe.
Note that ADA is still above its Least Squares Moving Average (LSMA) on this 1d timframe.
Note that ADA is still deep in the Bearish Zone of the Ichimoku Cloud and has a long way to go before it attempts to enter the Equilibrium Zone and then back into the Bullish Zone on this 1d timeframe.
Note that ADA is above its VPFR POC for the fixed range of 7x Daily Candles that i have selected.
Note that ADA still has a long way to go before it closes above its VPVR POC for this charts Visible Range.
Note that Volume is still low on this Binance Chart but yesterdays Volume Bar did close slightly above its Volume 20 Period MA.
Looking at the Moving Average Convergence Divergence (MACD), we can see that the MACD Line (Blue Line) is indicating momentum is upwards at the moment and note that it has been above the Signal Line (Orange Line) since the 15th Dec. The MACD Line (Blue Line) is still in the Negative Zone under the 0.0 Base Line so be on the when the MACD Line (Blue Line) crosses back above the 0.0 Base Line into the Positive Zone on this 1d timeframe. Note that the MACD Line (Blue Line) has not been in the Positive Zone sine 17th Sept 2021 on this 1d timeframe.
Be on the lookout for any successful re-test as support of the Upper Descending Trend-line of the Falling Wedge Pattern.
I hope this is helpful with your trading and hodl-ing.

ADA Falls To New Monthly Low As Bears Take Control-ADA has fallen -23% the last 2 weeks
-Price failed to break mid term trend
-MACD has been coiling sideways
Cardano has turned bearish the last 2 weeks after a near 50% revival off June lows were halted quickly at key resistance. The overall cryptocurrency market has lacked a direction the last month which has left many investors wondering what type of market we are currently in. BTC breaking below the $30,000 support level will likely cause a cascade of selling throughout the entire market. Cardano must hold key supports to be saved from a tumble under $1.00.
ADA price has been stuck within a descending channel since Jul 5th. Price has bounced off each trend sharply as the downtrend can’t seem to be broken. At the time of writing, ADA has fallen to its major support of $1.15 forming a slight wick off of it. If ADA bulls fail to create a strong bounce, we will see price under $1.10 very quickly.
For ADA to begin a bullish trend, many marks must be tackled. The first including its major resistance of $1.20-$1.26 which has acted as an important mark the last 6 months. Around this major resistance lies the 25 MA which has held price down for nearly 2 weeks. Bulls must regain this zone & MA to be in position to try a break of its mid term trend line that has been respected for nearly a month. Breaking over all these zones will put ADA in a great position to start a revival to mid $1.50s.
While looking at the RSI, we can see that strength has been consolidating together awaiting a large break to either direction. The MACD has been fairly bearish the last couple weeks as the histogram has continued in a bearish fashion. A break above the 0 line will likely provide the strength needed for Cardano to begin some type of revival.
ADA intraday levels
Spot rate: $1.15
Trend: Bearish
Volatility: High
Support: $1.15
Resistance: $1.20

ADA and an ADX - Also buy some ADA before its too lateADA and an Average Directional Index (ADX DI).
Education:
Look very closely at the entire history of this ADX DI indicator on this ADA daily chart, you can clearly see the relationship between big price movements in either positive and negative direction and the ADX (Yellow Line) which is an indication of the strength of that positive or negative momentum. Note that the ADX (Yellow Line) is just indicating the trend strength or the strength of that positive or negative momentum, it is the +DI (Green Line) and -DI (Red Line) that indicate whether on not the trend or momentum is positive or negative.
If the +DI (Green Line) & the -DI (Red Line) are moving away from each other, and if the +DI (Green Line) is above the -DI (Red Line) then this an indication of increasing positive momentum, and increasing negative momentum if the -DI (Red Line) is above the +DI (Green Line).
If the +DI (Green Line) is above & moving closer to its -DI (Red Line) this is an indication of decreasing positive momentum. and the possibility of a reversal to negative momentum if the +DI (Green Line) crosses below its -DI (Red Line). If the -DI (Red Line) is above & moving closer to its +DI (Green Line) this is an indication of decreasing negative momentum. and the possibility of a reversal to positive momentum if the -DI (Red Line) crosses below its +DI (Green Line).
I have added a 9 period Exponential Moving Average to the ADX. When the ADX (Yellow Line) is ABOVE the 9 Period EMA (White Line) then this indicates increasing trend strength either positive or negative. When the ADX (Yellow Line) is BELOW the 9 Period EMA (White Line) then this indicates decreasing trend strength either positive or negative.
There are many different versions of the ADX indicator on TradingView, from ones that just have the ADX, +DI & -DI lines, histograms, and some with just the ADX line. For many months I was using the ADX DI SMA but have decided to change over to this version ADX DI because the ADX (Yellow Line) is more reactive and accurate compared to the ADX DI SMA version.
So onto this ADA daily chart:
So using this ADA Daily Chart as an example, we can see that the ADX DI Is indicting that there is positive momentum with the +DI (Green Line) at 25.8 above its -DI (Red Line) which is at 10.3. The ADX (Yellow Line) is at 23.3 and ABOVE its 9 Period EMA (White Line) which is at 22.2.
We can clearly see that the ADX (Yellow Line) is above the 20 Threshold, this indicates that the trend on this daily chart is strong at the moment. Notice, that the 9 Period EMA (White Line) has crossed back under the ADX (Yellow Line) indicating increased strength.
At the moment of typing this, the +DI (Green Line) is above its -DI (Red Line) and the ADX (Yellow Line) is above the 20 Threshold and has crossed back above its 9 Period EMA (White Line). This is telling me that if the +DI (Green Line) stays above its -DI (Red Line) then ADA may soon be in for another massive upwards momentum spike where we see the ADX (Yellow Line) shoot up exponentially on the daily chart to possibly the 40-60 range. Looking at the history of the ADX DI indicator on this daily chart, we can say that if the ADX (Yellow Line) goes to the 60 range then we could be looking at around a +250% move upwards, If the ADX (Yellow Line) goes to the 40 range the we could be looking at around a +150% move upwards.
Like all my previous post, this is more of an educational post showing why i like the ADX DI indicator, because it not only shows whether the momentum is positive or negative, but also how strong that positive or negative momentum is.
Also, best to buy some ADA before is too late 👍
I hope this post is helpful with your trading or hodl-ing 🔥🚀🌍🌔🪐🛸👽
NOTES:
ADX (Yellow Line) = Trend Strength
+DI (Green Line) = Positive Momentum
-DI (Red Line) = Negative Momentum
Dashed White Line = Threshold Level set to 20
Extra added:
EMA (White Line) = 9 Period Exponential Moving Average
A closer Look at the ADX DI
Here are some of the Different ADX indicators available on TraidingView. The ADX indicator & the DMI indicator are the default TradingView versions and the others are created by users.

ADA - Should be an interesting week with the Africa ConferenceADA Ichimoku Cloud update:
ADA has just dropped in the Equilibrium Zone of the Ichimoku Cloud on the daily chart .
ADA had found support from its Ichimoku Cloud Leading Span A (Senkou Span A) cloud support but has just dropped under it.
ADA is below its Ichimoku Cloud Conversion Line (Tenkan Sen) and Base Line (Kijun Sen).
The Ichimoku Cloud Lagging Span (Chikou Span) is under the price from 30 Periods and momentum is downwards.
The Chaikin Money Flow (CMF) is indicating that ADA is still in the accumulation zone with the CMF (Green Line) at 0.06.
The Moving Average Convergence Divergence (MACD) is indicating downwards momentum and the MACD Line (Blue Line) has crossed below he Base line at 0.0. We need the MACD Line to cross back over the Base Line at 0.0 and to cross back over the Signal Line (Orange Line)
The idiot announcement from Biden scared American investors to cash out, they obviously didn’t realise that it was a proposal and the senate needs to vote YES on it. This has enabled bears to take some control but its not the end of the bull-market and when the dust settles, the bull market will resume.
This week will be an interesting one for ADA. ADA has the Africa Conference on the 29th April, promising big news of Cardano’s deals and projects not just in Ethiopia, but the whole of the Africa Continent. Yes downwards pressure is pushing the whole crypto market down at the moment, but i have now doubt ADA and many other cryptos have a really bright future and will soon shoot back up, think longterm and don’t get shaken out at a loss.
I hope this is helpful with your trading and hodl-ing 👍
On a side rant:
What i do find quite funny is that BTC is paired with most if not all cryptos, so technically speaking, if the price of BTC goes down, then shouldn’t the price of ALTS go up? Isn’t that how it works with currencies?? This doesn’t seem to be the case with crypto 🤷♂️. So either exchanges are manipulating the price of all cryptos so BTC always stays on top even when going down, maybe because they’ve built there exchanges around BTC like Binance or maybe there is just a co-ordinated sell off and selling pressure, or maybe I’m just talking b*llox 😅.

Ada know what to tell you but I am "Ada" here! Cardanoooooo! 📉Ada know what to tell you but I am "Ada" here! lol Ya so it has recently come to my attention via notifications and Dm's that ADA doesn't want to stay in its little bubble. Well down she goes anyway. There is too much to unpack here but "price go down bro.." This is just one of those not ever down done situations seriously most will likely spend all their time around price and ask questions like "where is this goin?" It's funny because this is like the same stuff you'd find a few years ago on what's hot about ADA!?LOL I know a Coinbase listing would help temporarily for price??? Again why ADA because bro ETH Killer umm sure how about ADA "gohstchain"👻 because its basicity dead.
Pick a time frame pick a shooting star and make a wish. 🌠
(PLEASE stop saying MOON) 🌝lol
As an argument to what I am saying "Ya, something MEGA bullish can "slosh" some cash from some other crypto for another moon shot but at the same time I think that button may perhaps be wearing out."
[b ]"I personally feel that buyers are going to increase their exhaustion buying dumps. Also Minimum Wage Hike hasn't hit fast enough for the little guppies to nibble up all the Whale crumbs.. As things sink down toward the inevitable abyss."
"Noobs please try to understand some people have had bags bigger and longer than you."
(Placer note Emoticon Shoulder Shrug) 🤷♂️ #Fixed
What are your thoughts? Is it bad that people like to realize gains say "Cool! More Dollars now!" Or am I really the only person that's down to pull profit and even short a little??? LOL
-No advice to give just thoughts that I can't shake after the last 6 years in the world of "CRYPTO"
"KEEP CALM AND MANAGE THY RISK!"

ADA - what a stupid bloody name, baby name. Baby growing up 200%ADA, well well well. huge coin that had massive hype towards the start of the year. The general concensus is that this coin is great, has amazing developers and a very very very well thought out and jam packed roadmap. Lots of positive vibes around the coin, but also do take in mind that they don't really have a lot to offer right now other than a mainnet and wallet. They are trying to compete with ethereum as a platform for smart contracts and dApps, in a market that is already filled with competition, there's no guarantees that this coin will succeed, however the roadmap on cardano looks very promising.
Short term - neutral to bearish. Bitcoin looks like its not finished with correcting yet, cryptocurrencies have largely fallen off the normie radar and are taking a break (quick search on google trend trends.google.com) shows that normie interesting is starting to cool off, in preparation for the next bullrun.
long term - bullish
Buy zone: 2 zones - 0.618 fib retracement: 0.00003690 - 0.00004190
- 0.718 fib retracement: 0.00002286 - 0.00002748
Sell zone: Only 2 in mind. I like mid term targets and dont worry about short term goals.
1) 0.00012000 - 0.00012500
2) 0.00017000 - 0.00017500
Me? I'm going to hold onto this for many years to come :)
Fundamentals: ADA just has regular roadmap updates, They don't really offer timeframes as to when they complete stages in their development, but the closest one thus far looks to be the Ouroboros Staking protocol, which would allow ada holders to stake their coins. This would be massive progress for the coin in general and would serve to be a reasonable catalyst to catapult this coin up to the 1st target for 200% profits.
Technicals: ADA has just completed its 1st 5 waves up of a supercycle up and is in a corrective phase right now. Currently riding between the 0.618 to 0.5 retracement levels right now. ADA looks to be forming a 5-3-5 zig zag corrective pattern and in the C wave thereis almost alway 5 subwaves within that. Something i notice about cryptocurrencies is that they do like their extended 5th waves which leads to me to believe that ADA may not be finished correcting yet and may see the 0.718 retracement region which is why I've provided 2 buy zones.
RSI on the daily is approaching the bearish zone of 30 and MACD looks to be curling up ever so slightly. This shows the that ADA is close to finishing its correction but that's definitely not to say that its out of the woods, because it most definitely isn't, there is still room to correct, but the room to correct is running out of space as we speak.
Using a conservative Fib Extension we target a little more than a 1-1 extension for the 1st target, because Elliot wave theory states that the 3rd wave is often the longest but never the shortest and 2nd target is derived from the final elliot wave targeting just a little above the 1.618 region on fib extension.
I'm still learning TA, any advice on improving my analysis would be GREATLY appreciated. I welcome any criticisms and feedback.
So go ahead and grill me :)

ADA Trading Plan, July 16th – 22nd, 2023• ADA is one of the big winners following XRP’s legal victory. The chances of ADA being deemed a security are reduced. The probability of a new bear market low is diminished as well.
• On July 13th and 14th, ADA had a massive price increase of over 30%. Currently, it is retracing to the liquidity pool it left behind.
• The closest support level is the previous range high, at 0.305 USD.
• The closest resistance is at 0.33 USD.
Weekly Bias:
• My weekly bias is bullish. IMO, ADA’s price was suppressed for a long time. It has a solid base between 0.27 – 0.30 USD. I do not think it will go lower than 0.285 USD.
• My preferred scenario is for ADA to fully retrace the liquidity pool, find support on the previous range high, and continue to the upside. Regardless, most of the liquidity pool is already taken. ADA could continue up from this point.
A long trade from the previous range high has a better chance of success (IMO) and a better R: R.
Trade Idea No. 1:
• Entry: 0.33 (S/R flip).
• SL: 0.3169 (Daily low).
• Target: 0.38
• R: R: 1:4
Trade Idea No. 2:
• Entry: 0.305 (S/R flip).
• SL: 0.291 (Demand zone).
• Target: 0.38
• R: R: 1:5
NFA.
What do you think? Please share in the comments.
Best Wishes.

ADA (Cardano) lets take some profit on short for now.#ADA /USD TA Update:
CRYPTOCAP:ADA currently trading at $0.3594
According to Coinlion Trend Trader Indicator, we got en Exit Point Alert for ADA at $0.4 (04/21)
Coinlion Trend Trader Indicator entered short at 0.3864 the 4th of may.
Then takes 2 times Profit :
1) $0.365 (20% exit position)
2) $0.362 (10% exit position)
(6,5% Profit).
There is a strong resistance at the 200EMA. The same which has rejected ADA many times before
But we have broken the descending channel.
Now we have a support on the 200SMA at $0.352 and a liquidity zone support between $0.2986 and $0.30
Cardano can test again the channel which should be a support now aligned with the 200SMA and 50SMA around 0.357
+ we can see that ADA is oversold. The trend might change soon as whales are accumulating a lot ADA.
Lets see what happens and follow the indicator instead of our emotions.
What do you think ?
Please click LIKE button and Appreciate my work.
Coinlion Trend Trader indicator tells me
- When to enter short or long
- When to exit and take profit :-)
- Now CTT comes with the new RSI and Stochastic indicator
IF YOU WANT we can give you the link to our free indicators :
- Stop Loss indicator
- Liquidity Support and Resistance Indicator
- Buy and Sell signal
- Automatic Fibonacci Levels with Higher and Lower Lows
Thank you.

ADA/USDT Sell ADA/USDT Sell .Take the opportunity for short
Like For More Ideas About ADA/USDT.
ADA/USDT Sell .Take the opportunity for short
Like For More Ideas About ADA/USDT.
ADA/USDT Sell .Take the opportunity for short
Like For More Ideas About ADA/USDT.

ADA - BULLISH ENGULFING DAILYADA - Just a quick update on ADA guys. So the Daily candle is a Bullish Engulfing candle which suggests ADA will attempt a 3rd time to break free from this resistance.
I think the rest of the market being so bullish and BTC setting NEW ATH today helped keep ADA away from the 2.00 area FOR NOW!
It's important to see what happens here soon and if ADA can at least break this resistance.
If it does id say there's a good chance for a little relief rally maybe to the $2.40 area before a small pullback and then continuation to the upside!
SO MAYBE, WE MIGHT NOT SEE THOSE LOWER TARGETS OF $2.00 - $1.90
I DO BELIEVE WE WILL GET A BETTER IDEA VERY SOON AS TO WHERE THIS IS GOING!
This IDEA is more relevant for TRADERS or people opening a LONG with high leverage who don't want to get liquidated. IF you're not day trading or opening a long with leverage then this IDEA is kind of IRRELAVENT BECAUSE MY PREDICTION FOR ADA IN THE NEXT 3 MONTHS IS VERY BULLISH and I think you'll be just fine whether you buy here or lower IT DOESN'T MATTER MUCH.
IF your using LEVERAGE then YES IT DOES MATTER WHERE YOU BUY IN and it is IMPORTANT TO MAKE SURE YOU'RE NEAR THE BOTTOM!
Without leverage, IF YOU WANT TO BUY AND HOLD FOR A FEW MONTHS I THINK THERE IS NOTHING WRONG WITH THAT FROM THIS POSITION .
** OF COURSE THESE ARE JUST MY IDEAS BASED OFF OF MY EXPERIENCE. ALWAYS DO YOUR OWN RESEARCH BEFORE INVESTING***

ADA - That was a long SqueezeADA quick update:
So the long Bollinger Bands Squeeze ended as an upwards breakout…… Was there ever any doubt??? Nah 😜.
The Ichimoku Cloud Conversion Line (Tenkan Sen) is indicating Short-term momentum is upwards.
The Ichimoku Cloud Lagging Span (Chikou Span) is indicating momentum is sharply upwards.
Overall volume is increasing and its looks like this will be a 4th daily candle to close green.
The ADX DI SMA is indicating strong upwards trend with the ADX (Yellow Line) at 35.2 and above its 10 Period SMA which is at 29.3. The +DI (Green Line) is at 22.6 and the -DI (Red Line) is at 6.8. Note that the +DI and -DI are moving away from each other.
If we look at the Chaikin Money Flow (CMF), the CMF (Green Line) is at 0.02 & has crossed back over the ADL (Dashed White Line) out of the Distribution Zone & into the Accumulation Zone. A very key thing to look out for is increased upwards momentum from the CMF Line in the accumulation zone.
ADA has found resistance at its 0.786 Trend Base Fib Extension Level, ADA needs to close a daily candle above this level and turn it into strong support.
ADA needs to eventually close a daily candle above its Pitchfork Median Line.
ADA is still looking absolutely fantastic for the longterm. Hopefully the big Ethiopian deals will be announced soon. You'll also be happy to know that poor old Billy is very chuffed that the long ADA Bollinger Bands squeeze has come to an end 😆.
I hope this is helpful. Good luck 👍🚀🌍🌔🪐🛸👽

ADA ROADMAP Update - Possible 50% moveADA/Cardano will be releasing their new updated roadmap on the 4th of December 2018 or Tomorrow. Nouvive Intelligence states that this usually coincides with a increased in market sentiment and awareness within the community.
What does the Charts say?
Bullish
On the higher time frames, accumulation appears to have spiked since ADA has found their bottom at 4 cents.
MACD for the first time since September has flashed to a BUY signal. The last time this happened on the daily, we saw a 40.71% pump.
On the lower time frames, there appears to be a volume gap at just below the 200MA and the previous resistance seen on the 29th November - a 15% increase.
A 40% increase too can be seen based on the fundamental driver and the need to fill the volume gap at just above 5 cents.
RSI Stochastic on the lower time frames appear to be OVERSOLD and signally buy entries.
Bearish
RSI stochastic on the Daily illustrates that there is a dump to come, however this seems unlikely as ADA has seen a close to 100% retracement since the top.
Fundamentally, if the situation is not clarified with IOHK as to the future of ADA - we may see a further downtrend.
Nouvive Says for traders:
An entry point is available at current levels, especially as on the lower time frames, ADA appears to be in a bullish triangle pennant where the top is $0.0432, a breakout of that level will see the volume gap at $0.046 filled for a 15% gain over a 3 day period.
Nouvive says for Investors
Ane entry point is available at current levels for a 50% gain following ADA's breakout of the bullish triangle pennant to go above the 200MA on the lower time frames and see the previous resistance at $0.061 last seen in the middle of November.

ADA next coinbase listing!ADA is one of the 3 of the 5 coins left to be released on coinbase according to coinbase announcement in july 2018 . Coinbase stated ZRX, BAT, Zcash, ADA, and XLM would be the next coins to be listed . With ZRX AND BAT out of the way that leaves these 3 left Zcash, ADA, and XLM. Its anyone guess which coin it will be. 1 huge upside to ADA is its currently 7 cents USD with its being the cheapest coin on coinbase i could see serious volume move it unpredicted psychological levels. ADA is accumulating slowly but surely over time making the path of least resistance less and less downward over time. In my opinion i dont see ADA dropping below 1k satoshis every again so getting in at 1100 in my opinion is a good level to get in.

ADA - Next Trade Setups to WatchADA’s been stuck in this sideways grind for a while, and the volume’s basically ghosting us. So, where’s it at, and where’s the next move? Let’s dig in.
ADA’s sitting at $0.6615 right now, trading below the yearly open at $0.8451 and the range’s sweet spot, the POC, at $0.7325. That tells me it’s leaning a bit bearish, but not exactly screaming panic, more like it’s just chilling in this 57 day range. It tapped the monthly open at $0.6328 recently, bounced a little, but without volume showing up, it’s like nobody’s ready to commit yet.
Key Levels
Resistance Zones (Short Opportunities)
1.) Range POC: $0.7325, this is the most traded price within the 57 day range, acting as a magnet for price. A rejection here could signal a short setup.
2.) Yearly Open ($0.8451): a psychological and structural level that could cap upside if momentum remains weak. Trading below this level keeps the yearly bias bearish. A break above with volume would flip the narrative.
Support Zones (Long Opportunities)
1.) Monthly Open: $0.6328, already saw a little bounce here with that swing failure move, perfect setup for a long trade if you were quick on the draw.
2.) Yearly Open 2024 + 21 Monthly EMA: $0.594 - $0.5928, strong confluence with the prior yearly open and a key moving average. This zone aligns closely with the swing low at $0.5801, forming a robust support cluster between $0.5801 - $0.594.
3.) 21 SMA: $0.53, a deeper support level if the above zone fails. This would indicate a more significant breakdown, but it’s a potential accumulation area for longer-term traders.
Market Structure Analysis
Bearish Bias Above Swing Low: Trading below the yearly open and POC suggests sellers are in control unless price reclaims $0.7325 with conviction.
Range-Bound Behaviour: The 57 day range indicates consolidation. Volume is the missing catalyst, watch for a spike to confirm direction.
Swing Low as Key Pivot: The $0.5801 level is critical. A hold here maintains the range; a break below shifts focus to $0.53 and signals capitulation.
High-Probability Trade Setups
Long Setups
1.) Long Setup #1 at Swing Low ($0.5801 - $0.594 Zone)
Entry Trigger: Look for a swing failure pattern (SFP) where price dips below $0.5801, reclaims it, and shows rejection of lower prices (e.g., a bullish candle with a wick below).
Stop Loss (SL): Place just below the swing low
Take Profit (TP): $0.70 (near-term resistance)
Stretch Target: $0.8451 (yearly open), though this requires stronger momentum.
Confirmation: Higher-than-average volume on the reclaim + bullish price action (e.g., engulfing candle).
2.) Long Setup #2: $0.4735 Sniper Entry
Entry Trigger: If ADA takes a bigger tumble, $0.4735 is your sniper’s nest, think of it as catching the knife with style. Could be a wick that snaps back.
This is a deeper, high-reward play. Price has to fall by a lot from here, but if it hits, the R:R is amazing, and it’s below most traders radar. Patience is the name of the game.
Short Setup
At POC ($0.7325) or Yearly Open ($0.8451)
Strategic Outlook
Current Stance: If not in a trade, the $0.5801 level is the highest-probability long setup due to confluence and R:R. The SFP at $0.6328 today was a missed opportunity, but a deeper pullback sets up an even better entry.
Breakout Watch: A decisive close above $0.7325 (POC) with volume shifts focus to $0.8451. Conversely, a break below $0.5801 targets $0.53.
Patience is Key: Low volume suggests waiting for a clear catalyst (e.g., news, BTC move) to drive ADA out of this range.
Wrapping It Up
The $0.5801 swing low long with SL below and TP at $0.7 - $0.8451 is the standout trade right now—low risk, high reward, and backed by confluence. Monitor volume closely, as it’s the linchpin for any breakout or reversal. If ADA holds this support and volume picks up, the retest of $0.8451 becomes plausible.
If you found this helpful, please leave a like and a comment. Happy trading!

ADA have high potential✅to grow.ADA is consolidating at it`s bottom despite other altcoins. Let`s look how other ALTs pump: GMT +89%, SOL +64%, TRX +52%.
Additionally, you can see how buyers for the 5 time accumulate ADA which is strong bullish signal. The volume bars is always grow when ADA reach the bottom.
If we combine that cardano is still at it`s bottom and whales accumulate it, we can expect nice upcoming pumps and you don`t need to miss it.
📊Where to open a long if ADA already break up the channel:
🔥you can open a trade at the channel test as support how it shown on the chart or wait for massive pullback but it has low possibility in current market conditions
🔥volume growth
🔥bullish BTC help reach the targets for ADA much faster
📊The targets are the closest value areas:
1️⃣ $0.55-0.59
2️⃣ $0.62-0.65
Traders, what at additional preconditions do you use to open a long? Share you thoughts with us in the comments!
💻Friends, press the "like"👍 button, write comments and share with your friends - it will be the best THANK YOU.
P.S. Personally, I open an entry if the price shows it according to my strategy.
Always do your analysis before making a trade.
