MACD candleMACD (Moving Average Convergence Divergence): This indicator can help confirm trends and momentum that are indicated by your EMAs and candlestick patterns. It provides signals through its MACD line, signal line, and histogram.
Your strategy combines several elements: dynamic support and resistance levels, EMAs, a 3+ candlestick pattern, engulfing candles, and RSI. Given this multifaceted approach, you might want to consider an indicator that complements and enhances these signals. Here are a few indicators that
Search in ideas for "macd"

MACD Signal for Long in NFLX with MA50MACD line crosses over signal line below base line (around -10) indicating possible reversion of downfall price that breaks MA50 upwards with separation of MACD and signal lines, possible entry in long and indicating strong momentum, which in times loses some strength, but never touches MA50, until it breaks downward with a previous MACD/signal line crossover at around 12.5, suggesting closing the position.

macd first red histo in dailymacd first red histo in daily
after a long trem being green, finally wa saw first red histogram macd in daily time frame

$SPY Daily Chart MACD Crosswhoa whoa whoa ! a daily MACD cross recently ???? Let's see if we continue down !!

Prataap snacks Ltd - MACD CROSSOVER 📊 Script: DIAMONDYD (PRATAAP SNACKS LIMITED)
📊 Nifty50 Stock: NO
📊 Sectoral Index: NIFTY FMCG
📊 Sector: Fast Moving Consumer Goods
📊 Industry: Packaged Foods
DAILY TIMEFRAME
Key highlights: 💡⚡
📈 Script is trading at upper band of Bollinger Bands (BB) and giving breakout of it.
📈 MACD is giving crossover.
📈 Double Moving Averages also giving crossover.
📈 Script is moving towards its resistance level which is 908.
📈 Current RSI is around 76.
📈 One can go for Swing Trade.
⏱️ C.M.P 📑💰- 869
🟢 Target 🎯🏆 - 908 , 1000
⚠️ Stoploss ☠️🚫 - 799
⚠️ Important: Always maintain your Risk & Reward Ratio.
⚠️ Purely technical based pick.
✅Like and follow to never miss a new idea!✅
Disclaimer: I am not SEBI Registered Advisor. My posts are purely for training and educational purposes.
Eat🍜 Sleep😴 TradingView📈 Repeat🔁
Happy learning with trading. Cheers!🥂

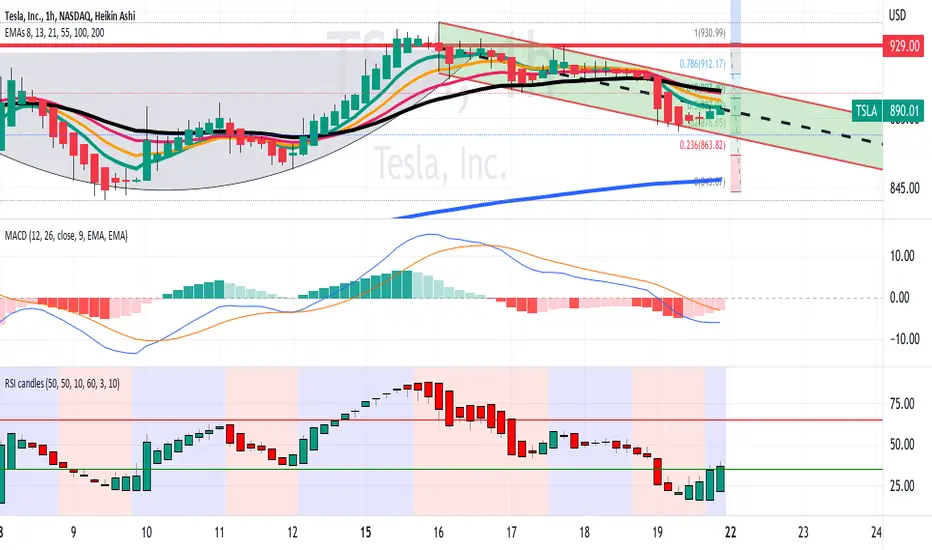
TSLA Early BULL Signal on RSI / MACDNASDAQ:TSLA
On the 1H timeframe chart, TSLA is showing an early reversal as follows:
(1) It is ascending in a downtrend parallel channel
(2) On the MACD, the signal line is below the histogram, and
the K & D lines are converging on this lagging indicator.
The histogram bars are decreasing in negative height.
(3) the color-coded RSI candle indicator shows bullish engulfing
strength candles.
All in all, I see technical signs of a reversal as described here
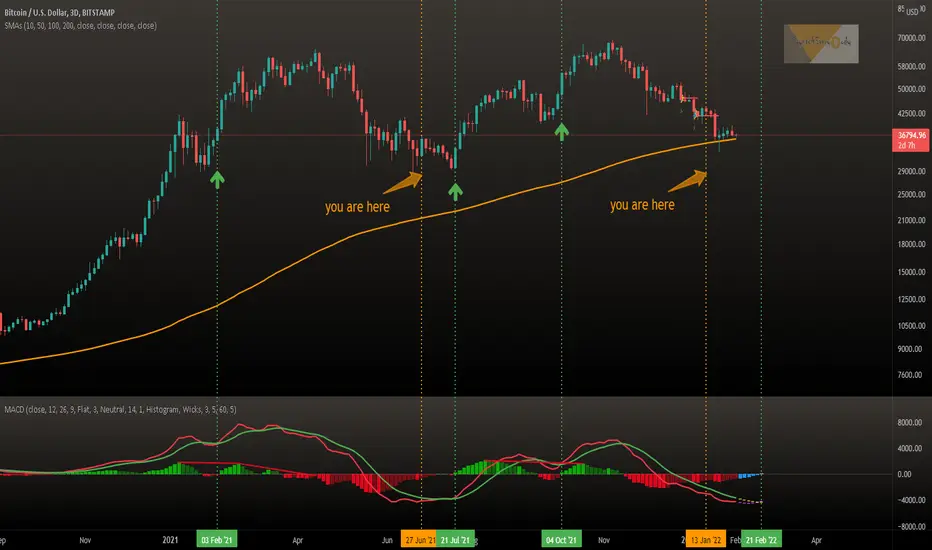
MACD buy signal for 3-day Bitcoin now end of FebruaryMACD buy signal for 3-day Bitcoin now end of February
Bitcoin breakout included?
The slow but powerful MACD Indicator on the 3-day chart is hinting it.
What do you think? 😎
Drop me a nice comment if you'd like me to analyze any other cryptocurrency.
*not financial advice
do your own research before investing
ETHUSD - When to Start Selling? (Monthly 3MA, RSI & MACD)This is not financial advice blah blah blah and happy new year to all.
Observations from the Monthly ETHUSD Chart
+ The MACD histogram has been stuttering since the first time ETH hit around $2,500; the main drive was from $70~$2,500 it would seem.
+ The MACD 12MA (blue) has already flattened so maybe the tide is turning.
+ The RSI-based MA has flattened suggesting upward momentum has slowed down.
+ The RSI has been making lower highs and lower lows since around $2,500 suggesting slowing momentum.
+ If history is anything to go by, starting to sell when the monthly RSI makes a higher low after the peak seems a good idea.
+ The 3MA (applied due to quarterly logic?) seems to also show long term local or whole market cycle tops.
Any comments or thoughts, please share below in the comments.
Cheers.

Bitcoin In timeframe 2H by Macdthis strategy can run on bitcoin in timeframe of 2H.
By Macd You Can Long or Short Trading in Bitcoin

Bitcoin MACD signalsPossible Bitcoin Movement based off MACD trend, this could be the massive reversal here. Option 2 it blows through to a new high...

CROSSING! 2-YEAR BEAR MACDWe have a MACD crossing on the monthly time frame. After two-years of bear we move into the bull. I'm looking to hold until 2022.
Looking to take profits over the $3.00 range.
Who know?
Good luck.
*Not financial advice*

BTC Weekly RSI / MACD AnalysisAnalysis of BTC price using RSI and MACD indicators showing weakending strength since the start of the year. Bearish divergence has plauged BTC for several months how much will the influence BTC price in the coming week during the current pull back

BTC Weekly Analysis using RSI and MACDA K.I.S.S. (Keep It Simple Stupid) approach the Bitcoin weekly analysis using MACD and RSI indicators

Head & Shoulders, MACD reversing on all time frames upwardsGot that head & shoulders, as well MACD is heading upwards on all time frames. Today would be a make or break, but the Fed isn't going to raise interest rates for a while. I could see it heading up to 800 - 900 resistance area, however will want to consider how Volkswagen can impact sentiment on Tesla. I just swing trade so looking for around a 30% gain in the next month or so, watching tech though because that can cause worse performance.

Long SNOW finally? MACD heading upStrong day for SNOW and other tech stocks today, could be the start of a good run, MACD heading up outside of oversold.


Long to $200, MACD ReversalLooks like it's repeating what it did at $130, MACD & RSI crossing up. It's getting volume and could lead to $200 in about a month. What do you think?

BTCUSDT and " Hidden Divergence on MACD "Hi Dear traders, nice to meet you.
"Like" is a huge force for me.
By "following" you can always get new information quickly.
Thank you for always supporting me.
.............................................................................
In my opinion, this is Hidden Divergence on MACD
It has a good position for the uptrend.
We have to see what happens in the coming days.
Happy Trading and Stay Awesome!

LONG NEXO - BULLISH MACD CROSSOVER UPTRENDING TRADING RANGELONG NEXO - BULLISH MACD CROSSOVER UPTRENDING TRADING RANGE

LPG, MACD Histogram just turned positiveThis is a Bullish indicator signaling LPG's price could rise from here. Traders may explore going long the stock or buying call options. Tickeron A.I. dvisor identified 51 similar cases where LPG's MACD histogram became positive, and 42 of them led to successful outcomes. Odds of Success: 82%.

like me. MACD have to pass throughIf old support MACD become resistance, say 'Bye Bye' to my money.
Btw if you think i'm a kind of artist, you can still like it.
Otherwise, like it o/
Thanks, god will bless you so much.

CERS MA MACD Histogram just turned positiveThis is a Bullish indicator signaling CERS's price could rise from here. Traders may explore going long the stock or buying call options. I identified 41 similar cases where CERS's MACD histogram became positive, and 34 of them led to successful outcomes. Odds of Success: 83%.

FCPO - MACD Bullish Crossover Light Up More RecoveryFCPO
Trend: Tech rebound
Rst: 2,920
Spp: 2,752
4H chart has new candle broke through middle BB with MACD bullish crossover. Likelihood to surge towards MA50 or 2,920 is there.
