ORDER FLOW ENTRY @DISTRIBUTION Order Flow Entry @Distribution
Day Time Frame : Pending Order Flow Mitigation
15m : recent unmitigated OF will mitigate then continue to move BEARISH until D unmitigated OF
Search in ideas for "order flow"

Order Flow will get you to the next level in tradingOrder Flow Bell ,it is the point where we have confirmation of candles sticks patterns but no the actual order flow


SPY Order Flow Analysis - More Pain AheadOrder flow analysis can be our ally via the right interpretation of realized market orders. In this example, we can observe a failed bullish structure followed by sellers re-taking control of the downside in a push characterized by increasing velocity and magnitude vs the previous failed buying cycle, all well depicted via the OFA script.
A 100% projection target from the last bracketed area suggests an ultimate target of circa 365, which perfectly aligns with the previous trend lows.
Remember the two key main features of this indicator:
Magnitude: A major clue that will help determine the health of a trend is the type of progress by the dominant side in control of the trend. We need to ask the following question: Are the new legs in the active buy-sell side campaign as identified by the script increasing or decreasing in magnitude?
Velocity: When it comes to the distance the price moves, the magnitude is only ½ the equation. The other ½ has to do with the velocity of the move or the speed. Was the new leg created after a fast and impulsive move? Or did price make a new low or high with the movement being sluggish, compressive and taking too long to form? A good rule of thumb is to count the number of candles it took to achieve a new leg.

Order Flow Analysis via USD/JPY - Perfect Entry at Macro SupportSimplicity in trading via the OFA is a thing of beauty. The tool allows you to decipher market intentions. The proper reading of order flow can provide information advantage as in the case of this recent long trade in USD/JPY off a weekly support area. Notice in this example how sellers were running out of gas as plotted via the down legs (both in amplitude and velocity of the move), further vindicated by the breakout of structure higher, which saw an extension in price amplitude. The rest is history.
U

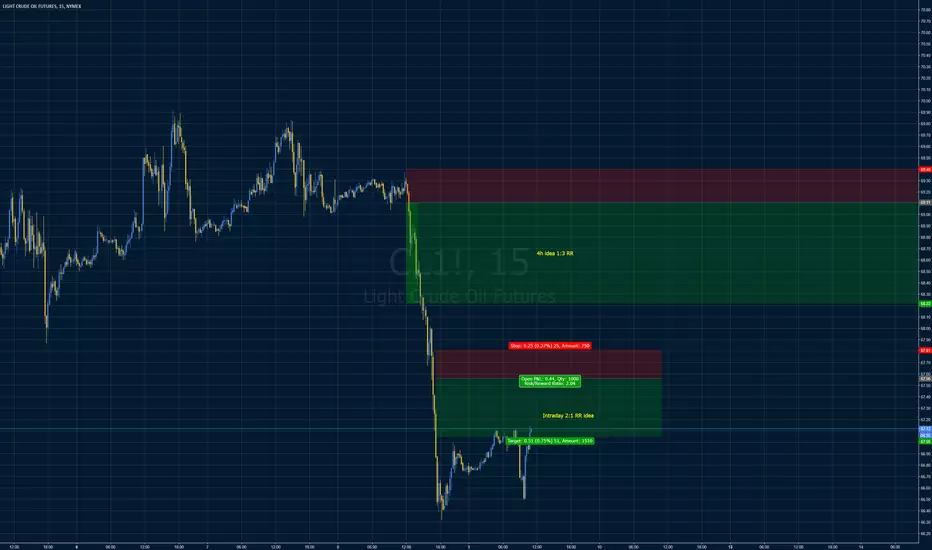
Order flowThe daily chart has the characteristics of a volatility contraction approach, price has now invalidated the contraction and we’re up for a volatile move.
4h timeframe shows that the bullish three drives were in accordance with the bullish order flow. This breakout made a small retest to the daily order block and fell to the demand zone, with this current candlestick it looks more like price respects the area and we should be ready for a full pullback to the order block.
Now it’s clear that the bearish move has lost its momentum, the immediate target is the order block then we go long with this potential and long bearish move the liquidity area at 87.047…


Order Flow Tutorial - What A Dissolved Order Wall Looks In this video I show you what a dissolved order wall looks like on an order flow heat map.

order flowfollow the order flow to the down side if confirmed with another entry on the supply, of course my buy order didnt get picjked up so now lets go down on it yet with confirmation, target is possible at every demand yet dont be agressive on taking profit as we are in the side of sellers dominating


XAUUSD - order flow is still heavily downOrder flow for Gold is still heavily down but expecting price to touch this M30 Jump Shot OB before seeking some bullish confirmation for an entry. Just watching it so far

CADJPY ORDER FLOW SHORTS- Order flow on Daily is bearish until the block
- you can anticipate a retracement trade to my POII
- If not we can see price trade up to the daily zone and fall to the down side possiblely
These are just trade idea, trade at your own risk :)

EURAUD BEARISH ORDER FLOWOrder flow on EA's bearish. I want to see price rally into OTE 79.0 fib level to continue the bearish move.


Order Flow Short TradeDownward momentum low risk trade as supply exceeds demand.
Sell Limit at 1.31259 -> 1.30798

Order flow 4H B opportunity(Paper)Reason to believe there is a buy opportunity since there is upward momentum and possibly breakthrough upwards for a long trade

Order flow 4H B limitThere is a short time frame for Buying based on high demand eating supply
B 1.5193/1.51289 - 4H

AJ source based analysis. Order flow showing intent to price.order flow expectation according to price is a retest of lows
we can only listen to what price can tell us
look to enter short in zone here with target lows
follow my ideas to learn how to trade using source based analysis

ORDER FLOW-SETUP #EURAUD SHORT- // 200+ PIPS UP FOR GRABS//Hi all,
Potential trade setting up on EUR/AUD this coming week.
Additional information:
USD is weakening in strength (AUD and XAU is in anti-correlation with USD) and the USD INDEX is hitting major resistance which translates into great indications for a stronger AUD and a weaker USD, especially against a weak EUR.
We can also see that the order flow is going towards AUD.
- However EUR is expected to gain in strength but AUD will still be stronger so this trade is looking good.
- Pullback is for selling.
Correlating pairs: AUD/CHF (GBP/AUD).
See chart for more details.
www.tradingwhales.com

BTCUSD - Outright Bearish Order FlowBITSTAMP:BTCUSD on the 8h chart (session by session flows) is going though a period of sellers' controlled price action until proven otherwise. The OFA script clearly depicts this bearish picture by having printed an acceleration in both the velocity and the magnitude of the newly formed down-cycle. Typically, when this type of bearish wave unfolds, it carries heightened risk of follow through.
To negate this transition into a bear environment, there must be a counter cyclical move that starts creating a shift in order flow. The OFA script as usual will act as out north-star and clearly communicate that when that occurs (tip: the circles and diamonds offer early clues!). Until that transpires, do not fight the bearish-established setting in BTC.
Remember the two key main features of this indicator:
Magnitude: A major clue that will help determine the health of a trend is the type of progress by the dominant side in control of the trend. We need to ask the following question: Are the new legs in the active buy-sell side campaign as identified by the script increasing or decreasing in magnitude?
Velocity: When it comes to the distance the price moves, the magnitude is only ½ the equation. The other ½ has to do with the velocity of the move or the speed. Was the new leg created after a fast and impulsive move? Or did price make a new low or high with the movement being sluggish, compressive and taking too long to form? A good rule of thumb is to count the number of candles it took to achieve a new leg.

GBPUSD - The Art Of Ripping Apart Order FlowIn this video, I’ll be ripping apart FX:GBPUSD via my publicly available OFA script .
For this analysis, I’ll be looking at both the daily and the 8h, which details the action from a session by session standpoint.
When it comes to unpacking the daily order flow, the OFA script has been signaling to stay bear and bear only since last sept…
Ever since, there has not been one single instance in which the script turned bullish…
What this implies is that this market, on lower timeframes, has and continues to be one characterized by looking for short setups, which as I’ll show once we go down the 8h, signals have flourished and prospered.
The script analyzes order flow based on fractal structure breaks. Every time there is a fractal breakout in the opposite direction of the dominant side in control, a new leg ( bullish or bearish ) forms.
This script comes with the added value of displaying the velocity and the magnitude of each leg/cycle. The script reads the aggregated flow. The proper reading of order flow provides information advantage.
GShort

EURUSD: Bearish Institutional Order Flow & Sell PotentialGreetings Traders!
Current Market Analysis:
At the moment, EURUSD is trading in deep premium prices, and the smaller timeframes have already started to shift into bearish institutional order flow. Given these conditions, we are looking for premium arrays to short the market into discount areas where we can book our profits.
Key Observations:
Premium Prices: Currently, EURUSD is in deep premium prices, making it an opportune moment to seek shorting opportunities into discount areas.
Bearish Institutional Order Flow: The shift into bearish institutional order flow on smaller timeframes signals a strong downward momentum.
Premium Arrays : Multiple premium arrays are aligned on the chart, indicating areas where the market is likely to respect and initiate new selling. These areas include:
Order Block: Anticipated as a level where new selling will occur.
Breaker Block: Expected to act as an institutional resistance level, where smart money mitigates buy orders and reinstates new selling orders.
FVG and Liquidity Void: Inefficiencies in these areas present fair value for smart money to short against.
Trading Strategy:
Focus on Confluence: The alignment of these premium arrays provides strong confluence, suggesting a continuation of the market's downward movement.
Target Levels: Our primary target is the H1 discount sell stops, where we will look to book our profits.
Conclusion:
By understanding the current bearish institutional order flow and leveraging the aligned premium arrays, we can effectively anticipate and execute short trades on EURUSD. The confluence provided by the order block, breaker block, FVG, and liquidity void supports a bearish outlook, guiding our strategy towards taking advantage of short opportunities in the market.
Happy Trading,
The_Architect
