KAYU: Strong Bullish Ichimoku; GC Stochastic; Bullish MACDKAYU: Strong Bullish Ichimoku; GC Stochastic (%K = 45.38); Bullish MACD (MACD Level = 3.71);
Search in ideas for "stochastic"

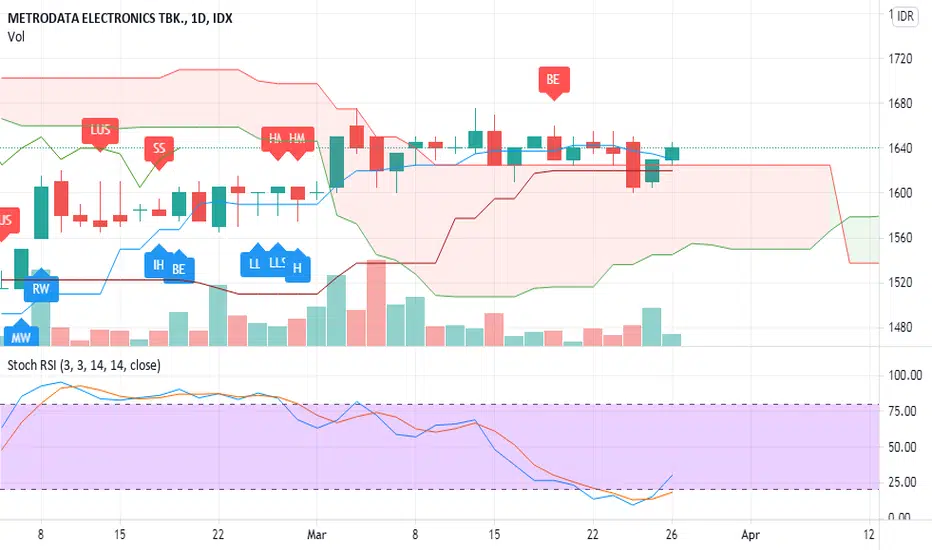
MTDL: Strong Bullish Ichimoku; GC Stochastic; Bearish MACDMTDL: Strong Bullish Ichimoku; GC Stochastic (%K = 30.23); Bearish MACD (MACD Level = 10.51);
XRP monthly Stochastic RSI bullish cross about to happen!!To predict the future, we need to look into the past. The chart is the XRP/BTC pairing. In the past, when we have an Stoch RSI cross on the MONTHLY, whales/bots/elites sell their bitcoin to buy HEAVY amounts of XRP.
This means that once we have a cross, XRP will skyrocket into all time highs (Most cryptocurrencies will be breaking their ATH following bitcoin).
We are also at a historic low on the RSI, meaning we are heavily oversold!
I am not a fan of XRP, and will be planning to sell it back it to Ethereum. But the charts don't lie. I'm here to make some huge profit, and XRP is about to make history!!
Exchanges are about to add XRP back. Do your research ;)
"Markets are a device for transferring money from the impatient to the patient. - Warren Buffet
"Be fearful when others are greedy and greedy when others are fearful." - Warren Buffet.
Check out my XRP/USD chart below (the monthly chart crossed!):

TOYS: Strong Bearish Ichimoku; Bearish Stochastic; Bearish MACDTOYS: Strong Bearish Ichimoku; Bearish Stochastic (%K = 31.35); Bearish MACD (MACD Level = -28.99);
Sebentar lagi puasa dan lebaran, disaat itulah mainan anak-anak akan banyak pembeli.

LTC - Bullish Ascending Channel w/Stochastic RSI Cross !?An Ascending Channel indicates a bullish trend with the support line connecting consecutive higher lows and the resistance line connecting consecutive higher highs.
In a bull market, every dip is a buying opportunity. Not financial advice, but if we follow the past trends, we can see a $3000 Litecoin this year with a MAJOR correction and consolidation to the downside once hitting the resistance trend line again and maybe breaking it..!
We are also about to have a Bullish Stochastic RSI Cross on the weekly! Volume is also increasing!
Litecoin is by far one the safest investment (other than Bitcoin/Ethereum ) that has the opportunity to be BIG in the coming years ahead. We haven't seen nothing yet!
Altseason is coming. The best time to move BTC into altcoins is NOW! (due to BTC dominance looks heavily bearish next month!). Once all the "shitcoins" had the massive altseason run, I will be moving 50% profits into Ethereum , and stake it for long term investment. Other 50% will be use for Lambos and properties ;)
Good Luck!
"Be fearful when others are greedy, and greedy when others are fearful." - Warren Buffet

MTWI: Strong Bullish Ichimoku; GC Stochastic; Bullish MACDMTWI: Strong Bullish Ichimoku; GC Stochastic (%K = 38.46); Bullish MACD (MACD Level = 7.21);
CAKK: Strong Bullish Ichimoku; GC Stochastic; Bullish MACDCAKK: Strong Bullish Ichimoku; GC Stochastic (%K = 40.67); Bullish MACD (MACD Level = 2.33);

SMDR: Strong Bullish Ichimoku; GC Stochastic; Bullish MACDSMDR: Strong Bullish Ichimoku; GC Stochastic (%K = 26.60); Bullish MACD (MACD Level = 6.90);

SRSN: Strong Bullish Ichimoku; Bullish Stochastic; GC MACDSRSN: Strong Bullish Ichimoku; Bullish Stochastic (%K = 47.85); GC MACD (MACD Level = 0.55);

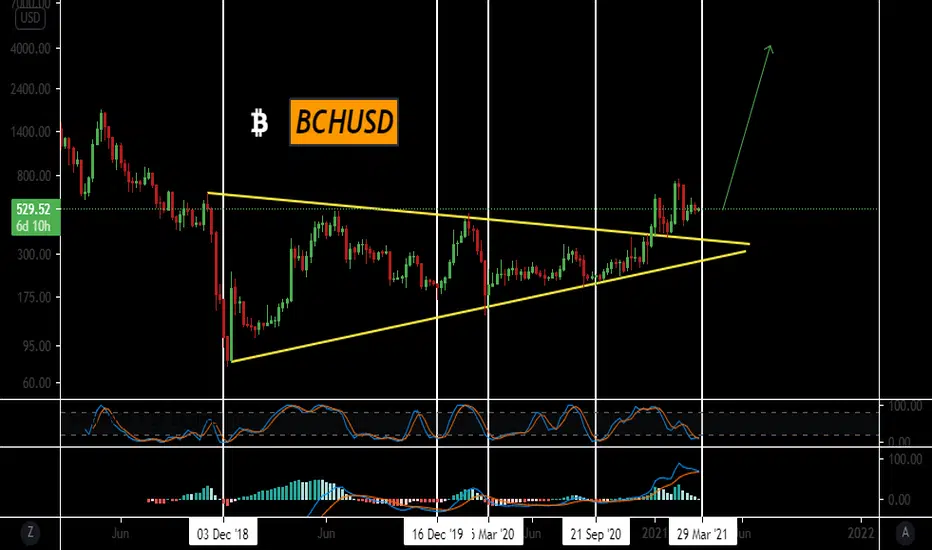
BCHUSD -> Weekly Stochastic -> Ready to EXPLODE!Bitcoin Cash weekly Stochastic is oversold, showing that the coin is ready to explode. Last times it happened, the coin made massive bullish movements up. But now it is different, now it broke a huge symmetric triangle up and accumulates above it! Good times coming for BCH!
XRP - monthly BULLISH CROSS on the Stochastic RSI!! When the Stochastic RSI has a Bullish cross on the weekly, XRP rose between 2200% - 10,000% quickly! Expect to see the same results in the near future. To predict the future, we must look into the past trends.
Trade with confidence and with indicators to mitigate risk. This market is going to be MASSIVE. Be prepared for huge moves, but in the end, only people with no emotions will win this game. 90% will lose.
I am not a fan of XRP, and will be planning to start selling it to move it to Ethereum. But the charts don't lie. I'm here to make some huge profit, and XRP is about to make history!!
Exchanges are about to add XRP back. Do your research ;)
"Markets are a device for transferring money from the impatient to the patient. - Warren Buffet
"Be fearful when others are greedy and greedy when others are fearful." - Warren Buffet.

Ethereum - WEEKLY BULLISH CROSS on the Stochastic RSI!When the Stochastic RSI has a Bullish cross on the weekly, Ethereum rose between 150% - 8200% quickly! Expect to see the same results in the near future. To predict the future, we must look into the past trends.
Trade with confidence and with indicators to mitigate risk. This market is going to be MASSIVE. Be prepared for huge moves, but in the end, only people with no emotions will win this game. 90% will lose.
"Markets are a device for transferring money from the impatient to the patient. - Warren Buffet
"Be fearful when others are greedy and greedy when others are fearful." - Warren Buffet.

AUDUSD Weekly Chart Stochastic Bearish DivergenceAUDUSD Weekly Chart showing a Bearish Divergence on the Stochastic Oscillator (14,3,3).
Fibonacci retracement of move from March 2020 low to February 2021 high provides a take profit target of 0.74161 at the 23.6% level for this swing trade.
10 yr bond yields moving up in the US relative to significantly lower rates in most other developed countries is bullish for the US Dollar. Large issuance of US Treasury debt needed to fund $2.2 Trillion Fiscal Stimulus is bearish for bonds (bullish for bond yields).
Federal Reserve announcement this morning, Friday, March 19th, that they will be letting Supplementary Leverage Ratio exemption expire on March 31st, led to an immediate move upward move in rates on the 10 year treasury bond as banks may be forced to sell treasuries; a bullish move in the dollar was also seen on Friday coinciding with the move upward in 10 yr interest rates.
Tight stop loss is set 11 pips above the daily high for Friday, March 19th.
Carry on the short is slightly net positive at 0.0475 pips with my broker.
Entry @ 0.77484
Stop Loss @ 0.77830
Take Profit @ 0.74161

Continuous Trade Modeling --- Stochastic Error Adjusted ForecastBitcoin follows a non-linear pattern. Linear chart analysis, like FIB, not applicable to such an unpredictable asset. Consider a determinist Bayes-Theorum approach of analysis, adjusted with a non-linear Stochastic error term.

The downtrend is coming, not yet!Last week's macroeconomic announcements created support at the price level of 1.1870, which is the lower limit of the downtrend channel. So, from a technical analysis point of view this was almost to be expected. Then looking at the indications of the Stochastic it seems that the upward movement still has a lot of room for development because the index has just come out of the oversold level.
In the case that the downtrend that has been created is valid, and it is not a downward corrective move of the main upward trend, a rise of prices up to the resistance point of 1.2070, so that prices cover almost the entire range of the downtrend channel, it is very likely to be verified.
In the case, now, that the movement within the downward channel is a correction, the point 1.2070 and the possibility of its breaking is the first indication for the future upward movement.

A surprise, very erect looking candle hath appeared? What next?!This is a stochastic surprise this morning! Is this a moon Friday? Let's see! I have 44 call options contracts with a strike price of $5 so it would be awesome if it went in that direction! Anyways, this is an odd looking candle and could be a breakout! This children's educations stock has a lot going for it! Value ESG investing but hella volatile and profitable...
Not investment advice.

EUR/GBP - BULLISH RSI/STOCHASTIC DIVERGENCE | OVERSOLD REVERSAL
EUR/GBP broke a major support level during the start of 2021
As a result, a massive sell of spewed over the course of Q1 2021
Stochastic and RSI is showing heavy divergence on the daily and given the oversold conditions of the market a reversal may be pending
A long position has been executed with 2 targets:
Target 1 - initial major support level
Target 2 - 61.8% fibonacci resistance

BTC At the support of wedge and stochastic is oversoldOn 4hour chart, the pricline is at the support of falling wedge and there is also 200 SMA support. The stochastic is also oversold.

Btc D1 seem to hidden divide with stochastic Btc D1 seem to hidden divide with stochastic
New bottom are higher than old one.
LONG NOW!


BTC/USD : BB & Stochastic RSI, Bullish cross BITSTAMP:BTCUSD
Hello everyone 😃
BTC had a Bullish crossover on BB and Stochastic RSI.
Also BTC has formed a top flat triangle...
Now we expect a pump till triangle resistance or BB's Higher !
Attention: this isn't financial advice we are just trying to help people on their own vision.
Have a good day!
@Helical_Trades

GME getting traction in the 4 hour Stochastic RSINYSE:GME
GME is finally getting some traction in the 4 hour Stochastic RSI

HMSP Long bull Slow Stochastic and gap ENDisclaimer On, personal opinion not financial advice.
Thing to consider:
- HSMP just close below gap, then making some bull run
- There is upper gap that can be considered
- Slow Stochastic(24,15,10) show that we're now at deep oversold
- Bull Inside bar just created today
Trade plan:
- make entry around Fibonacci 0.236 (1395)
- Cut loss below 0.236 Fibonacci
- TP at couple target 1480, 1555, 1630. because there will be some resistance area.
- it's a good sign when tomorrow candle close above the EMA21
