EURCHF Stochastic trending upStochastic helps to determine the strength of continuation in the trend according to marketkolor.com. EURCHF Stochastic lines have recently developed an uptrend. This implies that price action is constantly gaining momentum. Look for further confirmation of upside in price. Look to enter a long around the 1.055 level. For more insight visit marketkolor.com
Search in ideas for "stochastic"

Watch stochastic K below DStochastic helps to determine the strength of continuation in the trend. The Stochastic %K line has crossed the %D line downwards for EURGBP according to marketkolor.com. This suggests that price action to the upside is slowing down. Look for a consolidation and reversal in the price action to the downside as momentum slows. Still play the short term long before setting up for the bigger short!

stochastic divergencewhen there is a divergence between stochastic and price action we can expect a significant pop in price action. This is one effective way to use indicators. don't let these pretentious idiots tell you that indicators have no place in trading. just test your shit and if it work, use it. higher high in PA, lower high in stochastic is the divergence...the pop will follow

Stochastic Lane Divergence: Long Bitcoin BTCUSDBitcoin BTCUSD is looking like it is setting up for a lane divergence on the 2 hour time frame. A lane divergence is where the price makes a lower low but the stochastic is making a lower high. This is one of the best reversal set up out there. On a two hour time frame this could potential lead to $1000 change in bitcoin price. This is one of the best long set ups we have seen in a few days. We also have the channel bottom that took place and a great reversal candle being set up. We are oversold on the fast and slow stochastic

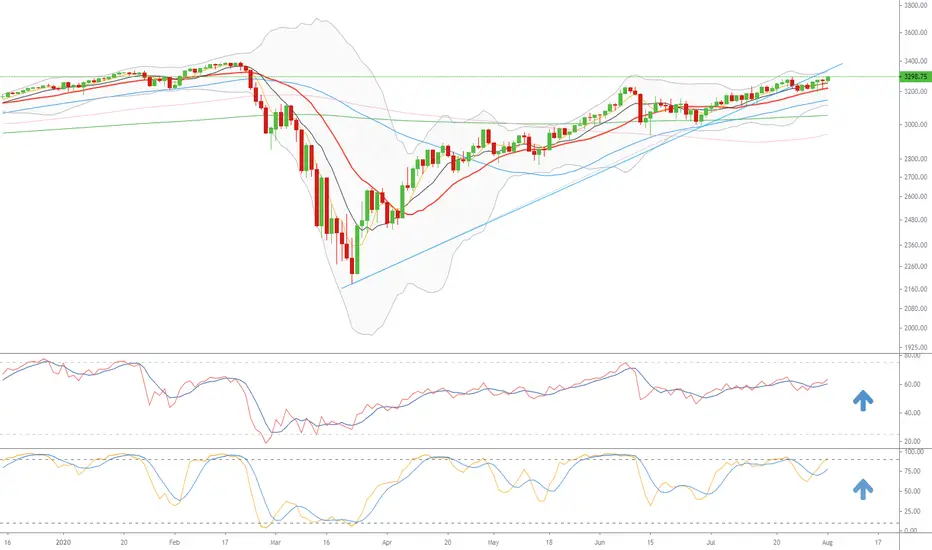
Stochastic and linear regression suggests bearish moveThe price action has recently opened above the +2 standard deviation, but bears brought the price action back below. The stochastic has indicated overbought conditions, implying a downward correction.
The price action is currently moving in the downward direction and the crossover of the stochastic and the exit from the overbought zone indicate further losses.
The price action should tend towards the regression line in the middle and short orders should wait for the price action to pass below the +1 standard deviation for further confirmation of a downward move.

Stochastic DonchianWhen the Stochastic overlaid on the price chart is going down AND the price closes below the middle line of the Donchian Channel AND the bottom Stochastic breaks below the 70.0 line, sell down. Remember ALL THREE have to be in place in order to take the trade, IF ANY ONE of the three conditions fails to maintain their direction, close the trade even if there is a loss. Reverse for long trades.

$PROMPT’s Stochastic Oversold at $0.299 – Bounce Incoming?Stochastic oscillator on the 1H chart shows $PROMPT at $0.299 in oversold territory (below 20). A potential short-term bounce to $0.31 is possible if buying volume picks up. Watch $0.29 support.

Stochastic Resets, PEPE and SOL leadBTC and many ALTs have reset their Stochastic RSIs and their SRSIs and CMFs are turning up. Look to PEPE and SOL to be first movers as their SRSIs and CMFs have already broken the trend and are signaling a move higher.
Layer in that ETH held up during the morning dumb and is leading BTC higher and we may be in the making of the coming ALT season.
ETH has continually bounced from its buy zone (bars in green) and the double-top may already have played out (see measured move to 3k).
Is it time? Only God knows, but the charts are starting to look promising.

Stochastic RSI cross shows bullish potential coming up nextAs we can see on the stochastic RSI on the 2 week timeframe we are crossing to the upside.
The bullrun will continue in October and November.

*Stochastic and Bollinger Bands - CorrelationsThe Stochastic Oscillator and Bollinger Bands can be used as 2 boxes on your trading checklist. Understanding how both move independently, knowing correlating moves and using them as a check and balance.

STOCHASTIC RSI is heading below the 80 level 📉BTCs monthly STOCHASTIC RSI is heading below the 80 level 📉
And it must hold this level for BTC to continue bullish structure.
Will it hold? 🧐

Stochastic Divergence and Walton Family Selling A classic divergence on the daily stochastic mixed with insider selling ($4.5 billion) equals a possible local top. That it. That's the thesis. Keep it simple.
Using Jan 25 Puts @ $61.67 for $4.25 a contract. This is very cheap. A run of the mill 10% correction yields a 100% gain at expiration. Hopefully much more If the divergence plays out and this is a local top!

Stochastic DivergenceWe have an uptrend. Price has made a higher high but Stochastic couldn't make, so we have a regular bearish divergence and price will probably go down!


Stochastic set to 60 is working great as an indicator for XRP.Hello fellow traders, and HODLers. Lately I've been using the standard stochastic set to 60, and as you can see above that coupled with the proper trend-line is working very well lately as a 'tip-off' indicator. It looks like XRP could get even more interesting to watch in the coming weeks. Don't get shaken out of your positions early! Good luck!


Stochastic Divergence On VoxThe price action formed on 12th/13th April 2021 is turning out to be a real demand area, where the professionals were most probably buying into the sell off.
The recent Stochastic divergence as price revisited that demand zone has proven itself to be a decent signal for those willing to get long.
The moving averages are now acting as the roadblocks and a close this week above the daily 50 exponential moving average (ema) will be a catalyst for more retail buying up to the 200 ema.

Stochastic Bearish Divergence1. 4H TF - Price is at resistance
2. 1H TF - Stochastic oversold pointing down
2. 15m TF - Bearish Divergence
Are this enough confluence to open a short position?

SMRA (week stochastic swing trading)stochastic indicated an uptrend in the next 3 weeks. It's hard to believe if SMRA can reach 1000.
It has never happened before, calculating relevant month from Nov 2020 to Mar 2021
Buy 800 is hard so
Buy any 800s ranges of 810, 820, 830, 840
TP1: 900 (as common as 850)
TP2: 950 (if u are patient)
TP3: 1000 (low chance)
If March crash happens, by 400. it always go back to 800 like last April 2020 to 400s and to 800 by end of November
so lets say, it crashed in March. You wait until April 2021 to get in 450 confirmed trade or lower for long term, then sell by Nov or Dec 2021.
Potential huge crash from b117 might dipping from march to april. We can know from 2x ARB, usually leads to 7x ARB.
Noone buys at ARB, unless you want to take a risk
feel free to disagree or review. I never lose playing SMRA. This is a good property company, come to their city, See for yourself


daily stochasticstochastic moves slow on a daily time frame. rsi moves faster. i always check both indicators on all time frames thru weekly to get a sense of direction. market wont pull back significantly until these indicators top.
stochastic analysis 1H goldso I use stochastic because it can be found on other platform or app
because of high volatility remember to use SL
because black arrow (at chart and stoch)
indicate that the price will break up soon, I will focus on bullish trend
here is 3 signal of the trend
PLEASE BE CAREFULL 1612 would be good REJECTION TO CONTINUE THE BEARISH TREND
I cannot predict the bearish trend so please use SL
monitoring 1595 rejection (down trend to 1569
monitoring 1569 rejection up trend to 1612
monitoring 1612 resistance and 1624 resistance (must wait and see , then create new analysist at this point)

Acadia: Stochastic Oscillator UpturnStochastic Oscillator shows upturn for Acadia. Ichimoku Cloud support is very important in this case since today's session is not breaking it and could demonstrate positive trend force.
Please note that biotech companies present high uncertainty.
Disclosure: My articles contain statements and projections based on assumptions on capital markets, and therefore inherently subject to numerous risks and uncertainties.
Before buying or selling any stock you should do your own research and reach your own conclusion or consult a financial advisor. Investing includes risks, including loss of principal.
I am not a financial advisor
