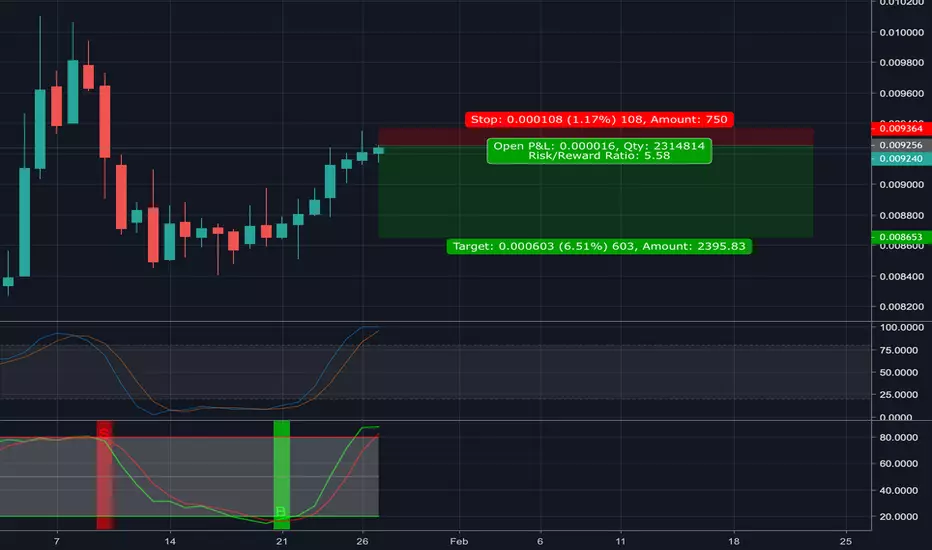
Stochastic RSI 12 ema 24 ema and 128 day moving averageI'm now interested to see if box b turns out and opposite of box A if Stochastic stays above the red line I will remain in BTC, if it should drop through the red line, I will most likely be short again to find D , this would most likely be a fast move and a large wick.
Search in ideas for "stochastic"

Short position on USDCHFStochastic bearish divergence is showing a clear reversal on the current bullish trend. There is an an ascending triangle clearly showing and the price will very probably hit the 0.98500 mark, supported by the bullish trend line, by march 19th before it rises again to the level above 1.00416.

Stochastic RSI TOPLooking good for a short here. Shooting star plus top of the stochastic rsi on the daily. Looking at support about 6% below current price.

Stochastic Lowest Value Since 2013Based on the daily stochastic indicator, we see that today is lowest since 2013. Maybe expect of reversal soon.

Stochastic looking good to go for a 170$ resistance breaktroughSo after going down the stochastic has crossed for an upward trend and is coming out from under 20 line. Good sign is price didn't go down a lot. So, it seems it could be the sign we waiting for the next push that breaks the 170$ resistance. Will keep an eye on it

Watching stochastic to predict next pump to break 170$ resistancStochastic seems heading down the 80 line, it will be important to watch the price evolution in the next hours and see if a new cross returning happens in the indicator. It may lead to break the 170$ and head quickly towards 200$ as next support.

AUDUSD stochastic completely oversoldstochastic shows that the market condition are in completely oversold condition in uptrend market trending.

Stochastic divergence at trend line crossingCOTV is showing steep stochastic divergence on both the (9,3) and (14,3) oscillators. It has been following a downward channel support line and is about to cross another established trend line. When you find this crossing pattern in the trend lines it can be a very powerful signal. If the price continues up, I expect a quick movement towards into the target area. The upper target can possibly be expanded to 40.10 or even 41.49.
Buy: 35.40
Stop: 34.20
Target: 37.00 - 38.71 (4.52% - 9.35%)
This setup immediately made me think of MO , which took off immediately and was featured in this week's watchlist . Can't wait to see how it plays out.
A big thanks to @NJgolfer on StockTwits .

Stochastic Divergence TL BounceGIS has moved down a parallel channel to trend line support. The stochastic divergence is signaling a move back up that should happen at the end of this consolidation period.
Buy: 52.00
Stop: 51.00 (Trend Line)
Target: 53.22 - 54.97 (2.35% - 5.71%)

Stochastic Divergence Channel Line BounceKellogg slight stochastic divergence in a falling channel. Looking for the bounce and possible move up out of the channel.
Buy: 63.25
Stop: 62.30
Target: 64.57 - 66.98 (2.08% - 5.90%)

Falling wedge with stochastic divergenceStochastic divergence nearing the breakout point of a falling wedge.
Buy: 14.25
Stop: 13.90
Target: 15.74 - 16.92

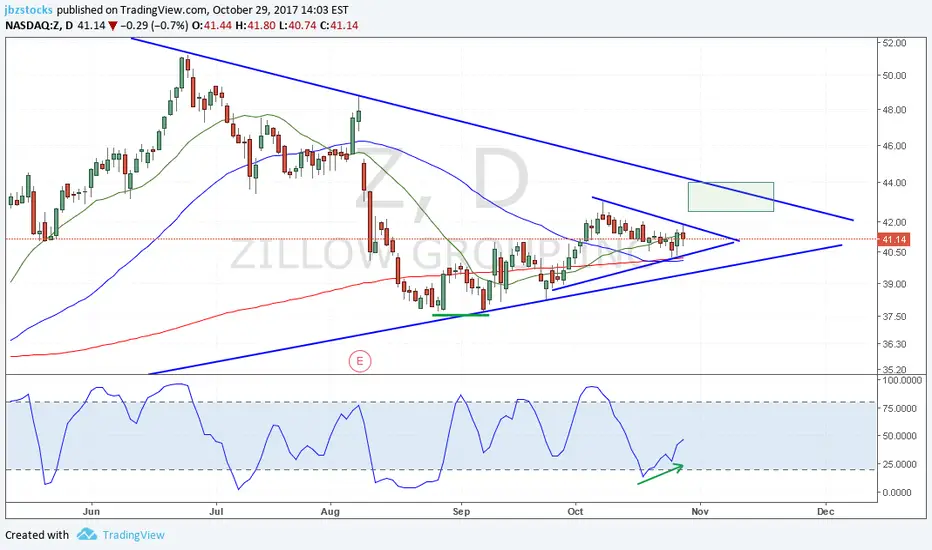
Stochastic divergence pennant breakoutZ is ready to breakout of a pennant pattern inside a larger symmetrical triangle. The stochastic divergence signals the continuation of momentum and should drive the price up to the target zone and possibly beyond.
Buy: 41.50
Target: 42.50 - 44.00 (2.41% - 6.02%)
Stochastic Divergence In Gold 15mins ChartPrice move higher however stochastic value is dropping. Opportunity to short with Stop Loss above 1228.4


Stochastic is magicalJust follow the momentum here, but beware this might last for few days, as long as the stochastic make consistent "UP and Down" pattern.

Looks like a good bounceStochastic confirms by crossing below 80, good RR for my plan, placing stop at previous swing low... thoughts?

Breakout above trendline on daily chartStochastic oversold, then price rallies to break through the top of the channel with ease, wonder how long this will last... thoughts?

EURGBP buying opportunities. 4 hour 1 Hour charts show signs of reversal, so since all the over buying and 50 and 20 ema touching price shows thaat price is recovering and will will go back up. The stochastic is also showing bullish momentum.

AUDNZD long termI started building long positions in this pair and will wait the follwing week to see how it reacts. My favorite indicator for bottoms (stochastic) has already crossed the signal on the weekly interval and the daily is going now the same way. The last low hit right into the 1,27 fib extension of the swing, signaling a possible bottom. This could be the start of a new long upside trend that may last for weeks.

KORS-160411-STO/DMK-G1W-SHORTNYSE:KORS has a fast and strong recuperation over some weeks of downtrend, but this provocate a overload, the future are not clear from a technical perspective, meaby can develop a big ascending wedge or simply continue to the abyss, but for the next weeks is clearly the stochastic indicate a turn down, the Demarker are overload and the price action show a turndown. The price is reacting about the 78.6 of fibo but is early to determine.
Speculative Frame Set: SHORT
Open from: 52.297
Target 1: 46.7

Short term short trade on EUR/GBPUsing divergence , Stochastic bearish this time, a temporary short position has lined up on the 4 hour time frame on EUR/GBP. Price has given an inside bar below resistance and the 1.618 Fibonacci extension level . Targets may be placed at previous support where price could go to.

Pull back on the DOW after a trend reversalAfter today's bearish engulfing bar close below the marked resistance area on the chart a pull back is imminent on the DOW Industrials daily time frame. Stochastic and RSI convergence, and recent trending price action structure show the increased likelihood of bullish momentum to ensue after a suggestive pull back.
