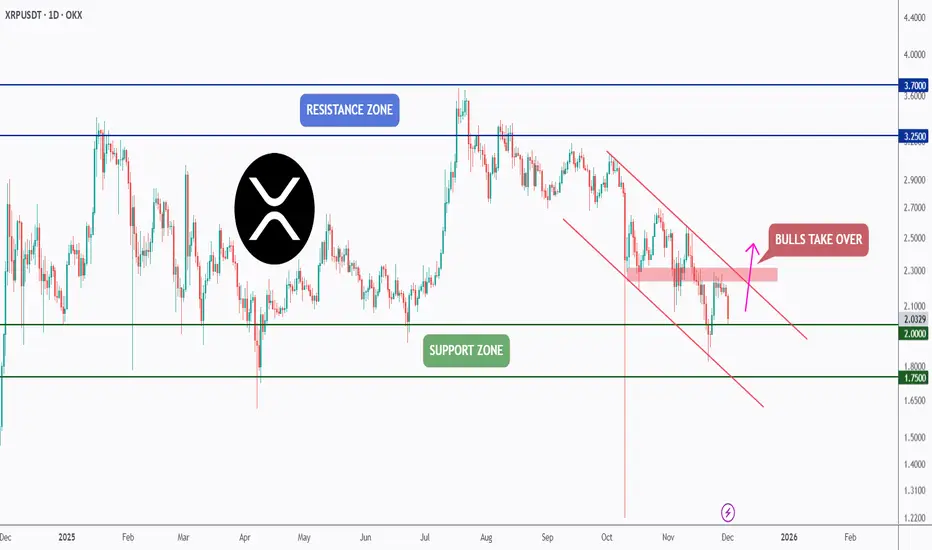
XRP - Decision Time at Support!XRP is currently retesting a strong support zone, and this is where things usually get interesting.
After the sharp impulse higher, price slipped into a falling wedge, which is a typical corrective structure rather than pure weakness.
For now, sellers still have short-term control, but they are losing momentum as we grind into support.
The key for the bulls is simple 🔑
👉 A clean break above the falling wedge.
That breakout would signal that the correction is done and that buyers are ready to step back in, opening the door for a bullish continuation from this base.
📈 Bulls take over above the wedge.
📉 Failure to break keeps XRP corrective.
⚠️ Disclaimer: This is not financial advice. Always do your own research and manage risk properly.
📚 Stick to your trading plan regarding entries, risk, and management.
Good luck! 🍀
All Strategies Are Good; If Managed Properly!
~Richard Nasr
SEC

XRP has been BEARISH since JULY 24th 2025! IT STILL IS!
Back in July 2025, when XRP was at all time highs, nobody could see that XRP was in a Veraxis zone to the downside.
Price was screaming bearish whilst price was allegedly bullish. To back up my call, i added a note on Tradingview notes, dated 24th July 2025 to make an embedded receipt of this prediction. My note said:
"XRP must go down to AT LEAST $1.50 and potentially to 0.50c, as we are now in a HEAVY sell."
Roll on October 10th 2025, the so called "Crypto Crash" zoomed price to 0.77c, which shocked the crypto space. To me, this was just the beginning.
The black arrows on my chart annotate on the days i wrote the notes.
THIS MOVE IS NOT OVER.
As price progressed, many Veraxis zones to the downside were created and were respected, however the most recent one printed 10th November 2025 , and on 17th December 2025 i embedded another receipt/note to say:
"XRP will now continue its journey down to AT LEAST 0.50c, with potential to go down to 0.38c. Resistance may have to be hit first at $2.36 - $2.60 before it happens."
And as you can see from the annotated arrows, price retraced EXACTLY to that price 19 days later. The journey is now continuing down.
For context. When a Veraxis zone prints, price 9 times out of 10 MUST return back to it. I call the price of 0.50c - 0.38c as this is an untouched Veraxis zone.
One caveat as it's price over everything: Price is currently in a Veraxis zone to the upside which is contradictory to my prediction of lower prices, and price 'could' move up from here.
However, my back testing has trumped this move up in my opinion, as the Veraxis zone at 0.50c below current price, must be touched FIRST. If price does indeed spike up from this current Veraxis zone of $2.05, then i will temporarily adapt to price, but with always the expectation that 0.50c MUST be then touched in future.
SAFE MY PEOPLE!
(This analysis is built on the Veraxis framework — a methodology shaped from first principles and refined through extensive independent research. Veraxis, derived from Latin for “The True Pivot Point,” reflects a unique approach to market structure that isn’t sourced from external strategies or conventional teachings. It represents my own interpretation of how price truly pivots, reacts, and reveals intent.
As always, this is not financial advice. Trade safely, stay disciplined, and let the data speak.
)

XRP - Waiting for the Market to Confirm the Next Move!XRP is currently sitting at a key area of interest.
Price is holding around a strong demand zone, right on top of the $2.00 round number. That combination alone is enough to grab attention, especially after the recent impulsive move higher.
For now, this area is where buyers are expected to defend. That’s why my focus is on buy setups, not chasing price.
That said, I’m not jumping in blindly.
The last major high marked in green is the line in the sand. A clean break and hold above that level would confirm that bulls are taking control, and that’s when I’d look for entries with more confidence.
⚠️ Disclaimer: This is not financial advice. Always do your own research and manage risk properly.
📚 Stick to your trading plan regarding entries, risk, and management.
Good luck! 🍀
All Strategies Are Good; If Managed Properly!
~Richard Nasr

XRP - From Support to Momentum Shift!Let’s break this one down step by step.
On the left chart, (Weekly chart) XRP just rejected a very strong weekly support zone around $1.75 – $1.90. This level has been rejected multiple times in the past, and once again, buyers stepped in!
Now shifting to the right chart , (Daily chart) this is where things get interesting.
After months of downside pressure, momentum officially flipped from bearish to bullish. XRP managed to:
• Break above the falling red channel
• Take out the last major daily high marked in blue
That’s a classic sign of a momentum shift, not just a random bounce.
At the moment, price is correcting, which is healthy after such a move.
As long as this correction remains controlled, my focus is simple:
I’ll be looking for longs, targeting the supply zone marked in green above.
If structure continues to hold, dips are no longer something to fear... they’re something to watch closely.
Is this the start of a larger XRP rotation… or just the first step? 🤔
⚠️ Disclaimer: This is not financial advice. Always do your own research and manage risk properly.
📚 Stick to your trading plan regarding entries, risk, and management.
Good luck! 🍀
All Strategies Are Good; If Managed Properly!
~Richard Nasr

XRP - A Make-or-Break Battle at Major Support!!!📉XRP has been moving inside a falling channel , with sellers maintaining control for several weeks. However, price is now retesting a major weekly support zone around the 1.8–2.0 area, a level that has acted as a strong turning point in the past.
⚔️As long as this support zone holds, we will be looking for bullish reactions and potential long setups, expecting XRP to rebound inside the structure.
🏹If buyers step in, the first obstacle ahead will be the blue supply zone, which aligns perfectly with the upper channel trendline, creating a magnet-like area where price is likely to be drawn before the next decision.
Only a strong breakout above the supply zone would confirm a larger bullish reversal.
What do you think.. . will XRP defend this support and push higher? Share your view below 👇
⚠️ Disclaimer: This is not financial advice. Always do your own research and manage risk properly.
📚 Stick to your trading plan regarding entries, risk, and management.
Good luck! 🍀
All Strategies Are Good; If Managed Properly!
~Richard Nasr

XRP - Support First, Breakout Second!📦XRP has been holding well above its key support zone , and as long as this level continues to act as a floor, we will be looking for long setups. Buyers have defended this zone multiple times, making it a critical area for a potential bullish reaction.
🏹However, for the bulls to fully take over, XRP needs more than just a bounce. A confirmed break above the falling channel and the last major high in red is needed to shift the momentum and open the door for a larger bullish leg.
Until then, the plan remains simple:
Support holds → look for longs.
Structure breaks → bulls take control.
Will XRP finally break free from this falling channel? 🤔
⚠️ Disclaimer: This is not financial advice. Always do your own research and manage risk properly.
📚 Stick to your trading plan regarding entries, risk, and management.
Good luck! 🍀
All Strategies Are Good; If Managed Properly!
~Richard Nasr
TradeCityPro | XRP Bulls Eyeing Key Support for Surge👋 Welcome to TradeCity Pro!
In this analysis, I want to review the XRP coin, one of the oldest cryptocurrencies, with a $124 billion market cap, currently ranked 4th on CoinMarketCap.
⏳ 4-Hour Timeframe
After the recent market decline, XRP was one of the coins that managed to recover well. It was supported at 1.8733, and with the activation of the 2.0383 trigger, the price made an upward move.
✔️ Currently, the price is at a very important support zone, and as you can see, it is reacting to this level.
💥 The RSI oscillator has moved close to the overbought zone. If it enters this zone, the momentum of this coin will increase significantly, and the price could continue its bullish movement, potentially reaching higher levels.
✨ If the support zone holds, we can open a long position.
For a more accurate trigger, it's better to wait until the price touches this level a few more times and then activate the trigger.
🔔 The next resistance zones for XRP are 2.3404 and 2.5508, which can be used as targets.
The main trigger for confirming the bullish trend on higher cycles will be the break of 2.5508.
🔍 If the price gets rejected from this level and moves back toward 1.8733, we can open a position if volume starts to increase, using a candlestick setup. Otherwise, we can enter with a break of 1.8733.
📝 Final Thoughts
Stay calm, trade wisely, and let's capture the market's best opportunities!
This analysis reflects our opinions and is not financial advice.
Share your thoughts in the comments, and don’t forget to share this analysis with your friends! ❤️

$XRP – Let’s Do It Again!!XRP is once again retesting its daily support zone around $2.60–$2.80, the same level that triggered multiple bullish impulses in recent months.
As long as this red support zone holds, I’ll keep looking for long setups targeting the $3.10–$3.20 supply area.
A daily close below $2.60 would invalidate the setup and shift focus toward the $2.30 support before any potential rebound.
It’s the same play, same level, and the same structure. Let’s see if XRP delivers again! 💪
⚠️ Disclaimer: This is not financial advice. Always do your own research and manage risk properly.
📚 Stick to your trading plan regarding entries, risk, and management.
Good luck! 🍀
All Strategies Are Good; If Managed Properly!
~Richard Nasr
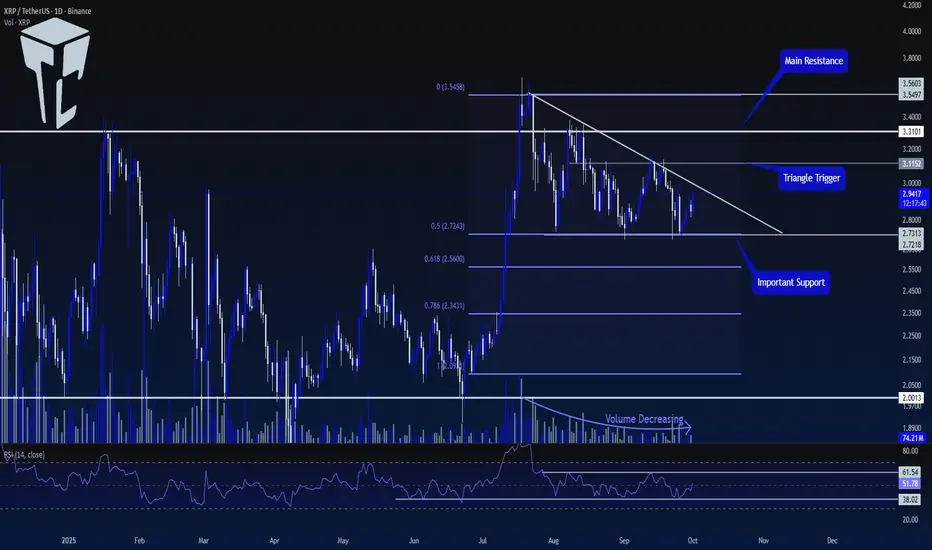
TradeCity Pro | XRP: Key Support and Resistance Zones Testing👋 Welcome to TradeCity Pro!
In this analysis, I will review the XRP coin. One of the oldest crypto projects, XRP aims to align crypto transactions with the SWIFT system. The coin has a market cap of $173 billion and is ranked 4th on CoinMarketCap.
📅 Daily Timeframe
After getting support at the 2.0013 level, XRP made a bullish move up to the 3.5603 resistance. Now, it has formed a descending triangle, and the volume has been decreasing as the price moves down.
⚡️ Currently, a crucial support zone has formed at 2.7218, which overlaps with the 0.5 Fibonacci level, forming a PRZ for us.
🧩 A descending trendline has also been created, and the price has touched it several times, making lower highs.
📊 To confirm the next bullish move for this coin, the first confirmation we need is the breakout of the trendline. The trendline breakout trigger is at 3.1152.
✨ Once this level is broken, we can open a long position. This trigger is the first long position trigger and is considered risky since we haven't yet received the main confirmation for a bullish trend.
🔍 The main trigger for the start of a new bullish trend is the breakout of the 3.3101 level. Breaking this level could start a new upward move for XRP.
💥 A very important confirmation for both long and short positions on the RSI is the breakout of the range between 38.02 and 61.54.
🎲 As long as the RSI remains between these two levels, the probability of hitting stop losses is high. Therefore, for a long position, we can wait for the 61.54 level on the RSI to be broken.
🔽 For a short position, the 38.02 level on the RSI is a good momentum trigger. We can also use the 2.7218 level as a trigger, but keep in mind that the main market momentum is bullish, so this short trigger is considered risky.
📝 Final Thoughts
Stay calm, trade wisely, and let's capture the market's best opportunities!
This analysis reflects our opinions and is not financial advice.
Share your thoughts in the comments, and don’t forget to share this analysis with your friends! ❤️
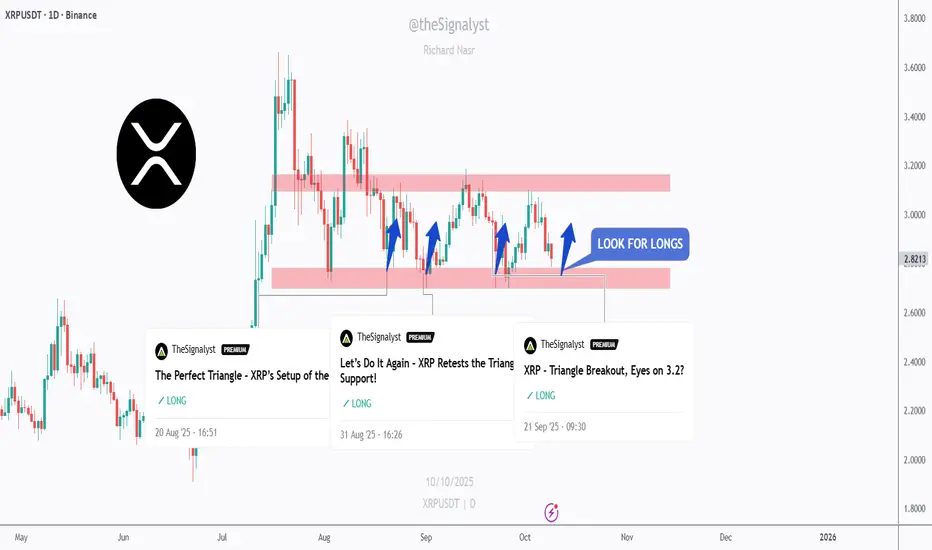
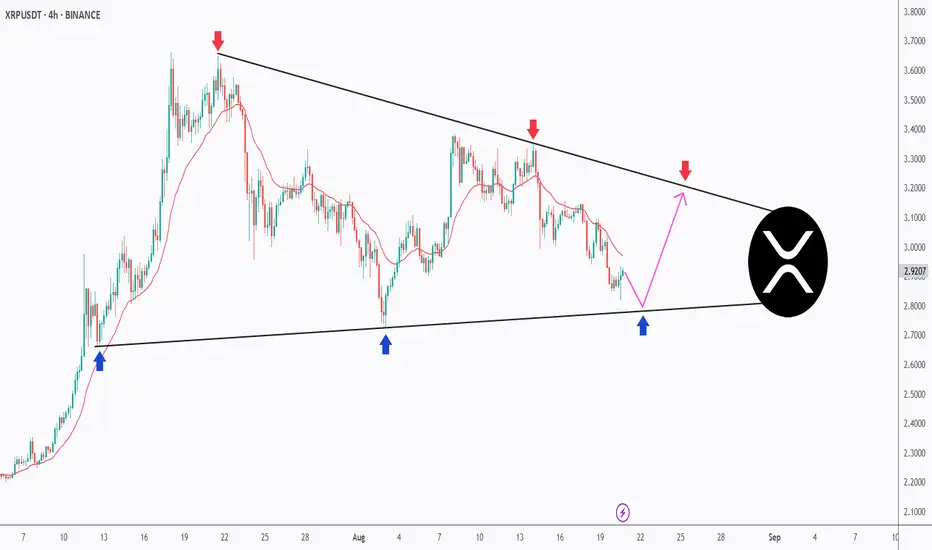
XRP - Triangle Breakout, Eyes on 3.2?XRP broke out of its descending triangle on the daily and shifted the structure bullish. Price is now trading inside the 3.00–3.20 resistance band.
This zone is key 🔑. It’s prior supply and the top of the range. A clean daily close above 3.20 would open 3.40, then 3.60+ inside a fresh markup leg.
If buyers fail to clear it, I’ll watch for a healthy dip toward 2.80–2.90 (triangle base + demand) to reload. Bias stays bullish while the 2.70–2.80 floor holds.
What’s your plan - buy the break above 3.20 or wait for a retest into 2.80–2.90? 🤔
⚠️ Disclaimer: This is not financial advice. Always do your own research and manage risk properly.
📚 Stick to your trading plan regarding entries, risk, and management.
Good luck! 🍀
All Strategies Are Good; If Managed Properly!
~Richard Nasr

SOL/USDT | Is the Next Bullish Wave Coming? (READ THE CAPTION)By analyzing the Solana (SOL) chart on the daily timeframe, we can see that the bullish momentum is still intact, with the price currently trading around $207. I expect that after a short-term correction, we’ll likely see another bullish wave from Solana.
If the price resumes its upward move, the next potential targets are $218, $245, and $260.
Key demand zones to watch are $197–$204 and $173–$187.
Stay alert for reactions around these levels!
Please support me with your likes and comments to motivate me to share more analysis with you and share your opinion about the possible trend of this chart with me !
Best Regards , Arman Shaban

Let’s Do It Again – XRP Retests the Triangle Support!XRP continues to coil inside a textbook symmetrical triangle on the 4H timeframe.
🔻 Sellers remain active at the descending trendline (red arrows).
🔹 Buyers are once again stepping in at the rising support (blue arrows).
📉 Price is now retesting the lower bound of the structure. As long as this zone holds, we can anticipate another potential bounce toward the upper boundary.
🚀 For the bulls to take full control, a break above the last high marked in orange is needed. A confirmed breakout from this triangle will likely define XRP’s next major move — either continuation higher or a bearish breakdown.
This clean and well-defined triangle keeps XRP among the most exciting setups to watch right now!
⚠️ Disclaimer: This is not financial advice. Always do your own research and manage risk properly.
📚 Stick to your trading plan regarding entries, risk management, and trade execution.
Good luck!
All Strategies Are Good; If Managed Properly!
~Richard Nasr
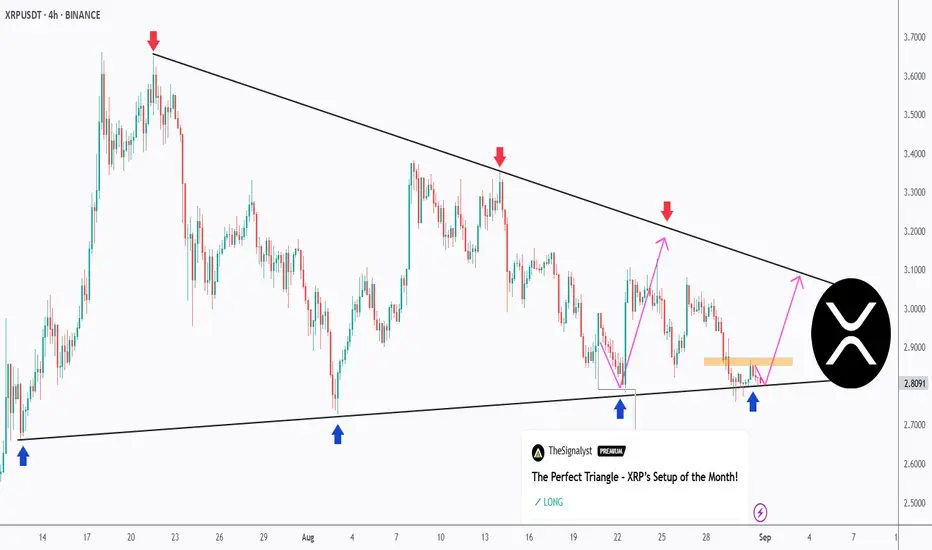
The Perfect Triangle – XRP’s Setup of the Month!XRP has been coiling up inside a textbook symmetrical triangle on the 4H timeframe.
🔻 Sellers are defending the descending trendline (red arrows).
🔹 Buyers keep stepping in at the rising support (blue arrows).
📉 Price is now retesting the lower bound, and as long as this zone holds, we can anticipate a potential bounce back toward the upper boundary.
🚀 A breakout from this formation will likely define XRP’s next major move — either continuation higher or a bearish breakdown.
This clean structure makes XRP one of the most exciting charts to watch this month!
⚠️ Disclaimer: This is not financial advice. Always do your own research and manage risk properly.
📚 Always follow your trading plan regarding entry, risk management, and trade management.
Good luck!
All Strategies Are Good; If Managed Properly!
~Richard Nasr
The Grayscale Ethereum Trust at Risk of Exacerbated DeclineETPs such as Grayscale's ETHE here utilizes APs (Authorized Participants) which are essentially broker dealers and large financial institutions such as banks, hedge funds and other investment firms to maintain liquidity of the Exchange Traded Product. These APs capitalize on the spread between the ETHE shares and the underlying product, in this case Ethereum, to make a yield through arbitrage.
Put simply, if demand for ETHE begins to rises above current supply, Authorized Participants can create new shares by depositing actual ETH with Grayscale. In return, Grayscale grants the AP newly minted ETHE shares. The AP then is able to list these shares on the secondary market where retail traders can buy them.
Historically these APs were able to mint new ETHE through this process of depositing ETH to Grayscale but they weren't able to redeem their ETHE shares back to ETH, however with the very recent onset of In-kind redemption and creation being permitted by the SEC , we are more likely to see a huge shift in the trend of redemptions.
Now that the SEC has enabled these in-kind redemptions, we could see these APs opt to redeem their ETHE shares for ETH just so they could sell said ETH on the open market or use it as liquidity for privately negotiated block trades on CME futures market during times of stress.
Say if there were sudden inflationary shocks, bond yields rose, or we had systemic banking risks, or even margin risk due to the underperformance of other sectors these institutions may have exposure to, we would likely see them let go of their riskiest assets first before resorting to selling other assets such as stocks and equities, especially those within the defensive categories. This would put Grayscales ETPs in direct danger of collapse as they lose liquidity from their APs and more importantly so it would put these underlying assets at risk of significant decline as the APs continue redeeming, adding supply to the open market, and selling.
This would not only result in negative pressure being put on the underlying assets but will also most likely result in Grayscales ETPs falling a significant amount more than the underlying due to the drainage off liquidity and the resulting widening of spreads. Asa result I think the end game for a lot of these crypto adjacent ETPs and Stocks will be that they go bust especially the leveraged products even including stocks like MSTR which effectively act as a leveraged exposure ETF to Bitcoin. In spite of this negative view I do have some optimism for XRP but overall I am quite bearish on the crypto market and all of the adjacent products being created from it.
In short: ETH along with BTC, which started out to as something to separate itself from the fiat banking system is now completely integrated and at the mercy of the fiat banking system along with all the macroeconomic risks that come with it.
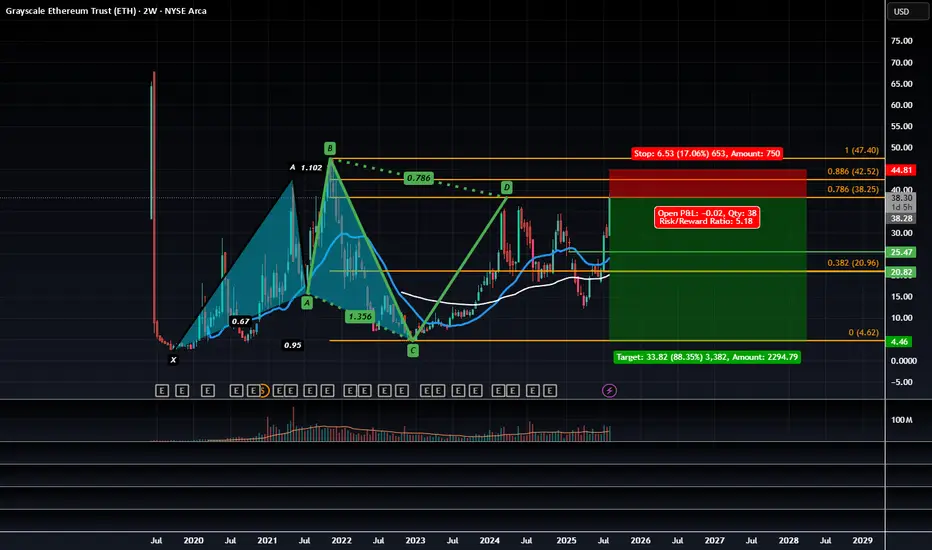
Technical Outlook for the Grayscale Ethereum ETP:
We have a Bearish 5-0 that is completing at the 0.786 retrace we've recently made higher highs but that was likely on the onset of the SEC news release from a couple days ago being interpreted at a bullish capacity, however as the news settles I think it will be more of a negative outcome and us trading to the PCZ off that news provides a good opportunity to sell call spreads and buy puts on ETHE here.
XRP — Weekly Outlook (9–16 Aug 2025)Short-term bias tilts bullish-neutral, with a breakout above $3.42 potentially triggering a rally toward $3.70. On-chain metrics are improving, derivatives remain balanced, and the post-SEC-case momentum is still alive — but all eyes are on the upcoming US CPI release for the next decisive move.
Current Price: $3.32 | Market Cap: ~$197B | 24h Volume: ~$7.5B
📰 Market Context
Regulatory breakthrough — the SEC vs. Ripple case has officially ended with a $125M fine and a ban on direct institutional sales. This removes a major legal overhang while keeping some restrictions in place.
On-chain activity shows XRPL transactions and active accounts (7-day moving average) trending higher compared to June, indicating renewed network usage post-July rally.
Derivatives market remains balanced: Open Interest is steady at ~$3.4B with only ±1% daily change. Funding rates are slightly positive at +0.01%, showing mild bullish sentiment but no overextension. Liquidations in the last 24h are ~$15–16M — within normal range.
📊 Technical Levels
Main support is at $3.15 (20-day MA). If that breaks, next supports are $3.05–$2.95, then $2.70.
Immediate resistance is $3.40–$3.42; a breakout here could open the path to $3.60–$3.66.
RSI (14D) is between 55–62, suggesting moderate bullish momentum. MA-20 sits at $3.15, MA-50 at $2.61.
📅 Key Macro Event
The US CPI report for July will be released on 12 Aug 2025 at 12:30 UTC. Expect volatility as inflation surprises can shift USD strength and global risk appetite.
📈 Weekly Scenarios
Base (55%) Consolidation — consolidation between $3.15 and $3.42 if price holds above $3.15 with neutral OI and funding.
Bullish (30%) Breakout — breakout above $3.42 on strong volume and a $200–300M rise in OI could push price toward $3.60–$3.70, possibly retesting $3.66.
Bearish (15%) Pullback BITSTAMP:XRPUSD — break and close below $3.15 with rising long liquidations could trigger a move to $2.95–$3.05, and in extreme conditions down to $2.70.
✅ Action Points
Watch for a breakout above $3.42 with confirmation from OI and trading volume.
Track XRPL active accounts and payments — if they rise with price, the move is more likely sustainable.
Consider adjusting leverage or widening stops around CPI release time to handle potential volatility.
💬 My view: Short-term bias is bullish-neutral, with upside potential if $3.42 breaks on strong volume. Macro data and on-chain metrics will determine if the rally can extend.

ETH/USDT | ETH Under Pressure – Watch $3500 Support!By analyzing the Ethereum chart on the weekly timeframe, we can see that after reaching the $3940 zone, ETH faced selling pressure and is now trading around $3540. If the price fails to hold the key $3500 support, a deeper decline is likely, with potential targets at $3040 first and possibly $2680 as the second bearish target.
Please support me with your likes and comments to motivate me to share more analysis with you and share your opinion about the possible trend of this chart with me !
Best Regards , Arman Shaban

ETH - BTC ETF News: What It Means for the Market+ China Rumors 🚨 ETH - BTC ETF News: What It Means for the Market + China Rumors 💥🌐
July just ended with a crypto bombshell 💣 — and the market is barely reacting.
Let’s break it down:
🧠 One part hard news.
🌀 One part geopolitical smoke.
🎯 All parts worth watching if you care about macro market shifts.
🏛️ SEC Approves Real BTC & ETH for ETF Flows (July 29)
Say goodbye to the cash-only ETF model.
The SEC now allows direct in-kind creation/redemption of Bitcoin and Ethereum in ETFs.
That means providers like BlackRock, Fidelity, VanEck can now use actual BTC/ETH, not just synthetic tracking.
✅ Bullish Impact:
💰 Real Spot Demand: ETF inflows = real crypto buying
🔄 Efficient Arbitrage: No middle step via cash = faster flows
🧱 TradFi + Crypto Merge: ETFs now settle with crypto — not just track it
🎯 Better Price Accuracy: Spot ETFs reflect true market value more cleanly
📉 The market reaction? Mild.
But don’t get it twisted — this is a structural reset, not a meme pump.
⚠️ But There’s a Bearish Angle:
🏦 Centralized Custody: Crypto now lives in Coinbase, Fireblocks vaults
⚠️ Network Risks: ETF performance now tied to ETH/BTC uptime
🧑⚖️ Regulatory Overreach: More hooks into validator networks, MEV relays
🌊 Volatility Risk: Panic redemptions = real BTC/ETH sold into open markets
Still, this is good news for Ethereum in particular.
Why? Because ETH isn’t just money — it’s infrastructure.
And now Wall Street is finally using it, not just watching it.
🇨🇳 And Then There’s China… Rumor or Tumor?
Crypto Twitter is swirling with unconfirmed whispers from July 29 that China may be prepping a major Bitcoin statement ahead of the BRICS summit.
But let’s be clear:
🚨 It’s a rumor. Or a tumor. 🧠
And like many tumors in crypto — there’s a 40% chance it brings bad news. 🤕
Still, here’s what’s being floated:
🧠 Speculations Include:
🔓 BTC re-legalization in “special finance zones” (HK-style)
🏦 BTC in national reserves (!)
🤖 CBDC integration or smart contract interoperability
⚒️ Return of official state-backed Bitcoin mining
🧯 But no official sources. Just geopolitics + timing.
China’s FUD/FOMO pattern is Bitcoin tradition — don’t get trapped by hopium.
But if even half of it is true... buckle up.
📈 Ethereum Leads the Charge — But Watch These Alts:
If ETFs go fully crypto-native, some sectors light up 🔥
🔹 1. Ethereum Layer 2s (ARB, OP, BASE)
→ ETF gas pressure = L2 scaling demand
🔹 2. DeFi Protocols (UNI, AAVE, LDO)
→ TradFi liquidity meets on-chain utility
🔹 3. ETH Staking Derivatives (LDO, RPL)
→ Institutions want yield = LSD narrative grows
🔹 4. Oracles (LINK)
→ ETFs need trusted on-chain data = Chainlink shines
🔹 5. BTC on ETH Bridges (ThorChain, tBTC)
→ If BTC flows into ETH-based ETFs, bridges light up
🚫 What I will Avoid:
❌ Memecoins – zero relevance to ETF flows
❌ GameFi – not part of TradFi’s roadmap
❌ Ghost Layer 1s – no users, no narrative, no pump
🧠 My Take:
ETH is building momentum toward $4,092 — the third breakout attempt on your 1-2-3 model.
🔥 The fuse is lit. Target? $6,036
Timing? Unknown. But structure is in place.
Meanwhile, Bitcoin Dominance is rising.
ETH is shining.
Solana — while powerful — continues paying the price for memecoin madness 💀
We’re entering a new phase — where ETFs settle with real crypto , China watches the stage, and macro money is warming up behind the curtain.
So stack smart.
Study the flows.
Don’t let silence fool you — the biggest moves come after the news fades.
One Love,
The FX PROFESSOR 💙
Disclosure: I am happy to be part of the Trade Nation's Influencer program and receive a monthly fee for using their TradingView charts in my analysis. Awesome broker, where the trader really comes first! 🌟🤝📈

XRP - One More Wave Soon!Hello TradingView Family / Fellow Traders. This is Richard, also known as theSignalyst.
📈XRP has been overall bullish trading within the rising wedge pattern in blue.
However, it is approaching its all-time high at $3.4.
🏹 The highlighted blue circle is a strong area to look for buy setups as it is the intersection of the orange demand zone and lower blue trendline acting as a non-horizontal support.
📚 As per my trading style:
As #XRP retests the blue circle zone, I will be looking for bullish reversal setups (like a double bottom pattern, trendline break , and so on...)
📚 Always follow your trading plan regarding entry, risk management, and trade management.
Good luck!
All Strategies Are Good; If Managed Properly!
~Rich

TradeCityPro | ADA Eyes Breakout from Bearish Channel Top👋 Welcome to TradeCity Pro!
In this analysis, I want to review the ADA coin for you. The Cardano project is one of the oldest and most popular projects in crypto.
🔍 The coin of this project has a market cap of 22.21 billion dollars and is ranked 10 on CoinMarketCap.
📅 Daily Timeframe
On the daily timeframe, ADA is moving downward within a descending channel and is currently trying to break out of the channel from the top after reaching a support zone.
⭐ One positive sign for buyers is that they didn’t let the price reach the bottom of the channel. Instead, they used the overlap between the midline of the channel and the key 0.5579 zone (marked as a support area) to stop the price from falling.
✨ However, as long as the coin is fluctuating inside this channel, the trend remains bearish. Holding the midline is not a sign of trend reversal yet, but it does indicate weakening of the current trend and may act as one of the bases for a future reversal.
✅ Looking at the RSI oscillator, we can see that each time the price tried to break the channel’s top, RSI reached the 70 area and got rejected, causing the price to drop.
⚡️ Currently, the price is very close to the top of the channel, but RSI has just broken above the 50 line and is moving upward. This is a bullish sign for buyers, as it shows there is still room for upward momentum, which increases the chance of a breakout.
🎲 The nearest trigger for confirming the breakout from the channel is the 0.7212 zone, which is a bit far, and the price will likely form a higher low and high before reaching it, confirming the breakout earlier.
💥 But based on the current data, the breakout trigger remains at 0.7212, and for spot buying, this is the first valid entry level.
👀 Personally, I’m not adding any altcoins to my portfolio right now, as Bitcoin Dominance is still in an uptrend. As long as this trend continues, large capital flows into altcoins are unlikely.
🛒 More reasonable triggers for spot entries would be a breakout above the 0.8414 supply zone. If I were to buy, I’d enter at this level. The final trigger is 1.1325, which is quite far from the current price, and if BTC Dominance continues upward, it could take several months to reach this zone.
🔽 If you already hold this coin in spot, your stop-loss can be set at a break below the 0.5579 level. A breakdown here would also provide a good short setup in futures, as the price could move toward the bottom of the box or the static level at 0.4322.
📝 Final Thoughts
This analysis reflects our opinions and is not financial advice.
Share your thoughts in the comments, and don’t forget to share this analysis with your friends! ❤️

Hold on, here is the real deal.District court ruling on the joint motion (June12) still pending—no update yet.
Judge Torres’ ruling – could come any day; depends on district court docket.
Appeals proceedings remain on hold until at least August 15, 2025.
XRP spot ETF decisions delayed:
SEC ETF decisions, comment periods suggest
Franklin Templeton: very likely by late July
ProShares: by June 25
Grayscale: likely October
Bitwise: through June to October
CPI must fall under 2.0%
Oil must retrace to the $70s
Fed must signal a real cut, not conditional pause
DXY must fall below 103
Current War that we all are focused is going to be ended swiftly.
Until then, Hold Your Horses!

XRP - Trade The Range!Hello TradingView Family / Fellow Traders. This is Richard, also known as theSignalyst.
📈XRP has been trading within a range between $2 and $2.35 in the shape of a flat rising broadening wedge pattern in red.
🏹 The highlighted blue circle is a strong area to look for buy setups as it is the intersection of the green support and lower red trendline acting as a non-horizontal support.
📚 As per my trading style:
As #XRP approaches the blue circle zone, I will be looking for bullish reversal setups (like a double bottom pattern, trendline break , and so on...)
📚 Always follow your trading plan regarding entry, risk management, and trade management.
Good luck!
All Strategies Are Good; If Managed Properly!
~Rich

XRP is so BACK!Hello TradingView Family / Fellow Traders. This is Richard, also known as theSignalyst.
As per our last XRP idea, attached on the chart, it rejected the lower green structure and surged by over 25%.
📈XRP is now bullish long-term trading within the rising channel marked in blue.
Moreover, the upper green zone is a strong structure!
🏹 Thus, the highlighted blue circle is a strong area to look for buy setups as it is the intersection of structure and lower blue trendline acting as a non-horizontal support.
📚 As per my trading style:
As #XRP retests the blue circle zone, I will be looking for bullish reversal setups (like a double bottom pattern, trendline break , and so on...)
📚 Always follow your trading plan regarding entry, risk management, and trade management.
Good luck!
All Strategies Are Good; If Managed Properly!
~Rich

XAUGold is really have not time for wait ... why it should .. there are some kind of long teram pressing price down buyin buyin & buyin .. when they want to sell it ? Or it is already was sold ? who knows ... but ,its insane, how many ways there are to scam people :D
