This Does Not Look Good For Bitcoin!Trading Fam,
Real talk. It does not look good for Bitcoin.
I will not make friends with this post. But I'm not into popularity contest. I simply want to show you what the charts are saying.
My old followers know that I ignored the Head and Shoulders pattern I spotted last cycle. Though, I got a much higher ratio of "likes" on that one post because I continued to believe in hope and hype ...I paid dearly.
I show my wins. And I show my most embarrassing losses. But one thing I will not do is lie.
After all, there is truly no loss if we learn. And so, we will either win here with me OR we will learn.
I learned. And maybe? So did you. I'm tired of paying for expensive lessons. It's time to be cautious and preserve our capital.
Though this Head and Shoulders pattern is not even complete yet, we have to put it on our radar. It's an ominous looking beast. Over 85% of the time, these things do play out. If you're into hopium you might be like, "So you're saying there's still a chance"? Well, yeah. I guess. If you want to look at it that way. Maybe, up to a 15% chance Bitcoin negates this pattern. But let's review a few of the other bearish indicators that have already played out (I have noted these numerous times in previous posts and videos):
Couldn't break above that Pi Cycle Top Trendline. Hit it to the 'T' three times but could not break it.
Wyckoff Market Cycle (previous post) currently playing out.
Megaphone pattern (previous post) played out
Bear Flag broken today (though not yet confirmed)
Below that orange 350-day SMA - almost always indicates entry into a bear cycle
A "SELL" signal from my most reliable indicator, The Pivot Zones Indicator .
And now?
Now, we are forming that very ominous Head and Shoulders pattern. I will not ignore it again. A break below that RED 2021 Top Trendline, which is also acting as the neckline, is not good. It's not good at all.
I'll leave it at that and let the chart do the rest of the talking.
Take care friends,
✌️Stew
Sellsetup

SHORT ON CHF/JPYJPY Index is getting ready to rise significantly to the upside.
All of the xxx/jpy pairs are setup for major drops.
I will be selling CHF/JPY looking to catch 250-500 pips to the previous swing low.

GBPUSD Sell Momentum | Gap Open + Order Block BreakGBPUSD H4 Bearish Since 05 January 2026, price has been moving inside a bearish channel CHOCH BOS confirmed, indicating a clear bearish shift Internal Order Block is in play and has been respected MACD supports the bearish momentum. The lower order block has been broken.
Targets downside liquidity.

Accumulate upward trend - around 4600⭐️GOLDEN INFORMATION:
Gold (XAU/USD) extends its losses for the second successive session, trading around $4,590 on Friday. The prices of precious metals, including Gold, fall amid decreasing safe-haven demand as geopolitical risks in Iran temporarily ease.
US President Donald Trump signaled he may delay military action after Iran pledged not to execute protesters. Market sentiment was further eased by reports that Israel and other Middle Eastern allies urged the US to hold off on any potential strike against Iran.
⭐️Personal comments NOVA:
Gold prices are consolidating around 4600; if they break below 4563, there will be a stronger sell-off around the gap at 4517.
⭐️SET UP GOLD PRICE:
🔥SELL GOLD zone: 4640 - 4642 SL 4647
TP1: $4625
TP2: $4610
TP3: $4590
🔥BUY GOLD zone: 4518 - 4516 SL 4511
TP1: $4530
TP2: $4545
TP3: $4560
⭐️Technical analysis:
Based on technical indicators EMA 34, EMA89 and support resistance areas to set up a reasonable SELL order.
⭐️NOTE:
Note: Nova wishes traders to manage their capital well
- take the number of lots that match your capital
- Takeprofit equal to 4-6% of capital account
- Stoplose equal to 2-3% of capital account

BTC | The Calm Before the Dump... or Pump?Bitcoin is reacting from a key higher-timeframe point of interest (POI). Price has reached a high-probability FVG that broke structure to the downside with strong displacement — now forming a potential short-term ceiling.
Below, a notable sell-side liquidity pool sits near $74,558, offering a possible downside target if price continues to respect this daily FVG. Should that level give way, the next POI would be the marked bearish order block, with extended liquidity zones reaching toward the $52K region.
If both sell-side areas are taken out with strong momentum, it could confirm a deeper re-price phase before the next bullish leg.
Overall, we’re watching for how price responds within these key levels — structure will tell the story.
Disclaimer:
This analysis is for educational purposes only and does not constitute financial advice. Always do your own research (DYOR) before making any trading decisions.

High selling pressure - waiting for BTC to continue falling.Bitcoin (BTC/USD) – Daily Chart Analysis
Bitcoin recently tested the 95,000 resistance zone and was rejected strongly, confirming this area as a major supply zone aligned with the EMA cluster and key Fibonacci resistance. After this rejection, price reacted sharply back into the 80,000 range, showing clear selling pressure and weakening bullish momentum.
Market structure & key levels:
95,000 – 96,000: Strong resistance. Previous support has now flipped into resistance.
80,000 – 89,000: Current consolidation zone after the rejection from 95k. Price action here looks corrective, not impulsive.
87,000: Critical support level and decision zone for the market.
Bearish continuation scenario (high priority):
If BTC breaks and closes below 87,000, it will confirm a bearish continuation on the daily timeframe.
In this case, downside momentum is likely to accelerate, with the next major target at the 70,000 support zone, where strong historical demand is located.
Alternative scenario:
A short-term bounce toward 92,000–95,000 is possible, but as long as price remains below 95k, this move should be viewed as a pullback to resistance, not a trend reversal.

Gold is consolidating lower ahead of NFP news.⭐️GOLDEN INFORMATION:
Friday’s US December jobs report will be in focus for signals on the policy outlook. Payrolls are expected to rise by about 60K, with the Unemployment Rate seen edging down to 4.5%. A softer-than-forecast print would strengthen expectations for Fed easing, lending support to Gold by lowering real yields and reducing the opportunity cost of holding the non-yielding asset.
⭐️Personal comments NOVA:
Gold prices remain sideways - selling pressure continues to push gold back below 4400. Accumulation ahead of this week's NFP news.
⭐️SET UP GOLD PRICE:
🔥SELL GOLD zone: 4478 - 4480 SL 4485
TP1: $4460
TP2: $4445
TP3: $4430
🔥BUY GOLD zone: 4387 - 4385 SL 4380
TP1: $4400
TP2: $4415
TP3: $4430
⭐️Technical analysis:
Based on technical indicators EMA 34, EMA89 and support resistance areas to set up a reasonable SELL order.
⭐️NOTE:
Note: Nova wishes traders to manage their capital well
- take the number of lots that match your capital
- Takeprofit equal to 4-6% of capital account
- Stoplose equal to 2-3% of capital account

sell XauusdHead and shoulders pattern forming on gold at the moment, a break of the neckline and a retest would lead to further downside, 4400 is possible before the end of the week, wait for a retest of the neck line and a continuation to validate setup.

XAUUSD Setup Short📉 XAUUSD Setup Explanation
Gold just retested the 200 EMA / 50 EMA zone, which is acting as dynamic resistance. Price tapped into this resistance and showed rejection wicks, indicating sellers defending the area.
The structure is still bearish overall, and this retest offers a potential sell setup.
🔻 Short Setup
Entry Zone: 4200–4202 (resistance retest area)
Stop-Loss: Above the rejection zone at 4208–4210
Targets:
TP1: 4190
TP2: 4184
TP3: 4178
Reasoning:
Trend is still bearish on lower timeframes.
Price rejected EMA50 & EMA200 resistance.
Lower highs formation continues.

Selling pressure - correction below 4300✍️ NOVA hello everyone, Let's comment on gold price next week from 01/05/2026 - 01/09/2026
⭐️GOLDEN INFORMATION:
Gold (XAU/USD) accelerated its recovery on a holiday-thinned session on Friday, with markets in Japan and China closed for the New Year lantern. The precious metal is 1.75% up on the day, reaching levels near $4,400, after bouncing from $4,274 earlier this week.
A combination of market expectations of lower interest rates in the US and growing geopolitical frictions has underpinned support from precious metals over the last few sessions. Russia has announced the revision of its stance at the peace talks with Ukraine, after an intentional drone attack in one of President Vladimir Putin's residences, while US President Trump has raised his tone against Iran.
⭐️Personal comments NOVA:
Investor sentiment remains pressured to sell and take profits at the start of the new year - however, global military concerns continue to provide upward momentum for gold prices.
🔥 Technically:
Based on the resistance and support areas of the gold price according to the H4 frame, NOVA identifies the important key areas as follows:
Resistance: $4402, $4453
Support: $4274, $4237
🔥 NOTE:
Note: Nova wishes traders to manage their capital well
- take the number of lots that match your capital
- Takeprofit equal to 4-6% of capital account
- Stoplose equal to 2-3% of capital account
- The winner is the one who sticks with the market the longest

Selling pressure on BTC - 2026Bitcoin (BTC/USD) – End-of-Year Outlook (D1)
As we move toward the end of the year, Bitcoin is showing a clear shift from uptrend to corrective / bearish structure on the daily timeframe.
1. Market Structure
BTC has broken below the rising channel and failed to reclaim it, confirming a loss of bullish control.
Price is now trading below EMA 34 and EMA 89, while EMA 200 remains far above — a classic sign of a medium-term downtrend.
2. Key Resistance Zone
The 95,000–96,000 area (purple zone) is a strong supply / sell zone, aligned with:
Previous support turned resistance
EMA confluence
Any pullback into this zone is likely to attract sellers rather than buyers.
3. Support & Downside Scenarios
First downside target: ~76,700
This is a major demand zone and the 1.618 Fibonacci extension.
If this level breaks:
Price could extend further toward 52,000–53,000, which is a long-term demand area and strong historical support.
4. Year-End Expectation
Without a strong reclaim above 96,000, BTC is more likely to:
Continue sideways to bearish movement, or
Form a bearish pullback before another leg down

Downtrend towards the end of the year, below 4300⭐️GOLDEN INFORMATION:
In the wake of the FOMC Minutes release, market-implied expectations for a rate cut at the January meeting edged lower, with federal funds futures now assigning roughly a 15% probability to an easing move, according to the CME FedWatch tool. The shift suggests a modest recalibration of near-term policy expectations among traders.
Separately, the Chicago Mercantile Exchange (CME) Group—one of the world’s largest commodity trading venues—announced an increase in margin requirements for gold, silver, and other metal contracts, as outlined in a notice published on its website last week. The higher margins compel traders to post additional collateral to cover positions, aiming to mitigate counterparty risk in the event of delivery and often prompting position adjustments across the metals complex.
⭐️Personal comments NOVA:
Gold prices are under selling pressure at the end of the year, with a major decline potentially returning below 4300.
⭐️SET UP GOLD PRICE:
🔥SELL GOLD zone: 4401 - 4403 SL 4408
TP1: $4390
TP2: $4380
TP3: $4365
🔥BUY GOLD zone: 4249 - 4246 SL 4242
TP1: $4260
TP2: $4275
TP3: $4290
⭐️Technical analysis:
Based on technical indicators EMA 34, EMA89 and support resistance areas to set up a reasonable SELL order.
⭐️NOTE:
Note: Nova wishes traders to manage their capital well
- take the number of lots that match your capital
- Takeprofit equal to 4-6% of capital account
- Stoplose equal to 2-3% of capital account

Gold prices remain above 4300 at the end of the year.⭐️GOLDEN INFORMATION:
The US Federal Reserve moved to lower its policy rate by 25 basis points, setting the federal funds target range at 3.50%–3.75%. Policymakers backing the decision pointed to rising downside risks to the labor market alongside easing inflation dynamics as justification for the adjustment.
The vote, however, revealed notable divisions within the Committee. Fed Governor Stephen Miran dissented in favor of a larger, “jumbo” rate cut, while Chicago Fed President Austan Goolsbee and Kansas City Fed President Jeff Schmid opposed the move, preferring to keep interest rates unchanged.
⭐️Personal comments NOVA:
Gold prices are trading sideways within the year-end correction range of 4300 - 4400.
⭐️SET UP GOLD PRICE:
🔥SELL GOLD zone: 4401 - 4403 SL 4408
TP1: $4390
TP2: $4380
TP3: $4365
🔥BUY GOLD zone: 4304 - 4302 SL 4297
TP1: $4315
TP2: $4330
TP3: $4345
⭐️Technical analysis:
Based on technical indicators EMA 34, EMA89 and support resistance areas to set up a reasonable SELL order.
⭐️NOTE:
Note: Nova wishes traders to manage their capital well
- take the number of lots that match your capital
- Takeprofit equal to 4-6% of capital account
- Stoplose equal to 2-3% of capital account

Nifty 50 ~ Night skyThis is logical to see the price a little bit down.
We have here nice price mark. That can be used as a Take Profit.
Market is going up in the big picture. But we have right now a little downtrend tendency.

Gold will adjust downwards below 4500!⭐️GOLDEN INFORMATION:
Gold (XAU/USD) retreats modestly from its fresh record peak at $4,526 during early European trading on Wednesday, as short-term traders lock in profits following the recent sharp rally. The pullback is further reinforced by stronger-than-expected US Gross Domestic Product data, which tends to underpin the US Dollar and, in turn, creates headwinds for USD-denominated assets such as Gold by increasing their relative cost for non-US investors.
That said, downside risks for the yellow metal appear contained. Ongoing geopolitical uncertainty—most notably surrounding tensions between the United States and Venezuela—continues to support safe-haven demand, providing an underlying bid that may help limit deeper corrective moves.
⭐️Personal comments NOVA:
Gold is consolidating and correcting downwards after reaching its all-time high of 4526.
⭐️SET UP GOLD PRICE:
🔥SELL GOLD zone: 4524 - 4526 SL 4531
TP1: $4515
TP2: $4500
TP3: $4485
🔥BUY GOLD zone: 4404 - 4406 SL 4399
TP1: $4420
TP2: $4435
TP3: $4450
⭐️Technical analysis:
Based on technical indicators EMA 34, EMA89 and support resistance areas to set up a reasonable SELL order.
⭐️NOTE:
Note: Nova wishes traders to manage their capital well
- take the number of lots that match your capital
- Takeprofit equal to 4-6% of capital account
- Stoplose equal to 2-3% of capital account

SHORT ON GBP/USDGU is over brough and has given us a change of character to the downside on the lower timeframe.
The (DXY) Dollar is also showing strength to rise from taking out previous day/week lows.
I and looking to catch 100-150 pips on GU.

Gold prices adjust downwards - further consolidation.⭐️GOLDEN INFORMATION:
US officials indicated on Monday that a framework agreement with Ukrainian President Volodymyr Zelenskyy aimed at ending the war with Russia is close to completion, though key obstacles remain, including unresolved territorial issues and the absence of firm security guarantees from the US and European allies.
On the monetary front, New York Fed President John Williams said that policy is well calibrated heading into next year following last week’s rate cut, noting persistent downside risks to employment alongside easing inflation pressures, according to Bloomberg. Separately, Fed Governor Stephen Miran reiterated that current monetary settings remain overly restrictive, adding that he is likely to stay at the central bank beyond the end of his term until a successor is formally confirmed.
⭐️Personal comments NOVA:
Gold prices are consolidating and correcting around 4300 - the market is awaiting today's NFP data; the more consolidation, the greater the volatility.
⭐️SET UP GOLD PRICE:
🔥SELL GOLD zone: 4381 - 4384 SL 4388
TP1: $4370
TP2: $4355
TP3: $4340
🔥BUY GOLD zone: 4242 - 4240 SL 4235
TP1: $4255
TP2: $4270
TP3: $4285
⭐️Technical analysis:
Based on technical indicators EMA 34, EMA89 and support resistance areas to set up a reasonable SELL order.
⭐️NOTE:
Note: Nova wishes traders to manage their capital well
- take the number of lots that match your capital
- Takeprofit equal to 4-6% of capital account
- Stoplose equal to 2-3% of capital account

Smart Money Made a Weird Move in JPY..Here’s What It Means for UJPY Futures: A Rare & Complex "Condor" in Play
On the JPY futures chart, just above current price, lies a wing of a "Condor" option structure that formed last week.
This isn’t a small play — the size suggests a serious participant.
Historically, in 4 out of 5 cases, price has reacted to the wings of a Condor — often reversing at these levels.
The logic here is clear:
For maximum profit, price must stay within a specific range by expiry.
But here’s the twist:
This Condor was built across multiple expiry series — an unusual setup that adds complexity and questions about its effectiveness.
So honestly?
I’m genuinely curious:
Will price respect this non-standard Condor wing?
📌 I’ve set an alert.
And yes — a sell limit order is in place (with reduced size).
Anyone else have different observations? Let’s discuss.

GOLD UPDATE📉 SELL SETUP ACTIVE — Levels on Watch!
Price is reacting around an important zone, and this setup could get interesting 👀🔥
🔓 Entry Levels: 4239 / 4242
❌ Stop: 4378
🎯 Target: 4286
What’s your take on this move?
Bullish or bearish from here?
Share your thoughts below — let’s get a discussion going! ⬇️💬🔥
Your like/support helps this reach more traders 👍
⚠️ Disclaimer: This is not financial advice. Always do your own research and manage your risk.

EURUSD – Breakout Trading SetupPrice is currently sitting just above the support line at 1.15590, which has acted as an important turning zone many times before.
This area is the key level I am watching for the next directional move.
For my approach, it’s very simple:
✨ My Breakout Plan
If price breaks below 1.15590 with a clean candle-body close, I expect EURUSD to extend further downward into the next Fibonacci extension zones.
These green dotted levels are my anticipation areas:
🎯 Target 1 (Fib 1.618): 1.15300
🎯 Target 2 (Fib 2.000): 1.15086
These targets are fully based on the Fib Extension tool, not random.
Once the support level is broken, price usually accelerates toward these extension levels, especially after such a long consolidation.
This is a simple breakout-style idea — no complications.
📘 Disclaimer
This is only my personal breakout approach and not financial advice.

Gold 4H – Bearish Harmonic Rejection SetupGold is currently testing a major descending trendline drawn from the previous swing high (Point A). Price has tapped into a strong supply zone / rejection block around 4150–4170, which also aligns with the 0.618 and 0.70 Fibonacci retracement levels taken from the C–D leg projection.
The structure shows a potential harmonic completion, where the market has printed an A–B–C pattern and is now forming the final leg toward D. The repeated rejections from the shaded supply zone indicate weakening bullish momentum.
As long as price remains below this supply region and fails to break the descending trendline, the setup favors a downside continuation, targeting the lower trendline support near 3800–3850, completing the projected D-leg.
Key Highlights:
Price reacting to multi-touch descending trendline
Strong supply zone (4150–4170) aligned with 0.618/0.70 fib
Bearish harmonic structure aiming for D-leg completion
Potential downside target: 3800–3850
Bias remains bearish unless price breaks and holds above the supply zone

Bulls don't get too comfortable....fundamentals still not goodHave been tracking the swings recently and macros and it's worth noting that the fundamentals of the economy are still weak. The upcoming rate reduction is already priced in, and it won't change the employment / defaults / private credit environment and inflation. Expect a dip very very soon and red across the board. The economy is being propped up with hot air and it's just not sustainable. All the macros are screaming red and people are ignoring until it's too late.
#SQQQ could be an interesting hedge, but would pull out now from any long positions as the AI bubble is showing big cracks and people are deciding to look the other way until they get wiped out.
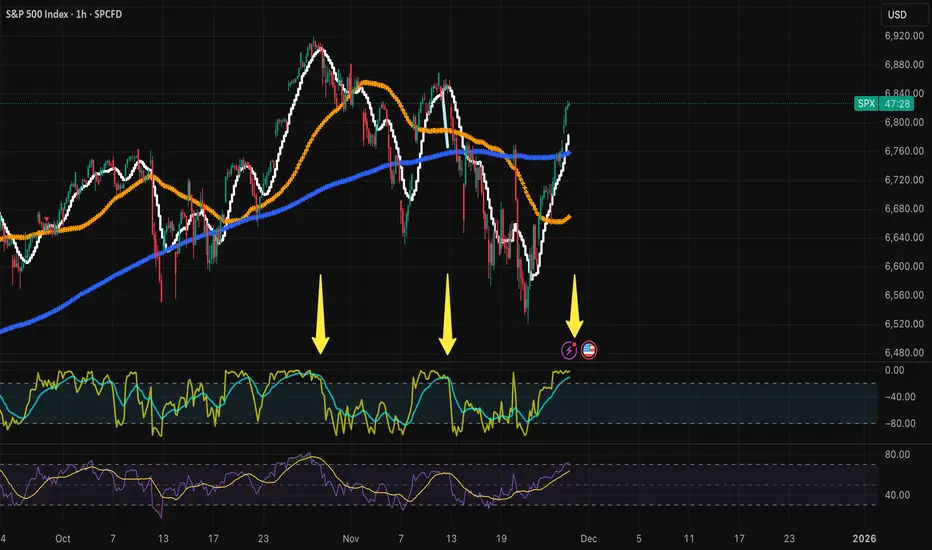
sell and short area for long term short setupone hour sell area for short, maybe long term. all signals are sell oriented, make sure you have your own idea and trade, I am not responsible for any trade taken according to my setup.
