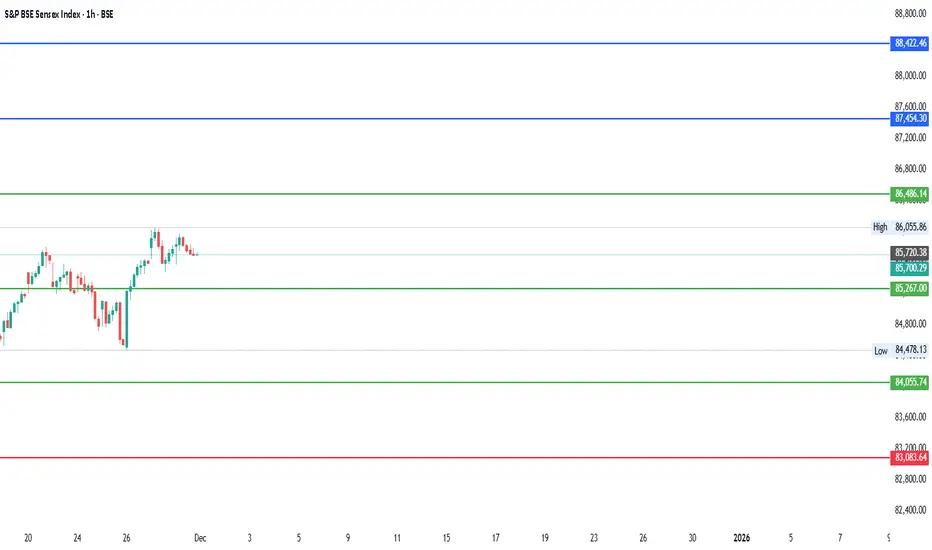
#Sensex - Is a 5,000-point move loading?Date: 30-11-2025
#Sensex Current Price: ₹ 85,706.67
Pivot Point: ₹ 85,267.00 Support: ₹ 84,055.74 Resistance: ₹ 86,486.14
Upside Levels:
L1: ₹ 87,454.30 L2: ₹ 88,422.46 L3: ₹ 89,605.75 L4: ₹ 90,789.05
Downside Levels:
L1: ₹ 83,083.64 L2: ₹ 82,111.54 L3: ₹ 80,928.24 L4: ₹ 79,744.94
#Sensex #Markets #Stocks #IndiaMarkets #Trading #Nifty #SensexUpdate #MarketOutlook #in_tradingview
Sensex
NIFTY 50 - YEAR END CONSOLIDATION📊 NIFTY 50 TECHNICAL UPDATE: YEAR-END CONSOLIDATION PHASE
Indian markets are wrapping up 2025 in a period of consolidation. While the long-term trend remains bullish, the Nifty 50 is navigating a narrow range as we head into the final week of the year.
📉 CURRENT PRICE ACTION
Close: 26,042.30 (-0.38%)
Volatility: The index is finding significant buying interest near its 50-day EMA.
Volume: Trading volumes are thin due to the holiday season, which can lead to erratic moves.
🚀 CRITICAL LEVELS TO WATCH
UPWARD RESISTANCE
Primary Target: 26,166 – 26,245 (Needed to revive the rally)
Major Hurdle: 26,300 – 26,400 (Recent historical highs)
DOWNWARD SUPPORT
Immediate Floor: 26,000 – 25,950 (Psychological level)
Crucial Base: 25,830 – 25,700 (Break below this could trigger a correction)
📈 INDICATORS AND MOMENTUM
Moving Averages: Trading above the 200-day EMA (~24,880), showing long-term health is intact.
RSI: The 14-day RSI has slipped to 41.7, signaling a move into a neutral-to-cautious zone.
🔍 SECTORAL OUTLOOK AND STRATEGY
Drags: Heavyweight Banking and IT stocks like HDFC Bank and TCS are seeing profit booking.
Gains: Defence and FMCG sectors, including HAL and Titan, continue to show strength.
Strategy: A "wait-and-watch" approach is recommended. A bounce from 26,000 could target 26,550 in January.
#Nifty50 #StockMarketIndia #Nifty #NSEIndia #BankNifty #TradingStrategy #TechnicalAnalysis #InvestingIndia #Sensex #NiftyNextWeek

#BankNifty - 3000+ Points Coming?Date: 30-11-2025
BankNifty Current Price: ₹ 59,752.70
Pivot Point: ₹ 59,324.50 Support: ₹ 58,489.09 Resistance: ₹ 60,165.33
Upside Levels:
L1: ₹ 60,827.92 L2: ₹ 61,490.50 L3: ₹ 62,302.75 L4: ₹ 63,115.00
Downside Levels:
L1: ₹ 57,823.79 L2: ₹ 57,158.50 L3: ₹ 56,346.25 L4: ₹ 55,534.00
#Sensex #Markets #Stocks #IndiaMarkets #Trading #Nifty #SensexUpdate #MarketOutlook #in_tradingview

Nifty50 4hr Chart Analysis-Nov 30, 2025Nifty50 4hr Chart Analysis-Nov 30, 2025
Case1:
*Expecting 4hr to drop to Daily Support Level (iFVG-D), which almost 50% of current range.
Case2:
*If nifty goes for a deeper retracement then expecting 0.79 which is also a 4hour Support level (+OB-4hr)

NIFTY 50: Navigating the Past Year’s Volatility for Future Gains
Title:
NIFTY 50: Navigating the Past Year’s Volatility for Future Gains
Greetings, Traders!
🌟 Hello everyone,
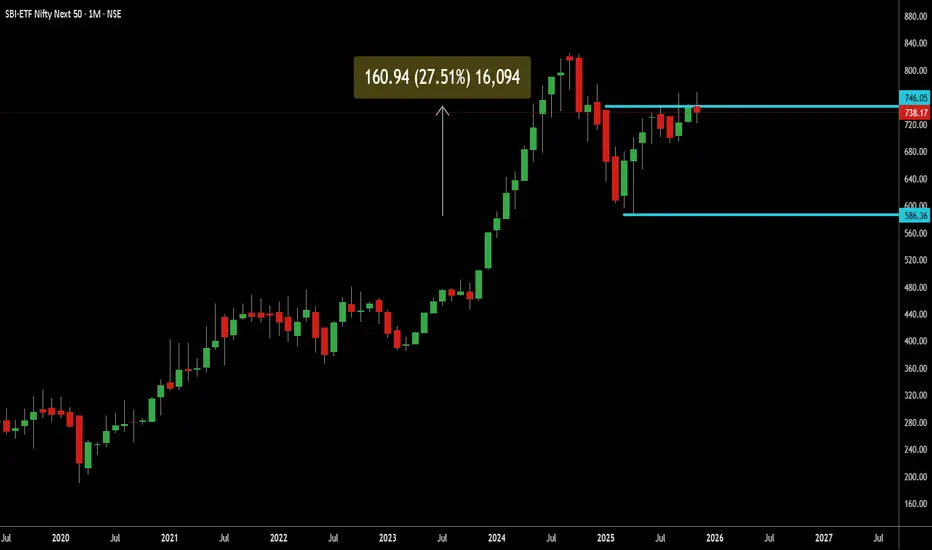
Over the past year, NIFTY 50 has shown significant volatility, with a notable decline and subsequent recovery. Understanding this movement can help traders make informed decisions for future opportunities.
$NIFTY50
Key Observations:
- From January to the present, NIFTY 50 experienced a fall of approximately **27.51%**, dropping from **738** to **586**.
- Many traders who entered positions in January may feel that returns have been stagnant, but the key is to recognize the value of averaging down during market corrections.
- By strategically adding to positions during declines of **10-15%**, traders can effectively lower their average cost basis, setting the stage for stronger returns as the market recovers.
Technical Analysis:
The current price of NIFTY 50 stands at **746**, and technical indicators suggest that there is potential for further upside. A move towards **840** is likely, and beyond that, the index could continue climbing higher. This indicates a promising upward trend in the longer term.
Fundamental Factors:
While technical patterns guide short-term strategies, fundamental factors such as economic growth, corporate earnings, and macroeconomic conditions support the long-term bullish outlook for NIFTY 50. A consistent **15% CAGR** over time can contribute significantly to wealth accumulation.
Trading Strategies:
To capitalize on these insights, traders may consider adopting a disciplined approach:
- Averaging down during market dips to reduce cost basis.
- Holding positions for the long term to benefit from the market’s recovery and growth.
- Monitoring key resistance levels, such as **840**, and preparing for further upside.
In Conclusion:
NIFTY 50’s past year of volatility highlights the importance of patience and strategic investment. By leveraging market dips and maintaining a long-term perspective, traders can achieve substantial growth and build wealth over time.
Engage with Us:
🟢 If you find this analysis insightful, please give it a LIKE.
🟡 Don’t forget to FOLLOW for more updates.
🔵 SHARE with fellow traders who might benefit from this information.
🔴 Feel free to COMMENT with your thoughts and insights!
Your active participation enriches our trading community, fostering knowledge exchange and collective growth. Share your feedback and ideas in the comments below or by boosting this post.
Looking forward to connecting with you in the next post.
Happy trading!
India Triad. Nifty, Bank Nifty and SensexExpect bullish action across three different indexes in Indian markets

India Index Triad. Nifty, Bank Nifty and SensexNSE:NIFTY
NSE:BANKNIFTY
BSE:SENSEX
Covering the Draw on Nifty and the thought process behind that draw. Go ahead check it out and let me know

Going back to covid lows? This bull market has reached its top. Things are not looking good geopolitically for India. This should be it or max 90k. if it looses 80k, then the game is over. See you at covid lows in an 12-18 months. Good luck.
Not a financial advise.

BTCUSDT.P 1D Time frameMarket Overview
Current Price: ~$112,380
Daily Change: Slight dip (around –0.3%)
Volatility: At multi-month lows, meaning the market is consolidating before a possible breakout.
📈 Key Levels
Immediate Resistance: $112,800 → price needs to clear this for upside continuation.
Next Resistance Zones: $114,000 → $116,000, and further up around $128,000.
Immediate Support: $111,000 → first cushion below current price.
Deeper Support: $110,000, then $107,800–108,000.
🔎 Technical Indicators
RSI (14-day): ~43 → Neutral, showing neither overbought nor oversold conditions.
MACD: Bullish crossover → suggests upward momentum is building.
Stochastic Oscillator: Near oversold → possible short-term bounce.
🧭 Outlook
Bullish Case: A sustained breakout above $114,000 could open a rally toward $128,000.
Sideways Case: Holding between $111,000 and $113,000 keeps Bitcoin in consolidation.
Bearish Case: A break below $110,000 could trigger a move toward $108,000 or even $102,000.
Overall Bias: Moderately bullish, but the market is in a tight range and waiting for a breakout.

MSTR 1D Time frameMarket Snapshot
Current Price: ~$328.50
Daily Change: -0.4% (approx)
Technical Overview
Indicators & Momentum
RSI (14-day): ~40 → Neutral, slightly below the midpoint—no major squeeze yet.
MACD: Negative (~–1.6) → Weak bearish momentum.
Stochastic Oscillator: Around 31 → Neutral to slightly oversold.
Stochastic RSI: Overbought zone → Possible short-term exhaustion.
Williams %R: ~–39 → Suggests room for both upside and downside.
ADX: ~18–26 → Indicates a weak to moderate trend—market lacks strong direction.
Moving Averages
Short-term moving averages (like 5-day and 10-day) show buy signals, while broader averages—including the 20-day, 50-day, 100-day, and 200-day—are all negative, suggesting broader downward pressure.
Support & Resistance
Based on various pivot point analyses:
Immediate Support: ~$324–325
Near-term Support Zone: ~$320
Immediate Resistance: ~$332–334
Further Resistance: ~$340–345
Broader Technical & Market Context
Downtrend in Play: The stock has declined nearly 40% from its July highs and is approaching its lowest levels since April.
Death Cross Forming: The 50-day moving average is nearing a bearish crossover below the 200-day average.
Diving Technical Ratings: Most moving averages and oscillators point to a negative bias—short-term signals are weak, and longs are retreating.
Bullish Divergence? Some chart setups hint at a potential wedge or triangle pattern with possible bullish divergence, but these are speculative and not yet confirmed.
MicroStrategy remains under pressure, with indicators pointing overwhelmingly to neutral or bearish signals. While short-term moving averages show minor support, the broader technical picture remains weak—and a breakout above ~$334 would be needed to suggest a reversal.

NVDA 2HourTime frameNVDA 2-Hour Snapshot
Current Price: $170.76 USD
Previous Close: $168.31 USD
Day Range: $166.74 – $170.97 USD
52-Week Range: $139.34 – $200.00 USD
Volume: 170,370,750
VWAP: $169.67 USD
Market Cap: $1.1 Trillion
🔎 Technical Indicators
Relative Strength Index (RSI): 39.44 — Neutral
Moving Averages:
5-period: $169.68 — Sell
10-period: $174.59 — Sell
20-period: $177.06 — Sell
50-period: $172.58 — Sell
100-period: $150.61 — Buy
200-period: $139.34 — Buy
Moving Average Convergence Divergence (MACD): -0.91 — Buy
Stochastic Oscillator: 20.33 — Neutral
Commodity Channel Index (CCI): -119.52 — Buy
Average True Range (ATR): 4.93
📈 Market Sentiment
Pivot Points:
Resistance: $175.00 USD
Support: $165.00 USD
📅 Outlook
Bullish Scenario: A breakout above $175.00 USD could signal a move toward $185.00 USD.
Bearish Scenario: A drop below $165.00 USD may lead to further downside.
Overall Bias: Neutral, with mixed signals from moving averages and momentum indicators.

USDJPY 2Hour Time frameUSD/JPY 2-Hour Snapshot
Current Price: 147.46 JPY
Change: +0.05% from the previous close
Market Cap: Not applicable
P/E Ratio: Not applicable
EPS: Not applicable
Intraday High: 147.59 JPY
Intraday Low: 147.27 JPY
🔎 Technical Indicators
RSI (14): Neutral
MACD: Neutral
Moving Averages:
5-period SMA: Not available
10-period SMA: Not available
20-period SMA: Not available
50-period SMA: Not available
📈 Market Sentiment
Pivot Points:
R1: Not available
R2: Not available
R3: Not available
S1: Not available
S2: Not available
S3: Not available
📅 Outlook
Bullish Scenario: A breakout above the current price could lead to further gains.
Bearish Scenario: A drop below the current price may test support levels.
Overall Bias: Neutral, with mixed signals from moving averages and momentum indicators.

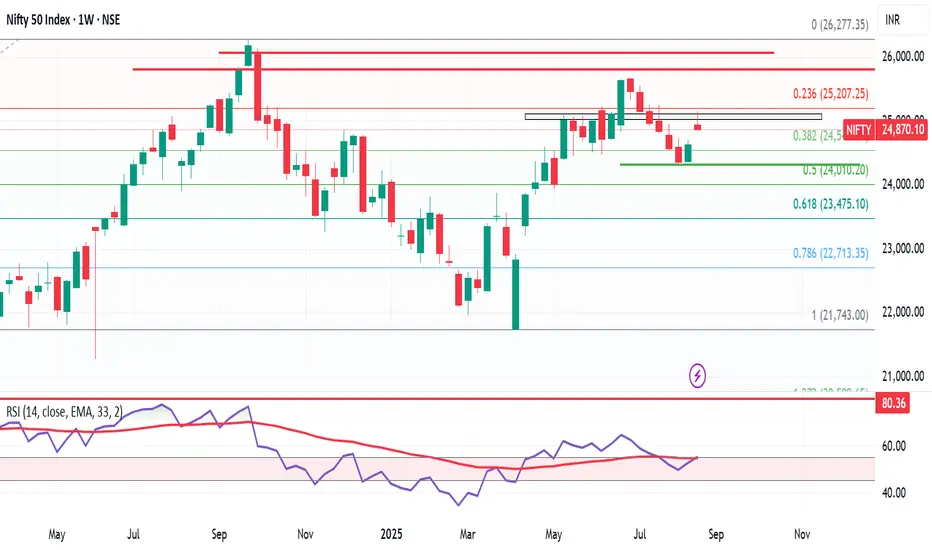
Nifty Forms Shooting Star – Is Septmber Correction on the Cards?Nifty closed this week at 24,870, up 240 points from the previous week’s close. It made a high of 25,153 and a low of 24,852, once again respecting my projected range of 25,100 – 24,300.
But here’s the key: this week, Nifty formed a Shooting Star candle, which is a bearish reversal pattern. As long as Nifty stays above 24,852, bulls are safe. But a break below this level could trigger downward pressure toward 24,400.
📊 Next Week’s Range:
➡️ Likely range → 25,350 – 24,400
➡️ Break below 24,852 = bearish pressure
➡️ If 24,400 breaks, 23,900 could come into play
Historical September Pattern:
From the 2nd week of September, markets have historically shown 6–11% corrections from their highs. If history repeats, within the next 10 days we could see another push toward 25,600/25,700, followed by heavy selling pressure.
✅ My Plan:
If markets rise in the coming days, I’ll be looking to cash out from existing positions and prepare to re-enter at better levels if a correction begins in the 2nd or 3rd week of September.
US Market Update – S&P500
The S&P500 bounced from 6,343 support and managed to close just 10 points higher than last week. Above its previous week’s high of 6,481, it has the potential to test the 6,568 Fibonacci level. Investors in US markets should trail their stop-loss to 6,330 to safeguard profits.
Want me to review any index or cryptocurrency for you? Drop it in the comments and I’ll cover it in my next update!
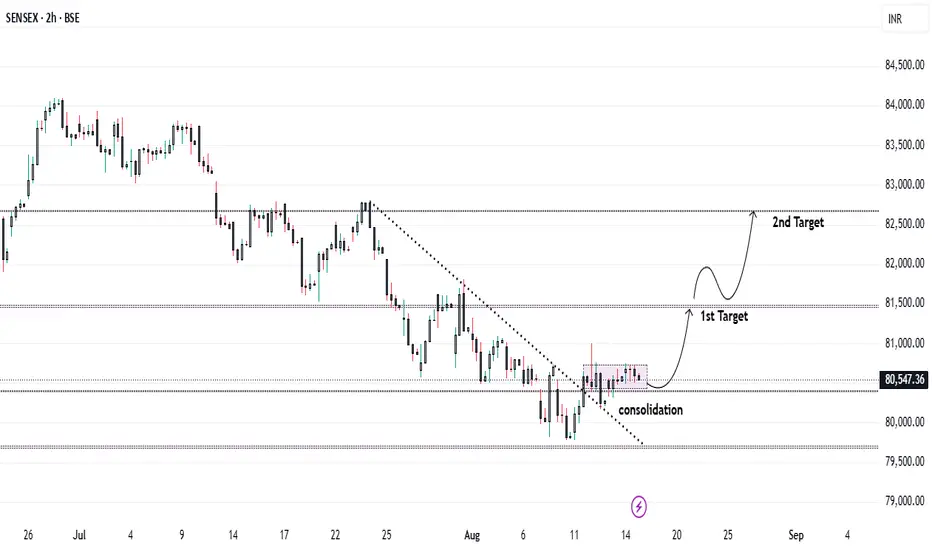
Can SENSEX Hit 82,600? Breakout + GST Reforms Explained.The SENSEX has successfully broken its downtrend and is now consolidating after a healthy retest, indicating strength and stability at current levels.
Key Macro Triggers
📊 Inflation Cooling:
* July CPI fell sharply to1.55%, the lowest since June 2017😮
* Food Inflation came in at -1.76%, down from -1.06% in June, signaling strong disinflationary trends.
This cooling inflation provides the RBI more room for policy support, boosting overall market sentiment.
⚖️ Policy Catalyst – GST Reforms by Diwali 2025:
In his Independence Day speech, PM Modi highlighted “Next-Gen GST Reforms,” which could act as a major structural trigger for the markets:
* 12% GST slab ➝ May shift to 5% 💡
* 28% GST slab ➝ May shift to 18% 📉
* New 40% slab** for sin goods (tobacco, beer, etc.)
These reforms, if implemented, would lower tax burdens, increase consumption, and improve corporate profitability**, setting the stage for a sustained equity rally.
Trade Setup – SENSEX
With strong macro tailwinds and technical breakout confirmation, we can look for long trades in the index:
* Entry: Current consolidation zone
* Stop Loss: Below recent retest level
* Target 1: 81,500
* Target 2: 82,600
⚠️ Risk Note:
While domestic triggers look favorable, Trump’s additional tariff policies could weigh on global risk sentiment and temporarily hinder momentum in Indian equities.
Sensex long setupSensex long setup
Entry - 80651
Stop loss - 80528.00
Target - 81093
Risk Reward - 1:3.6

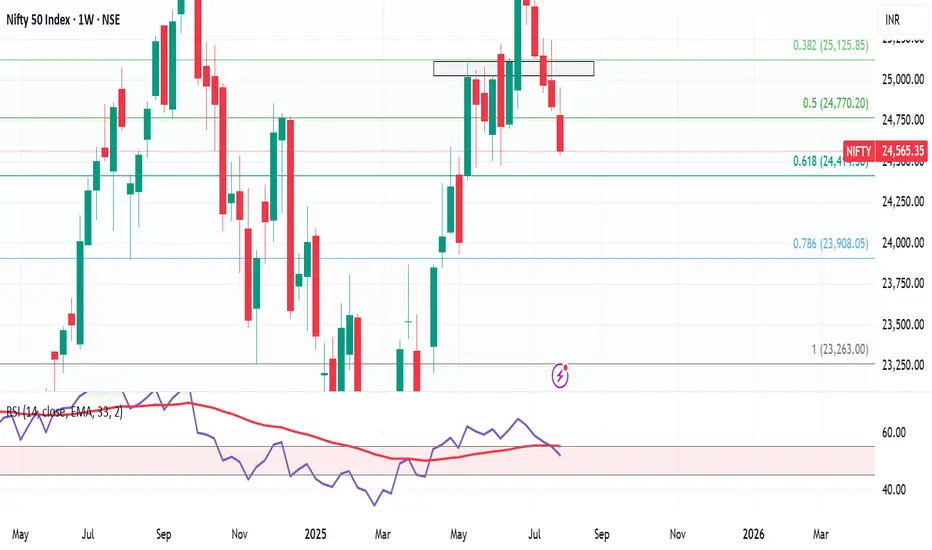
Weekly Market Wrap – Nifty Slides, Global Sentiment WeakensNifty ended the week on a bearish note, closing at 24,565, down 270 points or nearly 1.1% from last week's close. It touched a high of 24,956 and a low of 24,535, perfectly respecting the range I shared last week: 25,300–24,400.
As I highlighted earlier, the inverted hammer formation gave the bears an upper hand—and the index corrected 1.74% from the recent highs. My view continues to favor caution, with the expected trading range for the upcoming week at 25,000–24,100.
Key Levels to Watch:
Support Zone: 24,400 (key bounce area), followed by 24,100 / 23,900 in case of further breakdown.
Resistance Zone: Upside capped near 25,000.
If the market holds 24,400 around 6th–7th August, expect a short-term bounce. However, if this level is breached, expect dips to 24,100 or 23,900, which could offer short-covering opportunities.
Global Cues:
The S&P 500 also had a rough week, closing at 6,238, down 2.5% week-on-week. This decline sparked a wave of selling across global markets. The 6,200 level is crucial—if it holds, we might see a rebound globally, including in Indian equities. Below that, 6,100 remains the breakout retest zone, which I believe should provide some cushion.
💡 Strategy Going Forward:
Focus on stocks showing relative strength in this falling market—they’ll likely lead the rally once sentiment turns.
Avoid chasing rallies, and watch for signs of bottoming out near key support zones.
Keep an eye on global indices like the S&P 500 and Dow Jones, as their stability will dictate near-term direction for Indian markets.
Stay sharp, stay prepared. Let the bears have their moment, but be ready to pounce when the tide turns.
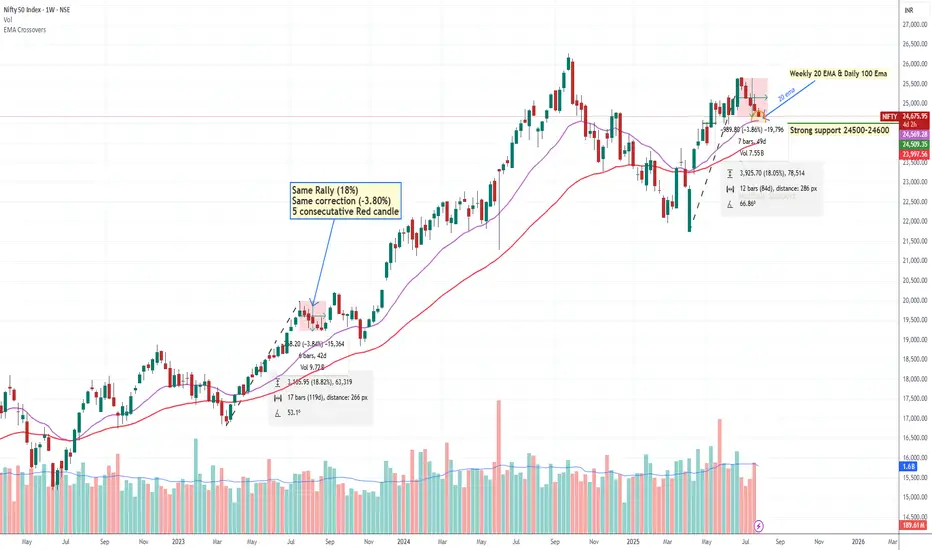
Nifty May Bouncing in Next Week We Are Expecting A bounce back from 24500-24600 level Why? let's Try to understand
(1) Nifty daily Chart 100 EMA
(2) Weekly Chart 200 EMA
(3) there is Multiple support testing around 24500 showing intuitional pending Order.
(4) Nifty bottom out with up move around 18 % & now We are seeing 5 Consecutive Falling
Weekly Candle same pattern happened in July 2023 when nifty Rallied around 18 % and there
was also correction around -3.80%.
(5) A 5-candle rule may apply (Means high possibility of bounce back or pullback if we got 5 consecutive candles either upside or downside)
This is pure technical analysis just based on market behaviour, pattern or historical data. not included any fundamental factor.
Trap Set at the Top? Sensex Sell-Side Objective = 81,886Sensex is currently trading at 82,220 and showing early signs of a potential sell-side move based on Smart Money dynamics. After grabbing buy-side liquidity above recent highs, we’ve now entered a distribution phase.
Price has shown rejection from a premium zone, and a market structure shift is forming on lower timeframes — all pointing toward a probable move to the sell-side liquidity pool near 81,886.
This zone aligns with Smart Money's objective to tap resting liquidity below recent swing lows before any major reversal. Caution is advised for longs. Wait for confirmation if you're planning to ride the short move with the institutions. 🎯💼

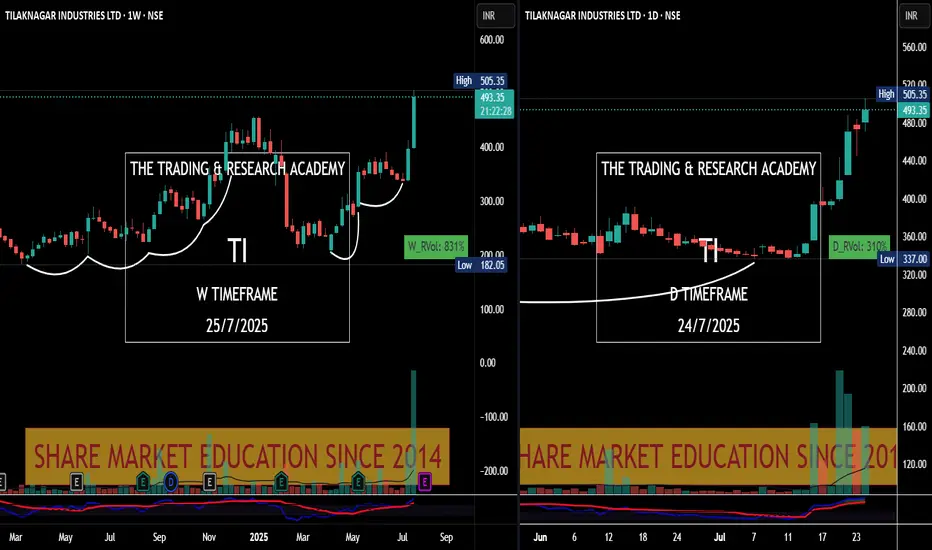
Chart Speaks- Tilak Nagar Ind
#Price leads the #News! Tilak Nagar Ind #tilaknagar see the chart v/s News.
News came yesterday, have a look at chart. Someone was accumulating it since long.
Chart Speaks
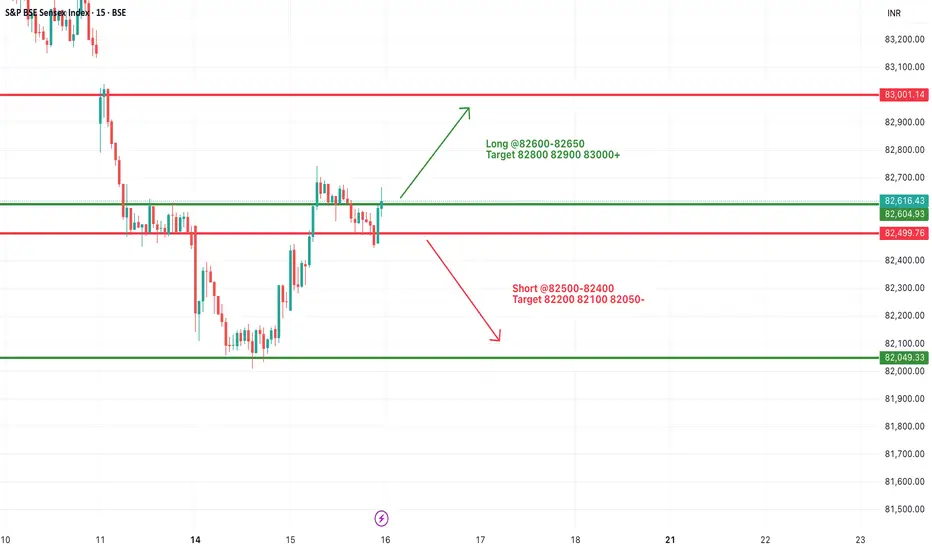
#SENSEX Intraday Support and Resistance Levels - 16/07/2025Sensex is expected to open flat near the crucial 82600–82650 resistance zone, which has acted as a turning point multiple times recently. A sustained move above this range may trigger bullish momentum toward 82800, 82900, and even 83000+. This move would indicate a positive continuation after the recovery seen from recent lows.
However, if the index faces rejection around 82600–82650, it may once again slip below 82500, opening the door for short-side opportunities with targets at 82200, 82100, and 82050. This region has seen a lot of price action over the last few sessions, so volatility may be higher.
#SENSEX Intraday Support and Resistance Levels - 15/07/2025Sensex is likely to kick off the session with a gap-up opening around the 82500 level, reflecting early bullish momentum. If this initial strength holds and the index begins to build above the 82600–82650 zone, it could signal the start of a recovery leg toward higher resistance levels at 82800, 82900, and potentially 83000+. Sustained action above 82650 may encourage momentum traders to chase strength during the day.
However, the 82500–82650 range will act as a battleground. Failure to defend this zone could invite selling pressure. A breakdown below 82500 may expose the index to intraday weakness, opening downside targets at 82200, 82100, and even 82050. In this case, expect volatility to increase near support levels.
Traders should approach with a flexible strategy—watching for breakout confirmation above 82650 or signs of reversal pressure below 82500. Today’s early range could set the tone for the entire session.

#SENSEX Intraday Support and Resistance Levels - 14/07/2025Sensex is likely to open slightly gap-down, reflecting weakness carried over from the previous session. The index is currently trading near the 82450 zone. A breakdown below the 82400 level may trigger further downside movement, with potential support targets at 82200, 82100, and 82000. This zone should be monitored closely for continuation or reversal.
On the upside, any strong recovery above the 82600–82650 level could push the index higher, with resistance targets at 82800, 82900, and 83000+. Sustaining above this range may indicate buying interest returning in the market.
If Sensex spikes toward the 82950–83000 zone and faces resistance, a reversal from there could create shorting opportunities with targets at 82800, 82700, and 82600. However, a clear breakout above 83000 would negate this short setup and shift the bias to bullish.
The index is currently in a consolidation zone, and price action around 82600–82400 will be critical to determine the day’s direction.

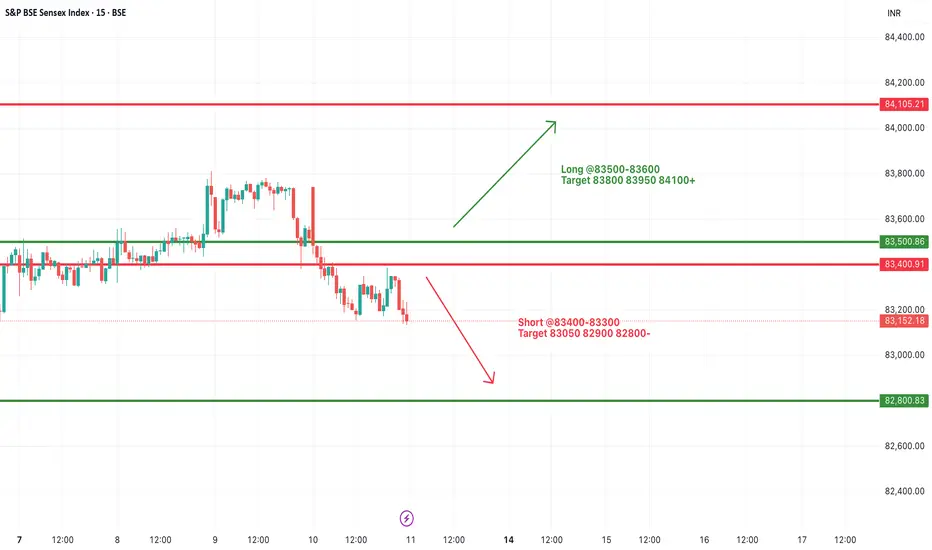
#SENSEX Intraday Support and Resistance Levels - 11/07/2025Sensex is expected to open flat after a consolidation phase and weak closing in the previous session. The index is currently hovering near the support zone of 83400–83300. If Sensex breaks and sustains below this level, further downside may unfold toward 83050, 82900, and 82800. This level should be watched closely as a decisive break may trigger increased selling pressure.
On the upside, a recovery and breakout above 83500–83600 could indicate a potential reversal. Sustaining above this zone can lead the index to rally toward 83800, 83950, and possibly 84100+. However, the price action near this resistance band will be crucial for any confirmation of bullish strength.
Overall, the sentiment remains weak with a bearish bias unless a strong breakout happens on the upside. Traders should remain cautious and focus on these breakout levels for intraday opportunities with proper risk management.