RIVER/USDT Analysis. Potential Long Setup
After a prolonged decline, buying activity is beginning to dominate again. A strong volume support level has formed in the $17.5–$16.5 zone.
If price retests this area and buyer reaction appears, a long position can be considered with a target at the technical level of $24.8.
This publication is not financial advice.
Setup

MSTR - How to profit from a $140 short target🔱 The MS ponzi is taking its toll. 🔱
I’m not laughing, because it’s genuinely unfortunate for everyone who believed in this scam.
But today, I don’t want to rant about that.
I want to show how one could profit from a potential drop of more than $100.
As an Andrews Pitchfork trader, I know there’s roughly an 80% chance that price will reach the centerline. From there, price either reverses in the opposite direction or breaks through the centerline to continue its journey.
That’s exactly what happened with MSTR.
You can see how the price first reached the centerline, held there a few times, and then broke it. Since then, it’s been following the rulebook by moving further to the downside.
Now, there’s another rule worth remembering:
price often tests or retests the line it just broke.
In our case, that line is the centerline.
This means we could be lucky enough to get a pullback to the centerline, and that would be a good level to consider shorting.
The target is usually the opposite line of the centerline, which in our case is the L-MLH (Lower Median Line Parallel).
👉 If you want to learn the full framework and its rules, check the links for free material.
I hope this helps many of you, and I wish you all good profits.

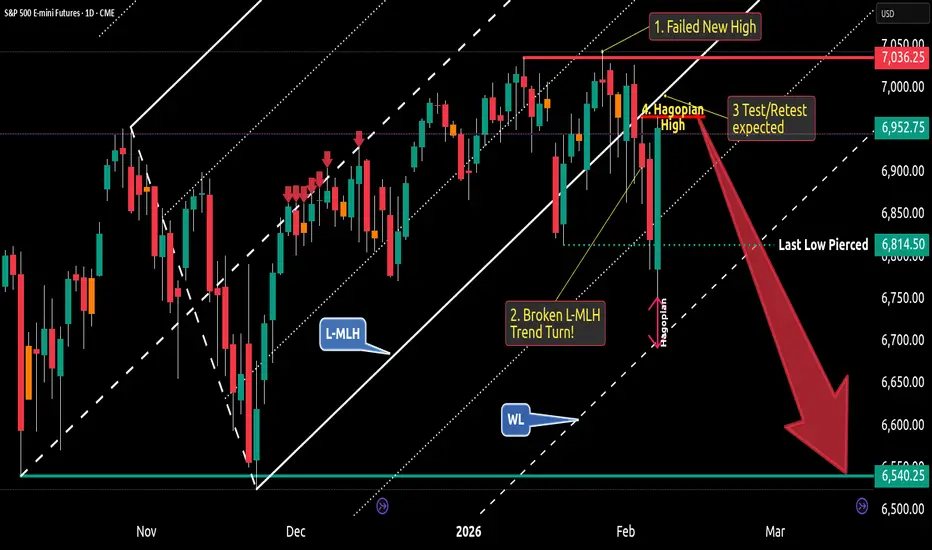
S&P500 Bearish Trend Turn - Here's My Short Trade🔱 As long as price follow the projection of a pitchfork, the trend is OK. But what we see here is a turn - and here's why:
1. The market failed to close above the last high. So, this is a failed new high - or a Double-Top
It is confirmed because the last low is pierced by the last Fridays bar.
2. Price opened & closed below the Lower-Medianline-Parallel = The projection of the fork, which shows the temporary trend, is clearly broken. And this means: Temporary Trend Turn.
3. What we see now with last Fridays bar is a expected Test/Retest of the L-MLH. It's also a slap in the face of early Bears.
4. And if you dig really deep, you also see the Hagopian against the Warning-Line (WL), which confirms the thesis of the Test/Retest of the L-MLH. Because Hagopian says, that price will go farther in the opposite direction than from where price came. In clear words: Price will go higher than the "Hagopian High". And to be precise, I expect the S&P500 to test the L-MLH.
So, week Short hands are completely clueless now. How can it be that price pulls back so hard...?
Thank God I'm trading with the pitchfork. They give me clear rules. And I never have to doubt, because there is zero subjectivity involved.
Can price go higher than the last high at 1. ?
Sure, everything is possible. But - It's not likely to happen, my Pitchfork rules say.
My trade?
I will observe price-action at the L-MLH.
As soon as the markets show it's hand by clear weakness, I'm loading my Boat to the Short side.
My exit? If a full bar is closing above the last high at 1.
There you have it.
👉 FYI: I'm NOT a signal service. I provide educational content. If you want to learn more about trading with the Pitchforks/Medianlines, I'm here for you to help. And of course you can always check out all my links where you find helpful, educational material.
I hope this helps and I wish you all a great and profitable new week.
Nasdaq Centerline Target at 24'220NQ has host everything what is called support.
My target is the 24120 at the Cetnerline.
On a complete flush, further lower targets would be the white Centerline around 23'500.
Time until it hit's the 24220?
I have no cristal bowl. But for each day it takes, I'll move the target even lower, attached to the Centerline.
Since I play this with Options, I don't have a hard Stop/Loss, just risking what my risk-management allowes me in my account.
!! Trade small - It could snap back anytime !!
Stay save
Emilio

BTC/USDT Analysis. A Logical Continuation of the Decline
Hello everyone! This is the CryptoRobotics trader-analyst with your daily market update.
Yesterday, the expected downside scenario played out, although we did not see liquidity taken above the $79,500 level. After a short consolidation within the $77,400–$79,400 range, price continued downward and swept liquidity below the local low.
During the breakdown, strong selling pressure was absorbed, followed by a confident rebound that pushed price back above the broken level. This creates an interesting setup for a speculative long position, as continued selling pressure is failing to produce further downside results.
We consider long positions on a retest of the selling absorption zone at $75,000–$74,000 if buyer reaction appears. The nearest upside target in this case is the $80,000 area.
Buy Zones
$75,000–$74,000 (selling absorption)
$72,200–$56,000 (daily buy zone)
Sell Zones
$82,000–$85,500 (volume anomalies)
$87,000–$88,000 (selling pressure)
$92,600–$93,500 (volume anomalies)
$96,000–$97,500 (selling pressure)
$101,000–$104,000 (accumulated volumes)
This publication is not financial advice.

Microsoft - Struggling with a decision?OK, let me give you my 5 cents.
In this weekly chart analysis, the white up-sloping Pitchfork initially projected a sustained bullish journey for Microsoft. Early price action saw the stock blow through the Center Line (CL) before finding temporary resistance and turning at the upper 1/4 Line.
From that peak, the Centerline of the white fork became the primary downside target. Upon closer inspection, price action stalled briefly at this level before decisively breaking through to the downside. While bulls attempted to reclaim the CL, the sheer market pressure proved too great, there simply wasn't enough "Gas In The Goose" to maintain the upward trajectory.
Once price slipped below the white Centerline, it signaled the necessity of drawing a red Pullback Pitchfork to project targets for a potential short trade. Technical probability suggests an 80% chance of price reaching the Centerline of a new fork, a target we have now successfully hit.
The intensity of the sell-off was notable; the "bear crowd" took total control, driving MSFT lower than the Lower Median Line Parallel (L-MLH). This decline was exacerbated by the broader market immediate sell-off in the S&P 500 and Nasdaq, leaving Microsoft vulnerable to systemic macro pressure.
Current Outlook & Price Targets
Immediate Resistance: If we close the week below the lower white MLH, I expect a short-term relief rally or "pull-back" to retest that line from below.
Downside Support: A failure to reclaim that level points toward the second white-dashed Warning Line of the original Pitchfork.
The "Dip-Buy" Caution: Traders should note that the Warning Line is not a guaranteed floor. There is a secondary, lower target at the red Lower Median Line Parallel (L-MLH).
Currently, the technical structure suggests significant downside potential remains. I will continue to monitor these levels closely. Members will receive updates as soon as a high-probability trade opportunity emerges.
If you like this post, then follow and boost my analysis - thanks very much.
Wishing you a happy day
Emilio
- Control risk with proper position sizing, not hope or guesswork.
- If you want the fundamentals too, just check out my links

A Nasdaq Scalp With 2 Opposing ForcesWhat I'm looking for is a simple daily Bread & Butter Trade.
My RealSwings show me the Trend. The Orange Fork is projecting it to the downside too.
Notice the touches at the orange Center-Line.
Price respects the Pitchfork.
I'm stalking a long Trend.
It's a counter Trend trade and I know that probabilities are somewhat lower than I could trade with the direction of the Trend.
Here's the 5min. where I enter the trade:
My target is the Pullback of the white Centerline, which gives me a good Risk/Reward Ratio.
Let's see if we get stopped-in to the Trade.

Palantir - The short signal from the PitchforkPalantir is great for trading with the Alan Andrews Pitchfork.
Palantir follows the Pitchfork rulebook very accurately. This builds confidence, helps me stick to my trading plan, and ultimately leads to solid profits.
This time, Palantir gave me a new signal to the short side. Since I like to play this with LEAP options, I bought two ITM puts and sold one OTM put to harvest some theta if the market goes sideways.
A LEAP with a delta above 70 does not really lose much value if price goes sideways or drifts down.
From a psychological perspective, this structure is excellent for me. I know I have time in this trade, I can execute my plan, and my capital is not exposed to unnecessary risk.
A word about the 2:1 ratio:
The benefit of buying two options while selling only one is that it leaves the door open for larger profits. If price moves deep ITM on the sold put, there is still one long put that can continue to print money.
But what if price trades back into the pitchfork?
In that case, the sold put offsets part of the losses. With this mechanism in place, I can withstand a drawdown even longer.
So it is, in a way, the best of everything:
I get exposure to Palantir
I limit and hedge my risk partially
I have plenty of time with the LEAPs
I keep the door open for substantial profits
All in all, a good trade to pick up with a fork.
Happy weekend to you all and don't forget to check my Profile settings to the right.

NZDJPY dips continue to attract buyers.NZDJPY - 24h expiry
Intraday dips continue to attract buyers and there is no clear indication that this sequence for trading is coming to an end.
Daily signals are bullish.
20 1day EMA is at 91.75.
Risk/Reward would be poor to call a buy from current levels.
Dip buying offers good risk/reward.
We look to Buy at 91.85 (stop at 91.35)
Our profit targets will be 93.35 and 93.65
Resistance: 93.27 / 94.03 / 94.50
Support: 92.06 / 91.41 / 91.00
Risk Disclaimer
The trade ideas beyond this page are for informational purposes only and do not constitute investment advice or a solicitation to trade. This information is provided by Signal Centre, a third-party unaffiliated with OANDA, and is intended for general circulation only. OANDA does not guarantee the accuracy of this information and assumes no responsibilities for the information provided by the third party. The information does not take into account the specific investment objectives, financial situation, or particular needs of any particular person. You should take into account your specific investment objectives, financial situation, and particular needs before making a commitment to trade, including seeking, under a separate engagement, as you deem fit.
You accept that you assume all risks in independently viewing the contents and selecting a chosen strategy.
Where the research is distributed in Singapore to a person who is not an Accredited Investor, Expert Investor or an Institutional Investor, Oanda Asia Pacific Pte Ltd (“OAP“) accepts legal responsibility for the contents of the report to such persons only to the extent required by law. Singapore customers should contact OAP at 6579 8289 for matters arising from, or in connection with, the information/research distributed.

Gold Short Trade - IntradayThis intraday trade should be quick and short, as soon as Bulls starts to give up.
1. Price reached the orange CL
2. Price left the L-MLH
3. Pullback to L-MLH expected and fullfilled.
4. Price weakens after Test/Retest of L-MLH
Short with no doubt, just following the rules.
Subscribe for my Newsletter §8-)

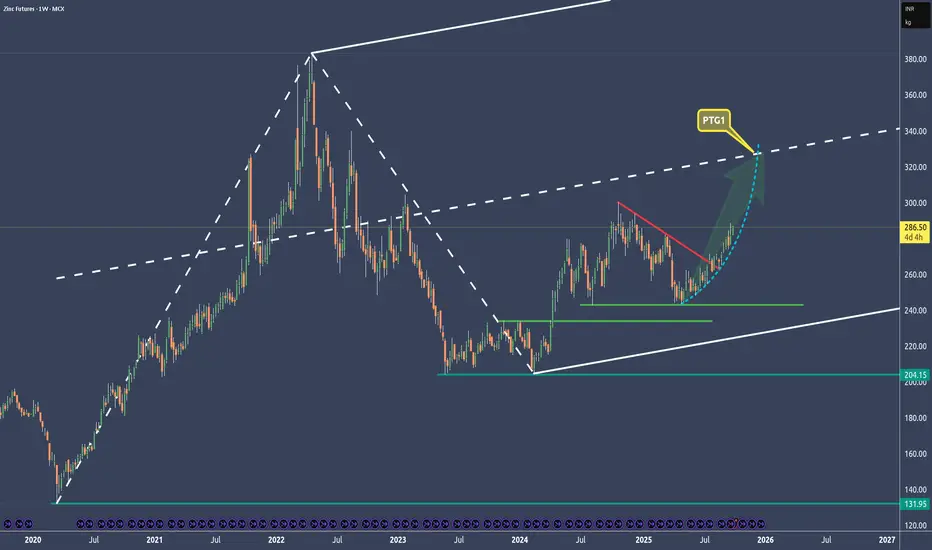
Zinc - Exponential Move To Profit Along With Copper🔱 I posted about copper and zinc on Sep 17. 🔱
Both are closely correlated, and now zinc is moving exponentially.
The target is at the centerline of course with around an 80% probability.
👉 If you think that these forks are doing a good job, then throw me booster please and check out my links. §8-)
Bitcoin lost it's support completelyOh my…
Here we are again: opening and closing below the centerline. The CIB line is broken as well.
This is now the second time Bitcoin has lost the centerline support. Before that happened, it gave us a Hagopian - a large one.
I stand by my target of 60K, unless a miracle comes down from crypto heaven.
Happy new trading week y'all.

TheGrove | GBPUSD SELL | Day Trading AnalysisYou can expect a reaction in the direction of selling from the specified Breakout zone
GBPUSD moving higher as it tests the strong resistance area..
We expect a bearish move from the confluence zone.
Hello Traders, here is the full analysis.
I think we can soon see more fall from this range! GOOD LUCK! Great SELL opportunity GBPUSD
I still did my best and this is the most likely count for me at the moment.
-------------------
Traders, if you liked this idea or if you have your own opinion about it, write in the comments. I will be glad 🤝

TheGrove | USDJPY Buy | Idea Trading AnalysisUSDJPY is falling towards a support level which is a pullback support and could bounce from this level to our take profit.
We expect a decline in the channel after testing the current level which suggests that the price will continue to rise
Hello Traders, here is the full analysis.
I think we can soon see more fall from this range! GOOD LUCK! Great BUY opportunity USDJPY
I still did my best and this is the most likely count for me at the moment.
-------------------
Traders, if you liked this idea or if you have your own opinion about it, write in the comments. I will be glad 🤝

$RIVN Deep Retracement StructurePullback Into Key Zone
NASDAQ:RIVN has worked its way down into a technically significant retracement area that's catching my attention. We're seeing price test a mathematically-derived support zone that often marks the limit of healthy pullbacks in trending conditions.
The Technical Setup
Retracement Level:
Price is currently testing the 78.6% retracement level from the recent swing structure. This deep Fibonacci pullback zone around the $16 area represents where buyers historically step in to defend the larger move.
The 78.6% level is one of the deeper retracement ratios—when price holds here, it often signals that the underlying trend remains intact and that this is simply a correction rather than a reversal.
200-Day EMA Context:
Just below current levels, we have the 200-day EMA sitting around $14.30. This widely-watched moving average provides additional structural context and serves as a logical invalidation point for any bullish thesis.
If price were to close convincingly below the 200 EMA, it would suggest the correction is deeper than a standard retracement and the setup would be invalidated.
Risk-to-Reward Framework
What makes this particularly compelling is the asymmetric opportunity:
Defined Risk:
Stop placement below the 200-day EMA at approximately $14.30 creates a clear invalidation level. This represents logical downside if the retracement thesis is wrong.
Measured Upside Potential:
Extension back toward prior swing highs in the $22.50 zone provides the upside target. Measuring from current levels to the target, relative to the defined risk, gives us approximately 4:1 risk-to-reward ratio.
That's exceptional asymmetry risking one unit for the potential to gain four if the structure plays out.
Why This Area Matters
Confluence of Support:
78.6% Fibonacci retracement level
$16 psychological round number
Proximity to 200-day EMA support
Prior consolidation zone that could now act as support
When multiple technical factors align in the same area, it increases the probability that price respects the zone.
Swing Structure Logic:
Deep pullbacks that hold at the 78.6% level often produce strong reversionary moves back toward the prior high. This isn't random it's a function of how trend corrections tend to behave when the larger structure remains intact.
What I'm Watching
Price acceptance at the $16 zone - Need to see buyers defend this level
200 EMA behavior - Watching whether price holds above or violates this support
Volume on any bounce - Looking for increasing participation if reversal begins
Candle structure - Monitoring for reversal patterns or rejection wicks at current levels
The Measured Move
From the retracement low around $16, back to prior highs at $22.50, represents approximately $6.50 of potential upside movement.
With risk defined below $14.30, that's roughly $1.70 of downside if stopped out.
$6.50 potential gain vs $1.70 potential loss = 4R setup
This is the kind of reward-to-risk profile worth evaluating closely.
Position Considerations
Entry Zone: Current levels around the 78.6% retracement offer logical entry consideration
Invalidation Point: A close below the 200-day EMA would negate the retracement thesis
Target Projection: Return to prior swing highs represents the measured completion of the reversal
For specific entry techniques, scaling strategies, and detailed position management, full parameters will be available inside our trading room.
The Bigger Picture
This setup exemplifies proper swing structure analysis:
Identify a clear trend
Wait for a deep but proportional retracement
Find confluence at a key technical level
Define risk below structural support
Measure potential back to prior resistance
Evaluate if the risk-to-reward justifies the position
When all these elements align, you get setups like this high probability, asymmetric opportunities with defined parameters.
Patience Required
Retracement plays require patience. Price might consolidate at this level before reversing. It might test lower toward the 200 EMA before bouncing. The key is having a plan and letting the structure develop.
Don't chase let the level prove itself. If it holds and confirms, the 4R potential makes the wait worthwhile.
This analysis is for educational purposes and represents personal technical observations. All trading involves substantial risk. Fibonacci retracements and moving averages are tools for analysis, not guarantees of future price movement. Always conduct independent research and apply appropriate risk management to any positions.

BTC/USDT Analysis. Local Long Scenario Remains Valid
Hello everyone! This is the CryptoRobotics trader-analyst team with our daily market update.
Yesterday, Bitcoin swept liquidity below local lows, tested the $88,600–$88,000 (sell-side absorption) zone, and posted a modest bounce.
At the moment, market activity has declined and buyers are not showing strong initiative. This keeps the probability of a repeated false breakdown of the recently formed low near $88,500 on the table. If this scenario plays out, we remain aligned with the previously outlined local long plan and continue to target a move toward the key resistance zone at $92,600–$93,500 (volume anomalies) over the coming days.
If there is no clear buyer reaction near the local low, opening long positions would be unjustified — in that case, downside pressure may extend toward the next support areas.
Buy Zones
$88,600–$88,000 (sell-side absorption)
$86,000–$84,800 (anomalous activity)
$84,000–$82,000 (strong volume anomalies)
Sell Zones
$91,000–$91,700 (untested seller volume)
$92,600–$93,500 (volume anomalies)
$96,000–$97,500 (selling pressure)
$101,000–$104,000 (accumulated volume)
This publication is not financial advice.

GBPNZD short term bias remains negative.GBPNZD - 24h expiry
There is no clear indication that the downward move is coming to an end.
Although we remain bearish overall, a correction is possible without impacting the trend lower.
Risk/Reward would be poor to call a sell from current levels.
A move through 2.2825 will confirm the bearish momentum.
The measured move target is 2.2775.
We look to Sell at 2.2900 (stop at 2.2950)
Our profit targets will be 2.2800 and 2.2775
Resistance: 2.2850 / 2.2900 / 2.2950
Support: 2.2825 / 2.2800 / 2.2775
Risk Disclaimer
The trade ideas beyond this page are for informational purposes only and do not constitute investment advice or a solicitation to trade. This information is provided by Signal Centre, a third-party unaffiliated with OANDA, and is intended for general circulation only. OANDA does not guarantee the accuracy of this information and assumes no responsibilities for the information provided by the third party. The information does not take into account the specific investment objectives, financial situation, or particular needs of any particular person. You should take into account your specific investment objectives, financial situation, and particular needs before making a commitment to trade, including seeking, under a separate engagement, as you deem fit.
You accept that you assume all risks in independently viewing the contents and selecting a chosen strategy.
Where the research is distributed in Singapore to a person who is not an Accredited Investor, Expert Investor or an Institutional Investor, Oanda Asia Pacific Pte Ltd (“OAP“) accepts legal responsibility for the contents of the report to such persons only to the extent required by law. Singapore customers should contact OAP at 6579 8289 for matters arising from, or in connection with, the information/research distributed.

TheGrove | GBPCAD SELL | Idea Trading AnalysisGBPCAD broke down sharply from the rising channel, confirming a bearish. the impulsive sell-off invalidated prior bullish structure and pushed price below key intraday supports.
GBPCAD is moving on Resistance area..
The chart is above the support level, which has already become a reversal point twice.
We expect a decline in the channel after testing the current level.
We expect a decline in the channel after testing the current level
Hello Traders, here is the full analysis.
I think we can soon see more fall from this range! GOOD LUCK! Great SELL opportunity GBPCAD
I still did my best and this is the most likely count for me at the moment.
-------------------
Traders, if you liked this idea or if you have your own opinion about it, write in the comments. I will be glad ⚜️

GBPAUD to continue in the downward move?GBPAUD - 24h expiry
There is no indication that the selloff is coming to an end.
Daily signals for sentiment are at oversold extremes.
Offers ample risk/reward to sell at the market.
The lack of interest is a concern for bulls.
Our outlook is bearish.
We look to Sell at 1.9875 (stop at 1.9935)
Our profit targets will be 1.9695 and 1.9655
Resistance: 1.9886 / 1.9950 / 2.0050
Support: 1.9823 / 1.9750 / 1.9700
Risk Disclaimer
The trade ideas beyond this page are for informational purposes only and do not constitute investment advice or a solicitation to trade. This information is provided by Signal Centre, a third-party unaffiliated with OANDA, and is intended for general circulation only. OANDA does not guarantee the accuracy of this information and assumes no responsibilities for the information provided by the third party. The information does not take into account the specific investment objectives, financial situation, or particular needs of any particular person. You should take into account your specific investment objectives, financial situation, and particular needs before making a commitment to trade, including seeking, under a separate engagement, as you deem fit.
You accept that you assume all risks in independently viewing the contents and selecting a chosen strategy.
Where the research is distributed in Singapore to a person who is not an Accredited Investor, Expert Investor or an Institutional Investor, Oanda Asia Pacific Pte Ltd (“OAP“) accepts legal responsibility for the contents of the report to such persons only to the extent required by law. Singapore customers should contact OAP at 6579 8289 for matters arising from, or in connection with, the information/research distributed.

NZDUSD to continue in the upward move?NZDUSD - 24h expiry
There is no clear indication that the upward move is coming to an end.
Although we remain bullish overall, a correction is possible with plenty of room to move lower without impacting the trend higher.
Risk/Reward would be poor to call a buy from current levels.
A move through 0.5850 will confirm the bullish momentum.
The measured move target is 0.5900.
We look to Buy at 0.5820 (stop at 0.5785)
Our profit targets will be 0.5895 and 0.5900
Resistance: 0.5850 / 0.5875 / 0.5900
Support: 0.5820 / 0.5800 / 0.5785
Risk Disclaimer
The trade ideas beyond this page are for informational purposes only and do not constitute investment advice or a solicitation to trade. This information is provided by Signal Centre, a third-party unaffiliated with OANDA, and is intended for general circulation only. OANDA does not guarantee the accuracy of this information and assumes no responsibilities for the information provided by the third party. The information does not take into account the specific investment objectives, financial situation, or particular needs of any particular person. You should take into account your specific investment objectives, financial situation, and particular needs before making a commitment to trade, including seeking, under a separate engagement, as you deem fit.
You accept that you assume all risks in independently viewing the contents and selecting a chosen strategy.
Where the research is distributed in Singapore to a person who is not an Accredited Investor, Expert Investor or an Institutional Investor, Oanda Asia Pacific Pte Ltd (“OAP“) accepts legal responsibility for the contents of the report to such persons only to the extent required by law. Singapore customers should contact OAP at 6579 8289 for matters arising from, or in connection with, the information/research distributed.

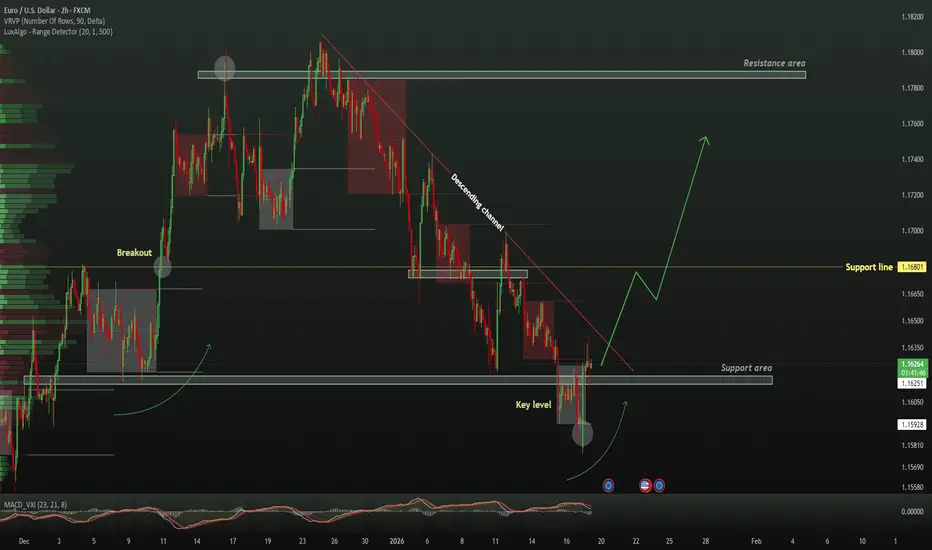
TheGrove | EURUSD Buy | Idea Trading AnalysisEURUSD is falling towards a support level which is a pullback support and could bounce from this level to our take profit.
We expect a decline in the channel after testing the current level which suggests that the price will continue to rise
Hello Traders, here is the full analysis.
I think we can soon see more fall from this range! GOOD LUCK! Great BUY opportunity EURUSD
I still did my best and this is the most likely count for me at the moment.
-------------------
Traders, if you liked this idea or if you have your own opinion about it, write in the comments. I will be glad 🤝
ES (SPX, SPY) Analysis, Key Levels, Setup for Tue (Jan 20)U.S. cash markets paused on Monday in observance of Martin Luther King Jr. Day, but trading on the Globex platform displayed pronounced volatility amid soaring U.S.-EU trade tensions focused on Greenland. The E-mini S&P 500 (ES) saw a decline of approximately 1.1% from Friday's close, while the Nasdaq-100 (NQ) lagged further, dropping 1.4%. In a shift towards safe-haven assets, gold prices surged to an all-time high of $4,660, driven by a weakening U.S. dollar and strong performance from the Swiss franc.
The catalyst behind the market's movement was President Trump’s announcement of a 10% tariff on eight European NATO allies specifically Denmark, the UK, France, Germany, the Netherlands, Norway, Sweden, and Finland set to take effect on February 1. This tariff is scheduled to escalate to 25% by June 1 unless an agreement regarding Greenland is reached. In response, the EU has activated an emergency protocol and is deliberating potential countermeasures.
Treasury Secretary Bessent, speaking at the World Economic Forum in Davos, expressed optimism about the U.S. economy, stating, “We expect investment to accelerate this year.”
FORECAST
BIAS: Neutral-to-Bearish (Short-Term)
OVERNIGHT THOUGHTS: The Asia and Europe trading sessions are anticipated to test recent overnight lows, with potential for unsuccessful dip-buying efforts at resistance levels.
TUESDAY NY SESSION OUTLOOK: As U.S. traders return to the markets, they will react to the weekend’s accumulated news. An initial attempt at short-covering is expected, likely followed by renewed selling pressure. Failed rallies in the 6920-6935 range may further exacerbate the downward trend.
BULLISH SCENARIO (30% likelihood): A retraction back to 6923 that holds could lead to a gap fill toward the 6950-6960 area.
BEARISH SCENARIO (50% likelihood): A failed rebound at resistance may signal a continuation down to the 6870-6850 discount zone.
CHOPPING SCENARIO (20% likelihood): The market may remain range-bound between 6887-6920 while awaiting clearer catalysts.
INVALIDATION POINT: A sustained break above 6950 would shift the bias towards bullish.
HIGH-IMPACT SCHEDULED ITEMS (ET)
09:30 - US cash equities reopen after MLK Day closure (gap-and-go risk; repricing of Greenland tariff headlines that built up while cash was shut)
10:00 - Supreme Court session begins. Oral arguments scheduled: Wolford v. Lopez (2A), M&K Employee Solutions v. Trustees (pension). Opinions possible but not guaranteed - the tariff case (Learning Resources v. Trump) ruling could drop any session. Court did not pre-commit which decisions will be released. Last courtroom session until Feb 20.
11:30 - Treasury bill auctions (supply event; can jolt front-end yields and spill into ES via rates):
6-week bill auction (announced Thu prior)
4-week/8-week bills settle Tuesday per standard pattern
52-week bill auction possible (every 4 weeks on Tues)
16:01 - Netflix (NFLX) Q4 earnings release - HIGH IMPACT
16:15 - Fed H.10 Foreign Exchange Rates (pushed from holiday)
16:45 - Netflix earnings interview begins
After the close (earnings beta into index futures):
Netflix (NFLX) - major index weight, sentiment driver
United Airlines (UAL)
Interactive Brokers (IBKR)
US Bancorp (USB)
Fifth Third (FITB)
KeyCorp (KEY)
Before the open (also relevant if you trade the open):
3M (MMM)
DR Horton (DHI)
Fastenal (FAST)
WHAT IS NOT ON THE CALENDAR (STILL IMPORTANT)
No top-tier BEA macro prints (GDP/PCE/Income) scheduled for Tue Jan 20 per BEA release schedule
No major BLS releases scheduled for Tue Jan 20 per BLS January schedule
No FOMC meeting - next meeting is Jan 27-28
Fed note: Daily/weekly statistical releases scheduled on the holiday (Mon) are pushed to Tuesday - H.10 at 4:15 PM, H.8 on Thu. Can nudge rates/liquidity expectations.
Trump v. Cook (Fed's Cook firing case) oral arguments are Wednesday Jan 21 - could create Fed-related headline risk heading into that session
WATCH LIST (UNSCHEDULED BUT HIGH PROBABILITY)
EU tariff retaliation announcement - emergency meeting concluded, response expected
Trump/Bessent comments from Davos
Any SCOTUS tariff ruling leak or rel
Good Luck !!!

NZDJPY to form a higher high?NZDJPY - 24h expiry
Trend line resistance is located at 91.95.
Early optimism is likely to lead to gains although extended attempts higher are expected to fail.
Short term momentum is bullish.
Prices expected to stall near trend line resistance.
Expect trading to remain mixed and volatile.
We look to Sell at 91.95 (stop at 92.31)
Our profit targets will be 90.91 and 90.61
Resistance: 91.80 / 92.00 / 92.50
Support: 91.20 / 90.62 / 89.97
Risk Disclaimer
The trade ideas beyond this page are for informational purposes only and do not constitute investment advice or a solicitation to trade. This information is provided by Signal Centre, a third-party unaffiliated with OANDA, and is intended for general circulation only. OANDA does not guarantee the accuracy of this information and assumes no responsibilities for the information provided by the third party. The information does not take into account the specific investment objectives, financial situation, or particular needs of any particular person. You should take into account your specific investment objectives, financial situation, and particular needs before making a commitment to trade, including seeking, under a separate engagement, as you deem fit.
You accept that you assume all risks in independently viewing the contents and selecting a chosen strategy.
Where the research is distributed in Singapore to a person who is not an Accredited Investor, Expert Investor or an Institutional Investor, Oanda Asia Pacific Pte Ltd (“OAP“) accepts legal responsibility for the contents of the report to such persons only to the extent required by law. Singapore customers should contact OAP at 6579 8289 for matters arising from, or in connection with, the information/research distributed.
