ETH Support Bounce With Target at 3250Ethereum is trading above a key support level after a strong downward move. Price is showing early signs of a potential bullish correction, with projections pointing toward a possible recovery target around $3250. A break above minor resistance could confirm upward momentum.
Setup

EUR/USD - Repeat of 2015 Cycle?🔁 Is History Repeating Itself on EUR/USD?
(Monthly timeframe breakdown — impulse, consolidation, sweep, impulse, pullback… all lining up again)
Your chart highlights two major market cycles, years apart, that look almost identical in structure. Let’s walk through it clearly.
✅ 1. First Cycle (2015–2018)
A) Consolidation Phase (Orange Box)
Price moved sideways for months.
No clear direction — accumulation/distribution.
Market was building energy.
B) Sweep / Manipulation
Price dipped below consolidation lows (labelled X).
Classic liquidity grab.
Smart money entry zone.
C) Impulse Phase (Green)
Strong bullish move immediately after the sweep.
Buyers stepped in aggressively.
Market structure shifted bullish.
D) Pullback Phase (Red)
First correction after the strong impulse.
Healthy sign — market resetting before continuation.
This forms the classic 4-step macro cycle:
👉 Consolidation → Sweep → Impulse → Pullback
✅ 2. Current Cycle (2023–2025)
Your right-side circle mirrors the exact same pattern.
A) Consolidation Phase (Orange Box)
Range-bound market identical to 2015–2016.
Energy building again.
B) Sweep / Manipulation
Price runs liquidity under the range.
Same "grab the lows before reversing" behaviour.
C) Impulse Phase (Green)
Strong bullish run out of the sweep.
Again, identical structure as the previous cycle.
D) Pullback Phase (Red)
Market currently correcting.
Exactly like the 2017 correction before continuation.
🔥 3. Are We Literally Repeating the Same Playbook?
Yes — the structure is almost a 1:1 replica.
Both cycles show:
✔ Long consolidation
✔ Sweep of the lows
✔ Major bullish impulse
✔ Initial corrective pullback
This suggests that EUR/USD is following the same macro script it used last time before rallying even further.
📈 4. What This Might Mean for Traders
If history continues to rhyme:
The current pullback may be the “reset” before another bullish leg.
The last time this pattern formed, price continued higher for months.
Smart money behaviour (sweep → impulse → pullback) indicates bullish continuation is likely, unless the pullback breaks the previous swing low.
🎯 5. Bottom Line
Yes — history is repeating itself.
The same 4-stage macro cycle is unfolding again:
Consolidation → Sweep → Impulse → Pullback → (Potential continuation)
Your chart perfectly highlights the symmetry, and traders should take note:
📍 If the macro structure remains valid, EUR/USD may be gearing up for another HTF bullish continuation.

NZDUSD forming a bottom?NZDUSD - 24h expiry
Price action looks to be forming a bottom.
Risk/Reward would be poor to call a buy from current levels.
A move through 0.5675 will confirm the bullish momentum.
Short term RSI has turned positive.
The measured move target is 0.5725.
We look to Buy at 0.5650 (stop at 0.5625)
Our profit targets will be 0.5700 and 0.5725
Resistance: 0.5675 / 0.5700 / 0.5725
Support: 0.5650 / 0.5625 / 0.5600
Risk Disclaimer
The trade ideas beyond this page are for informational purposes only and do not constitute investment advice or a solicitation to trade. This information is provided by Signal Centre, a third-party unaffiliated with OANDA, and is intended for general circulation only. OANDA does not guarantee the accuracy of this information and assumes no responsibilities for the information provided by the third party. The information does not take into account the specific investment objectives, financial situation, or particular needs of any particular person. You should take into account your specific investment objectives, financial situation, and particular needs before making a commitment to trade, including seeking, under a separate engagement, as you deem fit.
You accept that you assume all risks in independently viewing the contents and selecting a chosen strategy.
Where the research is distributed in Singapore to a person who is not an Accredited Investor, Expert Investor or an Institutional Investor, Oanda Asia Pacific Pte Ltd (“OAP“) accepts legal responsibility for the contents of the report to such persons only to the extent required by law. Singapore customers should contact OAP at 6579 8289 for matters arising from, or in connection with, the information/research distributed.

EURAUD to find buyers at current market price?EURAUD - 24h expiry
Indecisive price action has resulted in sideways congestion on the intraday chart.
Pivot support is at 1.7600.
Risk/Reward would be poor to call a buy from current levels.
A move through 1.7750 will confirm the bullish momentum.
The measured move target is 1.7875.
We look to Buy at 1.7700 (stop at 1.7625)
Our profit targets will be 1.7850 and 1.7875
Resistance: 1.7750 / 1.7800 / 1.7850
Support: 1.7725 / 1.7700 / 1.7650
Risk Disclaimer
The trade ideas beyond this page are for informational purposes only and do not constitute investment advice or a solicitation to trade. This information is provided by Signal Centre, a third-party unaffiliated with OANDA, and is intended for general circulation only. OANDA does not guarantee the accuracy of this information and assumes no responsibilities for the information provided by the third party. The information does not take into account the specific investment objectives, financial situation, or particular needs of any particular person. You should take into account your specific investment objectives, financial situation, and particular needs before making a commitment to trade, including seeking, under a separate engagement, as you deem fit.
You accept that you assume all risks in independently viewing the contents and selecting a chosen strategy.
Where the research is distributed in Singapore to a person who is not an Accredited Investor, Expert Investor or an Institutional Investor, Oanda Asia Pacific Pte Ltd (“OAP“) accepts legal responsibility for the contents of the report to such persons only to the extent required by law. Singapore customers should contact OAP at 6579 8289 for matters arising from, or in connection with, the information/research distributed.

The Power of One Setup: Variety Kills ConsistencyMost traders chase new strategies, indicators, and secret signals. Progress rarely comes from adding more. It comes from mastering one thing deeply.
The fastest path to consistency is one setup traded a thousand times, until execution becomes automatic.
Every setup has a rhythm. Market conditions, timing, management. When you rotate through styles, you reset the learning curve repeatedly.
Specialization compresses uncertainty. You see the same context, the same triggers, the same mistakes, which tightens execution and accelerates feedback.
Switching setups leads to inconsistent entries, inconsistent risk, and mixed data. You cannot tell what actually works because the sample is polluted.
Professionals remove variables. They keep the market changing while the method stays constant.
Turn the setup into a rulebook.
• Market conditions: trend, range, volatility threshold, session.
• Structure: levels, pattern shape, invalidation logic.
• Entry: trigger candle, confirmation, timing window.
• Risk: stop location, size per trade, max daily loss.
• Management: partials, move to break even, trail or fixed target.
Mastery does not come from more information. It comes from repetition and refinement.
You do not need more strategies. You need fewer distractions.

NZDJPY to find buyers at market price?NZDJPY - 24h expiry
Prices have reacted from 85.89.
Short term oscillators have turned positive.
A break of the recent high at 87.32 should result in a further move higher.
Offers ample risk/reward to buy at the market.
The bias is to break to the upside.
We look to Buy at 87.01 (stop at 86.59)
Our profit targets will be 88.27 and 88.47
Resistance: 87.32 / 87.70 / 88.34
Support: 86.84 / 86.66 / 86.30
Risk Disclaimer
The trade ideas beyond this page are for informational purposes only and do not constitute investment advice or a solicitation to trade. This information is provided by Signal Centre, a third-party unaffiliated with OANDA, and is intended for general circulation only. OANDA does not guarantee the accuracy of this information and assumes no responsibilities for the information provided by the third party. The information does not take into account the specific investment objectives, financial situation, or particular needs of any particular person. You should take into account your specific investment objectives, financial situation, and particular needs before making a commitment to trade, including seeking, under a separate engagement, as you deem fit.
You accept that you assume all risks in independently viewing the contents and selecting a chosen strategy.
Where the research is distributed in Singapore to a person who is not an Accredited Investor, Expert Investor or an Institutional Investor, Oanda Asia Pacific Pte Ltd (“OAP“) accepts legal responsibility for the contents of the report to such persons only to the extent required by law. Singapore customers should contact OAP at 6579 8289 for matters arising from, or in connection with, the information/research distributed.

GBPAUD to continue in the downward move?GBPAUD - 24h expiry
Daily signals are bearish.
The overnight rally has been sold into and there is scope for further bearish pressure going into this morning.
20 1day EMA is at 2.0276.
Previous resistance located at 2.0285.
We look for a temporary move higher.
We look to Sell at 2.0275 (stop at 2.0351)
Our profit targets will be 2.0055 and 2.0015
Resistance: 2.0192 / 2.0260 / 2.0342
Support: 2.0134 / 2.0100 / 2.0020
Risk Disclaimer
The trade ideas beyond this page are for informational purposes only and do not constitute investment advice or a solicitation to trade. This information is provided by Signal Centre, a third-party unaffiliated with OANDA, and is intended for general circulation only. OANDA does not guarantee the accuracy of this information and assumes no responsibilities for the information provided by the third party. The information does not take into account the specific investment objectives, financial situation, or particular needs of any particular person. You should take into account your specific investment objectives, financial situation, and particular needs before making a commitment to trade, including seeking, under a separate engagement, as you deem fit.
You accept that you assume all risks in independently viewing the contents and selecting a chosen strategy.
Where the research is distributed in Singapore to a person who is not an Accredited Investor, Expert Investor or an Institutional Investor, Oanda Asia Pacific Pte Ltd (“OAP“) accepts legal responsibility for the contents of the report to such persons only to the extent required by law. Singapore customers should contact OAP at 6579 8289 for matters arising from, or in connection with, the information/research distributed.

S&P500/ES Intraday Trade Idea VideoThoday I see a potential trade setting up in the S&P500 Futures.
My overall thesis is to the upside, so no Shorts today. Unless we come up to the first resistance level, or even beter, the 1/4 line. From there I'll be willing to risk some of my money.
Long option 2:
From the CIB or Centerline, after a pullback to these lower levels.
Happy Monday all §8-)

Potential BUY Trade Idea GOLD (xauusd) 15mins TFLooking forward to go Long as a trend reversal trade setup.
Counter Trade- Highly Risk but tradable as long as we get the green light
Will update you soon when trade executed or becomes invalid.

NZDJPY to find buyers at previous swing low?NZDJPY - 24h expiry
Dip buying offers good risk/reward.
Short term momentum is bearish.
Early pessimism is likely to lead to losses although extended attempts lower are expected to fail.
85.38 has been pivotal.
Buying posted close to the previous low of 85.35.
We look to Buy at 85.72 (stop at 85.22)
Our profit targets will be 87.22 and 87.52
Resistance: 86.70 / 87.32 / 87.60
Support: 85.70 / 85.35 / 85.00
Risk Disclaimer
The trade ideas beyond this page are for informational purposes only and do not constitute investment advice or a solicitation to trade. This information is provided by Signal Centre, a third-party unaffiliated with OANDA, and is intended for general circulation only. OANDA does not guarantee the accuracy of this information and assumes no responsibilities for the information provided by the third party. The information does not take into account the specific investment objectives, financial situation, or particular needs of any particular person. You should take into account your specific investment objectives, financial situation, and particular needs before making a commitment to trade, including seeking, under a separate engagement, as you deem fit.
You accept that you assume all risks in independently viewing the contents and selecting a chosen strategy.
Where the research is distributed in Singapore to a person who is not an Accredited Investor, Expert Investor or an Institutional Investor, Oanda Asia Pacific Pte Ltd (“OAP“) accepts legal responsibility for the contents of the report to such persons only to the extent required by law. Singapore customers should contact OAP at 6579 8289 for matters arising from, or in connection with, the information/research distributed.

Lemonade Inc.: Breakout in Motion — Cup, Flag, and No BrakesLemonade Inc. (LMND) is accelerating after a clean breakout from a textbook cup with handle pattern, where the handle formed as a tight bullish flag. The breakout occurred around $32, and since then, price action has been sharp, controlled, and uncorrected — currently trading at $42.42 with buyers clearly in charge.
On the fundamental side, LMND is moving through a recovery phase: operational losses are narrowing, revenue is stabilizing, and the company is aggressively leveraging AI to automate its insurance processes. Expansion into Europe continues, and institutional interest is visibly rising — confirmed by volume building alongside price. Within the insuretech sector, LMND is starting to look like a comeback story rather than a cautionary tale.
Technically, the setup remains strong:
– Golden Cross confirmed (EMA50 crossing EMA200)
– EMA50/100/200 all below price — bullish structure firmly intact
– Volume expanding on up-days — healthy confirmation
– RSI hovering in the 60–65 range — momentum is intact, no signs of exhaustion
Targets remain aligned with the structure:
– tp1 = $64 — measured move from the flag
– tp2 = $94 — full realization of the cup pattern
Tactically, this is no longer a “wait and see” setup — the move is in progress. No correction so far, only continuation. Momentum traders may consider entries into strength. Above $45, the move could accelerate further as more participants recognize the structure.
LMND is showing technical and fundamental alignment — confirmed breakout, improving narrative, and strong trend structure. While the impulse holds, this chart favors continuation, not hesitation.

China50 to find enough buyers at current support?CHN50 - 24h expiry
The overnight dip has been bought into and there is scope for further bullish pressure going into this morning.
15160 has been pivotal.
Previous resistance at 15200 now becomes support.
Daily signals are mildly bullish.
Our outlook is bullish.
We look to Buy at 15185 (stop at 14995)
Our profit targets will be 15755 and 15855
Resistance: 15382 / 15570 / 15774
Support: 15235 / 15080 / 14827
Risk Disclaimer
The trade ideas beyond this page are for informational purposes only and do not constitute investment advice or a solicitation to trade. This information is provided by Signal Centre, a third-party unaffiliated with OANDA, and is intended for general circulation only. OANDA does not guarantee the accuracy of this information and assumes no responsibilities for the information provided by the third party. The information does not take into account the specific investment objectives, financial situation, or particular needs of any particular person. You should take into account your specific investment objectives, financial situation, and particular needs before making a commitment to trade, including seeking, under a separate engagement, as you deem fit.
You accept that you assume all risks in independently viewing the contents and selecting a chosen strategy.
Where the research is distributed in Singapore to a person who is not an Accredited Investor, Expert Investor or an Institutional Investor, Oanda Asia Pacific Pte Ltd (“OAP“) accepts legal responsibility for the contents of the report to such persons only to the extent required by law. Singapore customers should contact OAP at 6579 8289 for matters arising from, or in connection with, the information/research distributed.

MSTR - How to profit from a $140 short target🔱 The MS ponzi is taking its toll. 🔱
I’m not laughing, because it’s genuinely unfortunate for everyone who believed in this scam.
But today, I don’t want to rant about that.
I want to show how one could profit from a potential drop of more than $100.
As an Andrews Pitchfork trader, I know there’s roughly an 80% chance that price will reach the centerline. From there, price either reverses in the opposite direction or breaks through the centerline to continue its journey.
That’s exactly what happened with MSTR.
You can see how the price first reached the centerline, held there a few times, and then broke it. Since then, it’s been following the rulebook by moving further to the downside.
Now, there’s another rule worth remembering:
price often tests or retests the line it just broke.
In our case, that line is the centerline.
This means we could be lucky enough to get a pullback to the centerline, and that would be a good level to consider shorting.
The target is usually the opposite line of the centerline, which in our case is the L-MLH (Lower Median Line Parallel).
👉 If you want to learn the full framework and its rules, check the links for free material.
I hope this helps many of you, and I wish you all good profits.

GBPNZD short term RSI has turned positive.GBPNZD - 24h expiry
Price action looks to be forming a bottom.
Risk/Reward would be poor to call a buy from current levels.
A move through 2.3050 will confirm the bullish momentum.
Short term RSI has turned positive.
The measured move target is 2.3150.
We look to Buy at 2.2975 (stop at 2.2900)
Our profit targets will be 2.3125 and 2.3150
Resistance: 2.3050 / 2.3100 / 2.3150
Support: 2.3025 / 2.3000 / 2.2975
Risk Disclaimer
The trade ideas beyond this page are for informational purposes only and do not constitute investment advice or a solicitation to trade. This information is provided by Signal Centre, a third-party unaffiliated with OANDA, and is intended for general circulation only. OANDA does not guarantee the accuracy of this information and assumes no responsibilities for the information provided by the third party. The information does not take into account the specific investment objectives, financial situation, or particular needs of any particular person. You should take into account your specific investment objectives, financial situation, and particular needs before making a commitment to trade, including seeking, under a separate engagement, as you deem fit.
You accept that you assume all risks in independently viewing the contents and selecting a chosen strategy.
Where the research is distributed in Singapore to a person who is not an Accredited Investor, Expert Investor or an Institutional Investor, Oanda Asia Pacific Pte Ltd (“OAP“) accepts legal responsibility for the contents of the report to such persons only to the extent required by law. Singapore customers should contact OAP at 6579 8289 for matters arising from, or in connection with, the information/research distributed.

Bitcoin Support Zone Rebound SetupBitcoin (BTC/USDT) is approaching a key support zone around 103,000–104,000. A potential rebound from this area could trigger a bullish move toward the first target near 105,000 and the second target around 106,500.

EURAUD to see a turnaround?EURAUD - 24H expiry
The selloff is close to an exhaustion count on the intraday chart.
We expect a reversal in this move.
Risk/Reward would be poor to call a buy from current levels.
A move through 1.7650 will confirm the bullish momentum.
The measured move target is 1.7750.
We look to Buy at 1.7575 (stop at 1.7500)
Our profit targets will be 1.7725 and 1.7750
Resistance: 1.7650 / 1.7700 / 1.7750
Support: 1.7600 / 1.7575 / 1.7550
Risk Disclaimer
The trade ideas beyond this page are for informational purposes only and do not constitute investment advice or a solicitation to trade. This information is provided by Signal Centre, a third-party unaffiliated with OANDA, and is intended for general circulation only. OANDA does not guarantee the accuracy of this information and assumes no responsibilities for the information provided by the third party. The information does not take into account the specific investment objectives, financial situation, or particular needs of any particular person. You should take into account your specific investment objectives, financial situation, and particular needs before making a commitment to trade, including seeking, under a separate engagement, as you deem fit.
You accept that you assume all risks in independently viewing the contents and selecting a chosen strategy.
Where the research is distributed in Singapore to a person who is not an Accredited Investor, Expert Investor or an Institutional Investor, Oanda Asia Pacific Pte Ltd (“OAP“) accepts legal responsibility for the contents of the report to such persons only to the extent required by law. Singapore customers should contact OAP at 6579 8289 for matters arising from, or in connection with, the information/research distributed.

KRBN - Clear resistance for a potential short🔱 The multiple struggle at the Centerline gives us a hint for a potential short. 🔱
The thin slanted support needs to be broken and only then can we consider a move to the downside.
The L-MLH is my first PTG and the red Centerline my second.
Wish you all a happy new week and don't forget to watch my 👉 Weekly Trading Watchlist.

OG/USDT Analysis. Long Setup
On this asset, we’ve detected a large number of volume anomalies, which suggests strong accumulation by a major player. Additionally, there’s a structural breakout on the chart, and above the current price, we can see a volume gap, creating potential for upward movement.
In the order book, below $10.8, there are limit buy orders totaling around $1.7 million, which is a significant volume for this coin.
We’re considering a long position from current levels or after a false breakout of $10.5, where the first signs of abnormal activity appeared.
Growth target: $12.7.
This publication is not financial advice.

EURAUD to find buyers at current market price?EURAUD - 24 expiry
The selloff is close to an exhaustion count on the intraday chart.
We expect a reversal in this move.
Risk/Reward would be poor to call a buy from current levels.
A move through 1.7775 will confirm the bullish momentum.
The measured move target is 1.7875.
We look to Buy at 1.7700 (stop at 1.7625)
Our profit targets will be 1.7850 and 1.7875
Resistance: 1.7800 / 1.7850 / 1.7875
Support: 1.7750 / 1.7700 / 1.7650
Risk Disclaimer
The trade ideas beyond this page are for informational purposes only and do not constitute investment advice or a solicitation to trade. This information is provided by Signal Centre, a third-party unaffiliated with OANDA, and is intended for general circulation only. OANDA does not guarantee the accuracy of this information and assumes no responsibilities for the information provided by the third party. The information does not take into account the specific investment objectives, financial situation, or particular needs of any particular person. You should take into account your specific investment objectives, financial situation, and particular needs before making a commitment to trade, including seeking, under a separate engagement, as you deem fit.
You accept that you assume all risks in independently viewing the contents and selecting a chosen strategy.
Where the research is distributed in Singapore to a person who is not an Accredited Investor, Expert Investor or an Institutional Investor, Oanda Asia Pacific Pte Ltd (“OAP“) accepts legal responsibility for the contents of the report to such persons only to the extent required by law. Singapore customers should contact OAP at 6579 8289 for matters arising from, or in connection with, the information/research distributed.

NZDUSD forming a bottom?NZDUSD - 24h expiry
Price action looks to be forming a bottom.
We expect a reversal in this move.
Risk/Reward would be poor to call a buy from current levels.
A move through 0.5775 will confirm the bullish momentum.
The measured move target is 0.5850.
We look to Buy at 0.5750 (stop at 0.5720)
Our profit targets will be 0.5825 and 0.5850
Resistance: 0.5775 / 0.5800 / 0.5825
Support: 0.5750 / 0.5725 / 0.5700
Risk Disclaimer
The trade ideas beyond this page are for informational purposes only and do not constitute investment advice or a solicitation to trade. This information is provided by Signal Centre, a third-party unaffiliated with OANDA, and is intended for general circulation only. OANDA does not guarantee the accuracy of this information and assumes no responsibilities for the information provided by the third party. The information does not take into account the specific investment objectives, financial situation, or particular needs of any particular person. You should take into account your specific investment objectives, financial situation, and particular needs before making a commitment to trade, including seeking, under a separate engagement, as you deem fit.
You accept that you assume all risks in independently viewing the contents and selecting a chosen strategy.
Where the research is distributed in Singapore to a person who is not an Accredited Investor, Expert Investor or an Institutional Investor, Oanda Asia Pacific Pte Ltd (“OAP“) accepts legal responsibility for the contents of the report to such persons only to the extent required by law. Singapore customers should contact OAP at 6579 8289 for matters arising from, or in connection with, the information/research distributed.

GBPJPY's Reversal BaseHi Traders!
When looking at GJ, the chart seemed messy as it was in a range for a long time. After finally breaking out of the 200s, priced reach a Weekly OB area in the 203s.
Over the past weeks or so, GJ created a counter trend dipping back into the high 200s area with what it appears to be a reversal base. If this reversal is true, I would be planning swinging this trade into the next resistance areas around 206-207. That will bring price to a previous Monthly Bearish OB.
Despite of how the chart has looked, the trend remained bullish. Therefore, IMO, GJ seems to want to keep its bullish momentum.
Good luck to everyone!
*DISCLAIMER: I am not a financial advisor. The ideas and trades I take on my page are for educational and entertainment purposes only. I'm just showing you guys how I trade. Remember, trading of any kind involves risk. Your investments are solely your responsibility and not mine.*

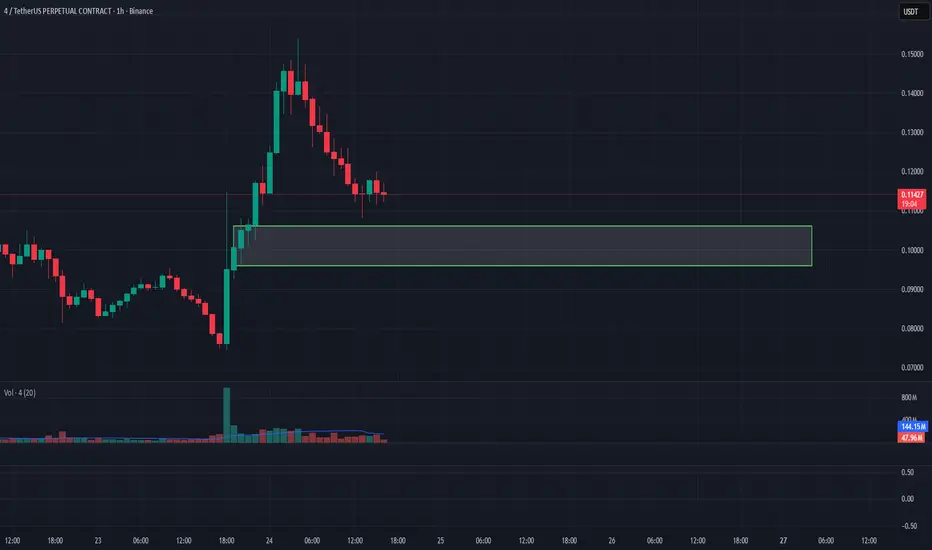
4/USDT Analysis. Long Setup
For this asset, we’ve noticed strong buyer activity, while during the pullback volumes are almost absent, suggesting a momentum-based decline rather than active selling.
Below the current price lies a strong volume zone at $0.106–$0.096 — a bullish reaction from this area could trigger a long setup with an initial target at $0.16.
This publication is not financial advice.
The Best DEX & Token PotentialAVNT #LONG
Potential for 130% growth .
You can go long on spot or with a small leverage.
Token from a DEX, the exchange is good , the drop was awesome , staking their token with a good interest rate is available, the team's cliff is long, so there is an incentive to push the price up .
