AUDJPYLooks like the previous high was broken on the 1 hour timeframe. The Mac D has crossed over to the top side. RSI is also overbought. AUD strength may e exhausting at this level and may be close to time for a retracement. Would like to see a retracement of 38% or greater towards the previous low which was the last time the mac d was on the bottom side. Price has also been increasing while volume has shown some regression the past few hours. Let's see what happens.
Setups

EURUSDNo need to get too technical. Just see some bearish candles coming in at a resistance level. Price is right at the 200 HMA and I would like to see if price can retest the previous low. Anywhere from 38% or greater. Getting too technical can confuse you or make it seem harder than it really is. I'm going to watch this trade on the 4 hour as time is my friend.

EURNZD 1. Mac D may be losing momentum.
2. RSI K and D crossing down near the overbought start of the progression down.
3. Double Long Legged Doji (previous candle) with next candle opening up lower on high bear volume near or at a high.
4. 38% to 61% profit.
5. Stop loss at nearest high for risk management.
What do you think?

SHORT SELLINGWait for the Price correction of EURNZD, SELL after the conformation at the Sell zone.
Trade safely my Friends and let me know views in the Comments.

ETHUSD (1 Hour w/DXY)Looks like the current upwards movement in price is starting to simmer down a bit. Volume seems to be lowering as prices rise. DXY also looks like its close to being ready for the retracement of the previous high. I would like to see price start to pause a bit even if it continues to go up. Targets are set for 38% to 61% of the previous high or low.
ETHUSD
RSI: K and D starting to cross down.
MacD: Top side.

LTCUSDRSI: Overbought K and D crossing down
MacD: Top side
Candle Analysis: Potential sign of weakness where the arrow is at. Bearish candle with wick at top. Above average bull volume. Price could push a bit higher. However, buying pressure could be exhausting a bit.
Target: Looking for 38% to 61% retracement of the previous low where the mac d last had its crossover.
Not advice!

Midweek Wednesdays - Time To Recover 👋 Hey everyone, so this week hasn't started off very well, but we found two setups that may be able to change that and set us up for another profitable week. So if you interested in learning what these two pairs are, then check out the video and let me know what you think.

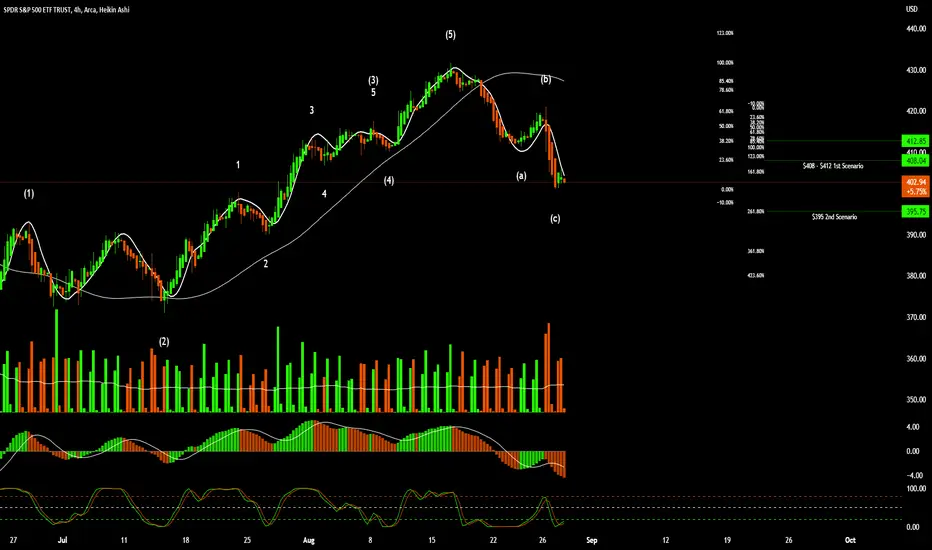
SPY (Two Scenarios)Scenario 1: ABC Zig Zag that doesn't turn into bearish impulse. The two previous candles seem as if the bulls tried to push up a bit on average volume. RSI is oversold. Could it make a lower high this week after the massive Friday sell off? This could be the start of an impulse wave to the upside with a minor pullback to what would be a 2 wave. My only doubt here is with the FED raising interest rates to lower inflation from the current 8.50% to the year end goal of 4%/3.75%. Other economic indicators doesn't show enough for me to think positively about this market.
Scenario 2: ABC Zig Zag turns bearish impulsive. Weekly RSI is overbought and is crossing down and looks like it wants to test the $361 lows. SPY rose a bit today on low to average volume so I don't really trust big moves to the upside. We have a decent amount of FED speakers this week and I'll be following the economic data. I doubt smart money will feel confident enough to push the market up short term. Regardless, this scenario is the scenario I see playing out in the coming days to weeks.
What do you think?
$GMLast week (previous candle), we have located a potential market anomaly. A shooting star candle with above average buy volume. I feel like bulls that missed out or still attempting to squeeze juice from the July 11th rally may get some tough days ahead. Price could continue to rise a small bit. However, we are waiting on distribution which should take us to the 2nd wave. We don't know how long this will take. The RSI K/D is starting to cross down from an over bought stance. We are looking for price to reach $35 to $37 at some point. We just completed an ABC expanded flat on the weekly and will be patient to see if a new impulsive wave is coming down the line. At this point, we will be looking to trade each wave so I will update as we go.
What do you think?

SPY Wanted to mark this up on a weekly timeframe. We have been on a downtrend since January 2022. Could this be an impulsive Elliot wave happening to the downside? Considering the recent bear market rally. Who's to say it isnt? The RSI is overbought with the macd still on the bottom side. I would like to see where price is at once the RSI reaches oversold territory. Our targets are at the 50% and 100% of the end of wave 4 to where the end of wave 3 is.
Not advice!

Bitcoin Scalping Signal for Day Trading🖥️ We have determined there is a 70% chance Bitcoin will RISE from our current entry point.
📈 LONG BTC - Entry Price : $22,800 📈
💵 Length of trade: we are expecting BTC to hit a $500 scalp, with a high end of $800, and a minimum expectation of $300.
🕰️ Duration of trade: we are expecting this to occur after 4 hours of this signal, with a maximum duration of 9.5 hours (for the expected profit target); with continuing to 32 hours, if positive momentum extends post market close, into the weekend for breaching the high end target, and above.
OUR Last 2 Signals were disappointing... the last was shortly in $100 profit, so at best a minor gain - the one prior to that was a $300 stop-loss hit. We are here with you, putting our personal money down for every signal. Our resolve is with keep the strength of these signals.

eth graph, mock longfor my own purposes;
mock long position;
want to work out the trade on paper or google sheets;
R:R/ margin / leverage;
practice

NZD JPY buy setups live New Zealand Dollar / Japanese Yen chart to track latest price changes. Trade ideas, forecasts and market news are at your disposal .

Bitcoin Day Trade Setups, Scalping Entries🖥️ We have determined there is a 60% chance Bitcoin will Fall from our current entry point.
📉 SHORT BTC - Entry Price : $24,850 📉
💵 Length of trade: we are expecting BTC to hit a $300 scalp, with a high end of $500, and a minimum expectation of $200.
🕰️ Duration of trade: we are expecting this to occur within 6 hours of this signal, with a maximum duration of 9 hours .

BTC intraday camarilla pivots. bounce or breaklong from L3 to H3 and above. manage risk from L4 OR long from H4 to H5/6 manage risk at H3
short from L4 to L5/6 manage risk from H3
camarilla pivot points intraday levels

ETHUSDLooks like we are ending a wave 5 on the 15 min time frame. I set a stop at the 161% retracement fibonnaci not show for this one) from the top of wave 4 to the bottom of wave 5 if valid). Looking for a retracement of anywhere between 50% to 61% of the top of wave 4 to create our A wave. We might stat a new consolidation range here so lets see what happens. On the 4 hour time frame the A wave is already made. Price may want to retrace the high before further downside.

KHCLooks like we are in a range here. We just came off of a wave 5 motive. At some point, there will break out. If price doesn't break the high of (C) I would expect a retest anywhere between 61% to 100% of wave (A). Our stop loss is set at the top of the consolidation range. Happy Trading! This is a safe haven stock so be careful and dont use too much risk!

EURGBPLooks like we may be ending the 5 wave here. Usually, after 5 wave motives, there is an ABC zig zag of correction. Stay patient and see how this plays out. Set profit at A. Plan on riding the B wave up if we get a double top and Getting back in when price is ready for the C wave. Happy trading! Stop loss is set 20 pips above the current (5) wave in case it continues its streak. Bulls may be losing momentum here soon!

USDCADLooks like we are near a break out of this consolidation area which was created after an impulse wave to the downside. I believe that the USD needs to gain strength so there is some bias there. Just being honest. I would like to see price reach anywhere between 100% to 161% of wave 1. Let's see how it goes!
Do you agree?
"Learn, Do, Improve"

EURJPY Looks like a strong consolidation range here coming off of a recent 5 wave motive. Looking for the start of a new 5 wave motive to the downside if we get a breakout. Looking for 100% to 161% for our target range!
Do you agree?

CADJPY Looks like an "ABC" corrective or Zigzag pattern is forming. Double top near the 200 HMA. Lets see how this goes. Price action just completed a 5 wave motive impulse. Let's see what happens! We have safe targets set respective to Elliott wave rules.
Do you agree?

NZDJPYLooks like an "ABC" corrective or Zigzag pattern is forming. Double top near the 200 HMA. Lets see how this goes. Price action just completed a 5 wave motive impulse. Let's see what happens! We have safe targets set respective to Elliott wave rules.
Do you agree?

AUDJPY Looks like an "ABC" corrective or Zigzag pattern is forming. Double top near the 200 HMA. Lets see how this goes. Price action just completed a 5 wave motive impulse. Let's see what happens! We have safe targets set respective to Elliott wave rules.
Do you agree?
