shop after long time going down we hope to see shop going around 55% with option to lose 4.5% and ratio of 4.4
RSI with low ratio with face up
with 4 time wining the earning we hope that shop going to sky rocketin the earning will make the call to get in to the trade
let see what shop will say
Shopify

Why I'm Going Long on ShopifyOn the weekly timeframe for NYSE:SHOP , I noticed four things immediately:
- A candle close above the bullish flag forming, indicator bullish momentum.
- NYSE:SHOP recently created swing highs at $53.70 and then broke it and bounced perfectly off of it showing that $53.70 is a KEY level.
- When price bounced off of $53.70, it was also at the 5 SMA, adding more confluence to my trade
- Lastly, I saw a divergence on the volume indicator, which is always a good sign of confluence for my trades.
Given these four reasons, I am bullish on NYSE:SHOP as of now.
Stop Loss / Take Profits
Stop loss:
The stop loss of this trade is set at $55.42, which is the most recent low.
Take Profits:
All of these take profits are set at levels that I felt were phycological levels.
My plan would be to scale out half of my position at TP1, 1/2 of the remaining position at TP2, and fully out at TP3
If TP3 is hit, this will be a 1:1.44 R:R trade.
Let me know what you think of this trade!

SHOP | Informative | Day trade planNYSE:SHOP
Price Action & Candlestick Analysis:
The price seems to be in a short-term downtrend, as it's mostly moving below the moving averages.
The long blue bar shows a strong bullish movement in one of the 15-minute intervals, but it seems the momentum could not be maintained, as the price started declining shortly after.
Moving Averages:
There are two moving averages, one short-term (potentially 50-period) and one long-term (potentially 200-period). The stock price is currently below both, which is generally a bearish signal.
The moving averages appear to be converging slightly towards the end, potentially indicating a change in trend in the future if they crossover.
Volume:
There's a significant spike in volume during the bullish move. This suggests that there was strong buying interest during that time.
Following the bullish spike, the volume seems to taper off, which can be an indication of a decrease in trading interest or momentum.
Support and Resistance Levels:
The "Bullish Line" is set at 53.48, which might act as a resistance level in the short term. If the price breaks above this with significant volume, it could lead to further bullish movement.
The "Bearish Line" is marked at 52.49. This might serve as a short-term support level. A breach below this line could indicate further downward movement.
Target prices are set at various levels, with the nearest being Target Price 1 at 52.06, then 51.37, and the lowest being 50.69. These could serve as potential support levels or price targets for a bearish move.
On the upside, if there's a change in trend, the target prices are 54.57 and 55.28.
RSI (Relative Strength Index):
The RSI seems to be hovering around the mid-level, currently at 42.70, indicating neither overbought nor oversold conditions.
The movement of the RSI is generally flat, suggesting no strong momentum in either direction at the moment.
Overall Sentiment:
The overall sentiment from this chart seems to be slightly bearish, considering the price is below both moving averages and is closer to the bearish line.
However, the RSI is near the middle, and the moving averages are converging, so there could be potential for a change in trend. It would be crucial to watch for breakouts above resistance or breakdowns below support, coupled with volume, for a clearer direction.

Bullish on Shop.
Hello all, As you can see here on the 15-minute chart we are in a channel. I drew these lines and supply zones on the hourly chart. I am looking for a bullish breakout and retest of resistance with a high volume bounce off with good volume on the Hiekin Ashi candlestick chart. I am looking long because the market seems to go where the liquidity is. Thank you for reading my analysis.

$SHOP GOIN' UP
Shopify is going up, look at this beautiful move off of support with great volume. TP1 is 25 EMA, and TP 2 is POC of volume profile. This chart is beautiful.

Shopify Macro Pattern Bullish Until Proven OtherwiseHi Guys! This is a Macro Technical Analysis on Shopify (SHOP) on the 1 Week Timeframe.
Its to add to my previous analysis while keeping it brief and concise.
Recently we Broke through and confirmed BELOW both the Uptrend Channel and the 21 EMA.
Normally this spells TROUBLE, especially if we confirm BELOW 21 EMA, as this moving average normally holds SUPPORT through BULLTRENDS.
Even more so that the MACD has crossed BEARISH as well.
However digging deeper, its seen that the channel and 21 EMA break was followed by DECLINING VOLUME.
Normally, for Trend Reversals and for the direction of a trend to actually go that way you need a spike in VOLUME.
(Watch VOLUME in the coming weeks. Can give us hints to what will come next.)
Comparing our current move to previous moves, look to "Similar Pattern". It may be probable that we just move side ways before continuing our UPTREND.
Notice how to the T, our current move follows the previous example. The 21 EMA is also flattening out, indicating this sideways movement.
Another likely scenario, if volume picks up can be a test of the 50 SMA (Green moving average).
BUT provided this Weeks candle closes ABOVE we are testing support. So if we can stay ABOVE this, 50 SMA is less Probable. So pay attention to this weeks candle close and for CONFIRMATION.
Also NOTE we have had a BULLISH CROSS of the 21 EMA above the 50 SMA.
Along with how previous history BUllish move played out.
This makes me think we are in the Early phases of a BULL run in Shopify.
This is NOT a DEFINITE, Sure thing but we may be mirroring the "Similar Pattern".
But always remember that things that happened before does not have to happen again.
I think other than Volume, another MAJOR thing to watch is the MACD.
Particularly, the main focus should be staying ABOVE the 0 level.
Going BELOW 0 level, may indicate further price DECLINES.
So watch how the Histogram bars shape up, we want smaller RED bars that change to a lighter RED color. Eventually would like to see GREEN bars in the coming weeks. That would give confidence that BULLISH momentum is coming back to Shopify.
Take a look at how the MACD shaped up during the "Similar Pattern". If we stay ABOVE 0 level, all is good.
Keep that in the back of the mind as you follow the MACD.
RSI also gives some clues. The area between the RED & BLACK Horizontal lines, coincides with being BELOW 21 EMA.
If we are below the RED line, normally its a good area to add to your position during a BULL run.
The warning sign is if the RSI drops towards and BELOW the BLACK line, that would lead to further PRICE Declines.
Using both the MACD and RSI in combination will help remove false signals. If you see that the histograms are turning light red, to light green and the RSI curved back up towards and ideally above RED line. This would likely push Price back ABOVE 21 EMA, and continue our BULL Run.
I think this week, its important to stay ABOVE the SUPPORT line. Staying above may bring in more confidence.
__________________________________________________________________________________
Thank you for taking the time to read my analysis. Hope it helped keep you informed. Please do support my ideas by boosting, following me and commenting. Thanks again.
Stay tuned for more updates on SHOP in the near future.
If you have any questions, do reach out. Thank you again.
DISCLAIMER: This is not financial advice, i am not a financial advisor. The thoughts expressed in the posts are my opinion and for educational purposes. Do not use my ideas for the basis of your trading strategy, make sure to work out your own strategy and when trading always spend majority of your time on risk management strategy.

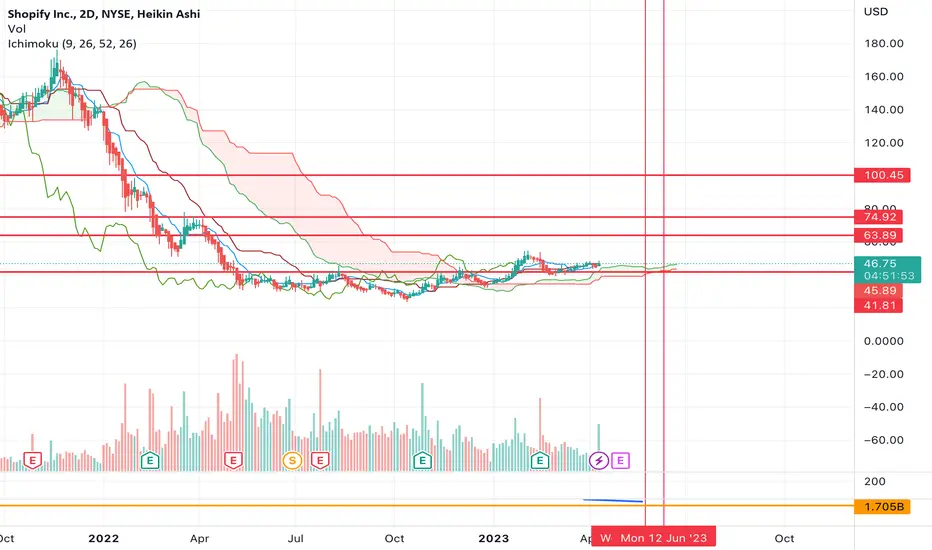
Bull momentum of Shopify has been completely releasedBull momentum of Shopify has been completely released
This chart shows the weekly candle chart of Shopify stocks over the past two years. The top to bottom golden section at the end of 2021 is superimposed in the figure. As shown in the figure, since the completion of the form at the end of October 2022, it has risen by 4 small bands, and theoretically, the bull momentum has been completely released! This week, Shopify's stock has made a significant pullback, returning to below the 2.382 position in the golden section of the chart! In the future, it is likely that there will be a longer period of bull rest!

SHOP LONG 3rd Aug,2023I am long in SHOP and targets will be huge. Wait for my analyis and if you do understand the trade then enter it. SPY SHOULD RETRACE MORE SOplan your trade accordingly

SHOP Shopify Options Ahead of EarningsIf you haven`t sold SHOP here:
or considered this buy area:
Then analyzing the options chain and the chart patterns of CAT Caterpillar prior to the earnings report this week,
I would consider purchasing the 67usd strike price Calls with
an expiration date of 2023-8-11,
for a premium of approximately $3.50.
If these options prove to be profitable prior to the earnings release, I would sell at least half of them.
Looking forward to read your opinion about it.

Netflix - I Hope You Like Catching KnivesNetflix is that $200 billion company trading at $441.44 that everyone seem to have forgot about, even though it more than doubled in a year.
Personally, I think these streaming services are a colossal waste of your time and money. What you're watching is the intellectual equivalent of a Big Mac or a bag of potato chips, and permeated with the things of socialism and atheism.
And Netflix is really quite woke and some of the content is unforgivably degenerate.
You shouldn't look at warped mirrors and shouldn't cast your eyes on ugly things, or they'll twist your heart and your soul.
When it comes to the markets-at-large, I believe we're definitely going to see a correction, rather than a new all time high, which I detail in the two calls below:
Nasdaq NQ - A Fundamental and Technical Warning Signal
SPX/ES - An Analysis Of The 'JPM Collar'
If there's to be a new all time high, let's wait and see what Q4 has in store for us.
There's a lot of geopolitical risk in the markets right now. The War between the Russian Federation and NATO via Ukraine is a big one, and a bigger one is the situation in Mainland China with Xi Jinping and the Chinese Communist Party.
More or less, I believe the globalists want to topple the Party to have their men from Taiwan go in and take control of China and depose Xi.
But I believe Xi is likely to topple the Party himself before that can happen.
Big gaps will come that day and things will be very hard because Wall Street won't be in any kind of a risk-on mood.
The 24-year persecution against Falun Dafa launched by former Chairman Jiang Zemin and the Shanghai toad faction is something Xi can weaponize to implicate the entire world.
Because to do business in Shanghai you've needed the Jiang Faction's approval. To get its approval, you've had to dirty your hands in the persecution and swear vows to the Flag of Blood.
And unfortunately, most of the world has wanted what the Party has. Read the story of British billionaire Neil Heywood, who decided to court Jiang's minion Bo Xilai.
Bo told Heywood that to prove his loyalty he had to divorce his wife. Heywood refused, and so Bo's wife poisoned him.
Heywood died in 2011.
Bo Xilai was ruined in Xi's Anti-corruption Campaign in 2013, stripped of all his assets, and sentenced to life in prison in a CCP dungeon.
Gambling with the Party is one foot in the grave and the other in prison. Live a virtuous life instead.
Moreover, they always say zoom out. Looking at Netflix on the yearly, it's hard to say you're not in the crosshairs of a savage trend reversal.
And you can see these daily bars far more clearly on the weekly chart:
There might be that fat gap above that you have your eye on, but you're dealing with a very long and very steep ramp in the first place, and this is in a stock which stayed away from a true gap between April and August of '22.
Another notable factor is that the FINRA short volume for Netflix, while still notably low, is the highest it's been in three months and posted its first green month since April and only its second of '23.
Short volume
This is quite notable in light of the fact that June was one of the best months for equities in a long time
Netflix doesn't have an ETF, except for a 3x levered ETF on the Mexico exchange. Insignificant except for it fell from 5 pesos to 5 pennies.
What's sad is even if it Netflix was to fall 50% in value the thing would still only be worth like 30 cents. % base levered ETFs will kill you.
So, here's the call.
Netflix printed a proper daily pivot in mid June (you'll have to look yourself because I can't zoom the chart in for the post) and has been flirting inside that range ever since.
If she makes a new high I suppose then it's time for more uppy and you can buy calls at the top and feel pretty good.
But if she breaks the $420 range the next area to watch is the June low, which Netflix printed on a green candle and on the first day of the month at $393
After that, things might happen and happen fast.
If bearish momentum and level breaking manifests, then where I believe it will return to is the $180 to $160 range.
For Netflix to have a chance to return above $500, it will have to hold the $162.71 bottom.
If you can catch that falling knife you'll feel pretty smart if you can hold the bag for a few months.
But if you try to go long before the bottom you'll cut your hands and cut your hands some more.

$SHOP Stock Shows Promising Breakout with Upside Potential
Introduction
Shopify Inc. ( NYSE:SHOP ) has been garnering significant attention in the stock market as it breaks out of multiple weeks of consolidation. This Canadian e-commerce giant has witnessed remarkable growth over the years, and recent technical analysis suggests that there is substantial upside potential for the stock. In this article, we will explore the factors behind Shopify's breakout, examine the potential for further gains, and discuss a potential entry point for long positions.
Shopify's Breakout from Consolidation
After several weeks of trading within a tight range, Shopify's stock finally managed to break out above its consolidation pattern. This breakout indicates a significant shift in the stock's price direction, and technical traders have been quick to take notice. The breakout is a signal of potential upward momentum, with the stock showing strong bullish sentiments.
The Upside Potential
With the breakout from consolidation, Shopify's stock now has ample room for further gains. As the company continues to innovate and expand its e-commerce platform, it is attracting more businesses and consumers to its ecosystem. The ongoing shift towards e-commerce and the rise of online businesses have provided a tailwind for Shopify's growth, and this trend is expected to continue in the foreseeable future.
Furthermore, Shopify's financial performance has been impressive, with consistently robust revenue growth. The company's strong quarterly results have reassured investors of its long-term sustainability, which has contributed to the positive sentiment surrounding the stock. As Shopify expands its international presence and introduces new features and services, it is likely to attract more merchants and drive further growth.
Waiting for a Long Opportunity
While Shopify's breakout presents a compelling opportunity for traders and investors, it is crucial to exercise patience and wait for an optimal entry point. The ideal scenario for long positions would be a retest of the weekly breakout, around the $67.3 level. This level would act as a support level, providing a more attractive risk-to-reward ratio for long positions.
By waiting for a retest, traders can confirm that the breakout is genuine and that the stock has the potential to continue its upward trajectory. Timing is crucial in the stock market, and entering a position at the right moment can significantly impact potential gains.
Conclusion
Shopify Inc. ( NYSE:SHOP ) has captured the attention of the market with its breakout from weeks of consolidation. The stock's impressive upside potential is driven by the company's continuous growth in the e-commerce sector and its strong financial performance. As the online business landscape continues to expand, Shopify is well-positioned to capitalize on this trend.
For traders and investors considering a long position in Shopify, it is essential to wait for an opportune moment. A retest of the weekly breakout around the $67.3 level provides a compelling entry point with a favorable risk-to-reward ratio.
As always, it is crucial to conduct thorough research and consider market conditions before making any investment decisions. While Shopify's breakout presents an enticing opportunity, prudent risk management and disciplined trading strategies should guide all investment activities.
Breakout Trade in SHOPShopify is emerging from a beautiful Stage 2 base.
SHOP is up more than 100% since the start of a year – a clear sign this is a market leader.
Notice how volume is higher on the rallies up and lower when the stock pulls back. This is a subtle clue that buyers are in control and the smart money is building a position.
The breakout on Thursday came on 2X its average daily volume and the stock closed at the high of the candle – both good signs of a legitimate move.
I want to see SHOP stay above the breakout level or, at a minimum, above its 21-day moving average (blue line on chart).

$SHOPI am not a financial adviser, speak with your partner or mom before making important decisions about your money.

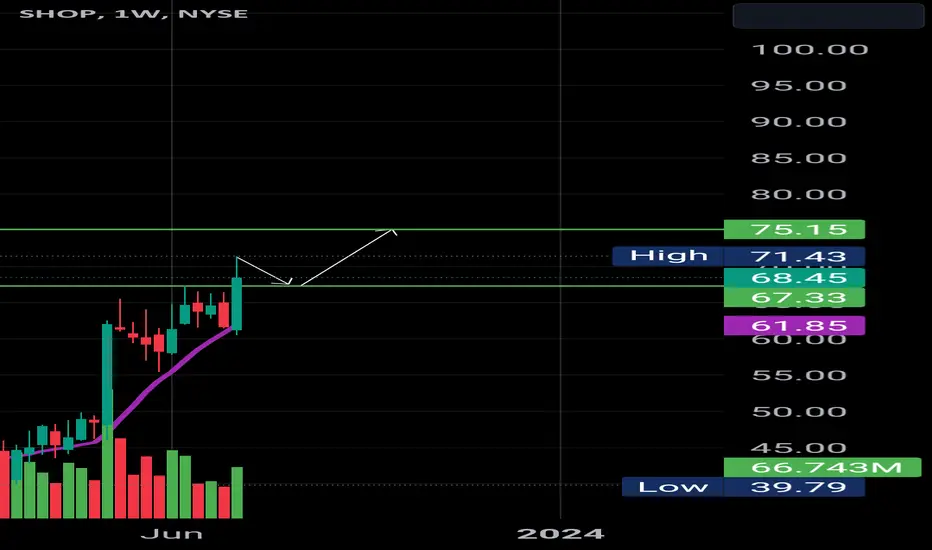
SHOP is ready to pump 45 % (NEW)SHOP is ready to pump 45 %.
We can see an inverted head and shoulders pattern. We got a higher low which shows a demand.
The target is shown on the chart($60)
You can put a stop loss below the head of the formation

SHOPIFY targeting 75.00It's been 10 months since we last analyzed Shopify Inc. (SHOP) and called for a $60 target (see chart below):
The stock recently hit that level and we now see that it's trading within a Bullish Megaphone/ Channel Up combo pattern. With the 1D MA50 as its Support and recent strong fundamentals, we now set the next medium-term target at $75.00 to fill Gap 3. The 1D RSI has been on a Higher Lows trend-line, clearly indicating the most optimal buy entry within the pattern.
-------------------------------------------------------------------------------
** Please LIKE 👍, FOLLOW ✅, SHARE 🙌 and COMMENT ✍ if you enjoy this idea! Also share your ideas and charts in the comments section below! **
-------------------------------------------------------------------------------
💸💸💸💸💸💸
👇 👇 👇 👇 👇 👇

$SHOP bull flagNYSE:SHOP bull flag, needs to break out before it can continue higher to next resistance level which is the horizontal line. Very nice bottoming base.
SHOP | LevelsStocks still has rich valuation, would not buy 700$ unless market changes. Would buy 300-400 for long term whatever market conditions.

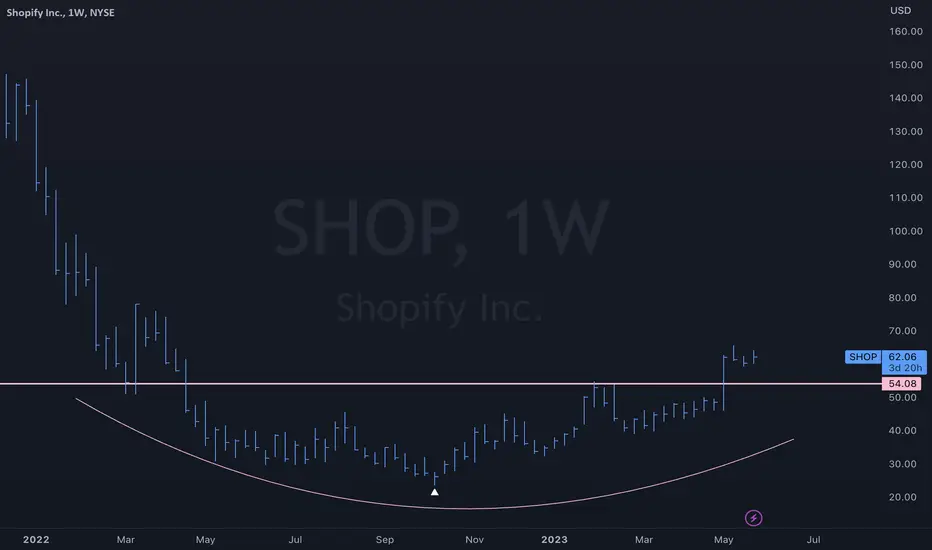
$SHOP Bottoming patternNYSE:SHOP Nice Bottoming patter on the weekly chart, starting bullish consolidation. Bullish above the horizontal line bearish below.
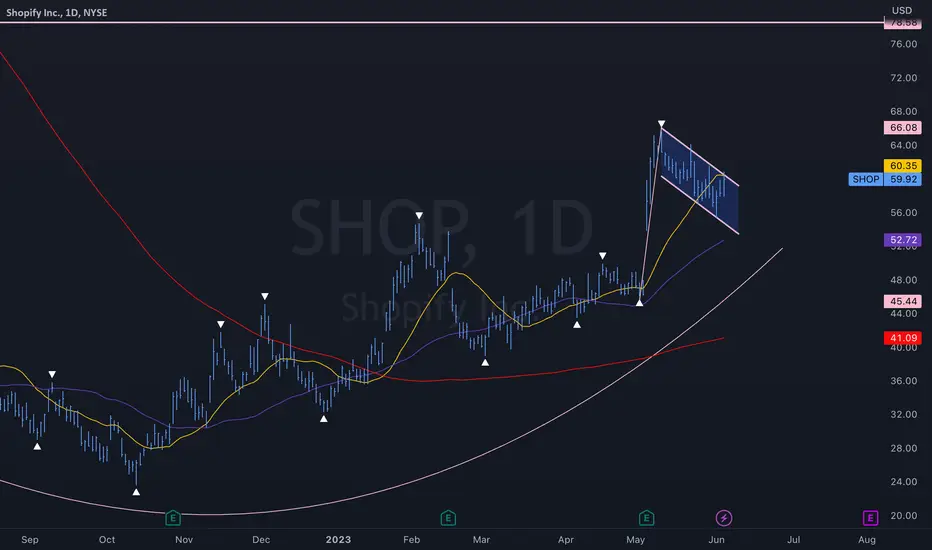
$SHOP - bull and bear thesisNYSE:SHOP
Daily timeframe
* Breakout of the bear flag, I think it goes to $72.90
Bull: If price breaks above the December 2018 anchored vwap, $72.90 is next
Bear: A rejection off the December 2018 anchored vwap, a move back to $39.80

$SHOP to move higher targeting $75, $100?NYSE:SHOP broke out of a 8.5 month inverse head and shoulders pattern back in January, then went back to test the breakout level as support and has now turned higher again.
The first target for the breakout of this pattern would be $63.89, however, after we hit that target, I think we'll see a continuation of the trend higher and get to HKEX:75 level.
And if it can flip the HKEX:75 level as resistance, I think it can get all the way back to $100. I do think $100 would be the top though as it would confirm resistance from the area it broke down from.
Let's see what happens over the next 2 months.
Shop stock shopify : "Dont overpay for seeds, if you want trees"Shop stock shopify : "Dont overpay for seeds, if you want trees"
Taking a look at Shopify earnings and a decade of potential.
thanks for the request, i hope it helps. @ www.tradingview.com

Amazon set to BREAKOUT or FALLOUTAs we analyze the 4 hour chart of Amazon I am honestly indifferent on the stock and would not be trading or buying it right now as it seems "stuck to me" based off these channels... When we look at the "macro" blue channel it shows upside with price pointing to higher 130s... but it would be a very swingy ride there.. right now we are in the white channel which is also very swingy and large for a channel to trade but profit to be made if TIMING is right... I have fib levels listing this as a Wave 2 and looking for more downside, but will continue to watch if we are to breakout of the resistance.. until then I would stay bearish.

Shopify: Lift Your (Shopping-)Bags! 🧺🛍Shopify should lift its laden shopping bags – or are they too heavy? We expect the share to move upwards, climbing above the resistance at $57.50 and further from there. There is a 31% chance, though, for Shopify to make a detour below the support at $38.90. In that case, the share would develop a new low in the form of wave alt.(B) in magenta first before heading upwards.
