There is a chance BTC can return the 80K zone - Data should confEven with the increase from 80K zone to up 86.7K, BTC is able to return from this zone into the breakdown trend, where this will go exactly the coming time frames, which should be confirmed with time. We need to confirm this, the data change, and the last data shows a bitcoin that can get a correction again.
Short!!!!

EURCHF: Weak Market & Bearish Continuation
The analysis of the EURCHF chart clearly shows us that the pair is finally about to tank due to the rising pressure from the sellers.
Disclosure: I am part of Trade Nation's Influencer program and receive a monthly fee for using their TradingView charts in my analysis.
❤️ Please, support our work with like & comment! ❤️

EURGBP: Short Signal with Entry/SL/TP
EURGBP
- Classic bearish formation
- Our team expects pullback
SUGGESTED TRADE:
Swing Trade
Short EURGBP
Entry - 0.8800
Sl - 0.8805
Tp - 0.8791
Our Risk - 1%
Start protection of your profits from lower levels
Disclosure: I am part of Trade Nation's Influencer program and receive a monthly fee for using their TradingView charts in my analysis.
❤️ Please, support our work with like & comment! ❤️

24/11/25 Weekly OutlookLast weeks high: $96,057.33
Last weeks low: $93,034.53
Midpoint: $80,642.73
Has Bitcoin found its low, or is there more downside to come?
After yet another brutal week of downtrend BTC tags $80,000 before bouncing back towards the weekly range midpoint at $88,000, a +10% bounce. It's important to note that back in April during the Tariff War sell-off, the $80,000 area was the origin of the subsequent move up to $110,000. So historically this area should provide support when retested as it has initially.
What this does mean to me, the high time frame trend has shifted from bullish with areas of choppy rangebound consolidation before the next leg up, to now a new lower high ($108,000 rejection) which confirmed the 1d 200 EMA as resistance, and much lower low ($80,000 last weeks low) which confirms a bearish flip.
For me this week it's about finding out if the bottom is already in or if not, where will it be? In terms of bullish target should the bottom already be in, it's the $98,000-$100,000 area. This key s/r level has been an important battleground since December '24, it's a big even level too so psychologically important, and the origin of this 20% sell-off. Fear & Greed Index currently sits at 19 but hit as low as 11 over the weekend, the lowest so far this bull run. These factors have me leaning towards the local bottom is in.
However, if the bottom is not in then $74,000 comes into play, the Tariff war low. That would complete a full retrace of this years move up to $126,000 (-40% from high). The current weekly low sits at -36% move which is the largest of the bull run so far but not uncommon in previous cycles.
Good luck this week everybody!

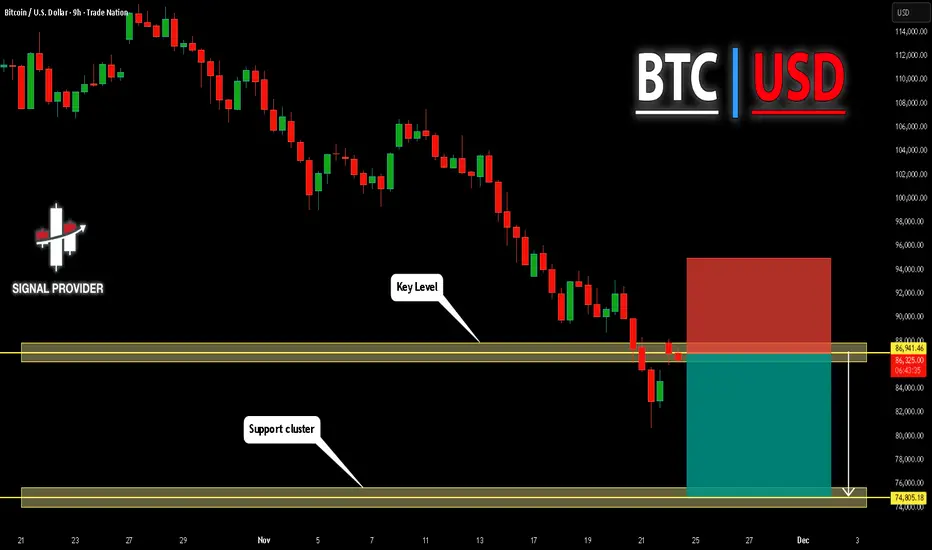
BITCOIN Will Fall! Sell!
Please, check our technical outlook for BITCOIN.
Time Frame: 9h
Current Trend: Bearish
Sentiment: Overbought (based on 7-period RSI)
Forecast: Bearish
The market is approaching a significant resistance area 86,941.46.
Due to the fact that we see a positive bearish reaction from the underlined area, I strongly believe that sellers will manage to push the price all the way down to 74,805.18 level.
P.S
Please, note that an oversold/overbought condition can last for a long time, and therefore being oversold/overbought doesn't mean a price rally will come soon, or at all.
Like and subscribe and comment my ideas if you enjoy them!
USDJPY Will Go Down From Resistance! Short!
Here is our detailed technical review for USDJPY.
Time Frame: 6h
Current Trend: Bearish
Sentiment: Overbought (based on 7-period RSI)
Forecast: Bearish
The market is on a crucial zone of supply 156.909.
The above-mentioned technicals clearly indicate the dominance of sellers on the market. I recommend shorting the instrument, aiming at 155.044 level.
P.S
The term oversold refers to a condition where an asset has traded lower in price and has the potential for a price bounce.
Overbought refers to market scenarios where the instrument is traded considerably higher than its fair value. Overvaluation is caused by market sentiments when there is positive news.
Like and subscribe and comment my ideas if you enjoy them!

GBPCAD: Bearish Forecast & Outlook
Looking at the chart of GBPCAD right now we are seeing some interesting price action on the lower timeframes. Thus a local move down seems to be quite likely.
Disclosure: I am part of Trade Nation's Influencer program and receive a monthly fee for using their TradingView charts in my analysis.
❤️ Please, support our work with like & comment! ❤️

EURAUD Will Go Lower! Sell!
Take a look at our analysis for EURAUD.
Time Frame: 4h
Current Trend: Bearish
Sentiment: Overbought (based on 7-period RSI)
Forecast: Bearish
The price is testing a key resistance 1.785.
Taking into consideration the current market trend & overbought RSI, chances will be high to see a bearish movement to the downside at least to 1.777 level.
P.S
We determine oversold/overbought condition with RSI indicator.
When it drops below 30 - the market is considered to be oversold.
When it bounces above 70 - the market is considered to be overbought.
Like and subscribe and comment my ideas if you enjoy them!

EURUSD: Short Signal Explained
EURUSD
- Classic bearish pattern
- Our team expects retracement
SUGGESTED TRADE:
Swing Trade
Sell EURUSD
Entry - 1.1530
Stop - 1.1537
Take - 1.1520
Our Risk - 1%
Start protection of your profits from lower levels
Disclosure: I am part of Trade Nation's Influencer program and receive a monthly fee for using their TradingView charts in my analysis.
❤️ Please, support our work with like & comment! ❤️

EURCAD Trading Opportunity! SELL!
My dear followers,
This is my opinion on the EURCAD next move:
The asset is approaching an important pivot point 1.6259
Bias - Bearish
Technical Indicators: Supper Trend generates a clear short signal while Pivot Point HL is currently determining the overall Bearish trend of the market.
Goal - 1.6220
About Used Indicators:
For more efficient signals, super-trend is used in combination with other indicators like Pivot Points.
Disclosure: I am part of Trade Nation's Influencer program and receive a monthly fee for using their TradingView charts in my analysis.
———————————
WISH YOU ALL LUCK

GBPAUD The Target Is DOWN! SELL!
My dear subscribers,
This is my opinion on the GBPAUD next move:
The instrument tests an important psychological level 2.0297
Bias - Bearish
Technical Indicators: Supper Trend gives a precise Bearish signal, while Pivot Point HL predicts price changes and potential reversals in the market.
Target - 2.0205
About Used Indicators:
On the subsequent day, trading above the pivot point is thought to indicate ongoing bullish sentiment, while trading below the pivot point indicates bearish sentiment.
Disclosure: I am part of Trade Nation's Influencer program and receive a monthly fee for using their TradingView charts in my analysis.
———————————
WISH YOU ALL LUCK

NATGAS Set To Fall! SELL!
My dear followers,
I analysed this chart on NATGAS and concluded the following:
The market is trading on 4.577pivot level.
Bias - Bearish
Technical Indicators: Both Super Trend & Pivot HL indicate a highly probable Bearish continuation.
Target - 4.474
About Used Indicators:
A super-trend indicator is plotted on either above or below the closing price to signal a buy or sell. The indicator changes color, based on whether or not you should be buying. If the super-trend indicator moves below the closing price, the indicator turns green, and it signals an entry point or points to buy.
Disclosure: I am part of Trade Nation's Influencer program and receive a monthly fee for using their TradingView charts in my analysis.
———————————
WISH YOU ALL LUCK

SILVER BEARS ARE STRONG HERE|SHORT
SILVER SIGNAL
Trade Direction: short
Entry Level: 4,992.1
Target Level: 4,536.3
Stop Loss: 5,296.0
RISK PROFILE
Risk level: medium
Suggested risk: 1%
Timeframe: 1D
Disclosure: I am part of Trade Nation's Influencer program and receive a monthly fee for using their TradingView charts in my analysis.
✅LIKE AND COMMENT MY IDEAS✅

GBP/CHF SHORT FROM RESISTANCE
GBP/CHF SIGNAL
Trade Direction: short
Entry Level: 1.059
Target Level: 1.049
Stop Loss: 1.066
RISK PROFILE
Risk level: medium
Suggested risk: 1%
Timeframe: 6h
Disclosure: I am part of Trade Nation's Influencer program and receive a monthly fee for using their TradingView charts in my analysis.
✅LIKE AND COMMENT MY IDEAS✅

EUR/CHF BEARS WILL DOMINATE THE MARKET|SHORT
Hello, Friends!
EUR/CHF pair is in the uptrend because previous week’s candle is green, while the price is evidently rising on the 1D timeframe. And after the retest of the resistance line above I believe we will see a move down towards the target below at 0.925 because the pair overbought due to its proximity to the upper BB band and a bearish correction is likely.
Disclosure: I am part of Trade Nation's Influencer program and receive a monthly fee for using their TradingView charts in my analysis.
✅LIKE AND COMMENT MY IDEAS✅

NATGAS: Expecting Bearish Continuation! Here is Why:
Remember that we can not, and should not impose our will on the market but rather listen to its whims and make profit by following it. And thus shall be done today on the NATGAS pair which is likely to be pushed down by the bears so we will sell!
Disclosure: I am part of Trade Nation's Influencer program and receive a monthly fee for using their TradingView charts in my analysis.
❤️ Please, support our work with like & comment! ❤️

US30: Bearish Continuation & Short Signal
US30
- Classic bearish formation
- Our team expects fall
SUGGESTED TRADE:
Swing Trade
Sell US30
Entry Level - 46270
Sl - 46419
Tp - 46011
Our Risk - 1%
Start protection of your profits from lower levels
Disclosure: I am part of Trade Nation's Influencer program and receive a monthly fee for using their TradingView charts in my analysis.
❤️ Please, support our work with like & comment! ❤️

EURCHF What Next? SELL!
My dear friends,
Please, find my technical outlook for EURCHF below:
The price is coiling around a solid key level - 0.9308
Bias - Bearish
Technical Indicators: Pivot Points Low anticipates a potential price reversal.
Super trend shows a clear sell, giving a perfect indicators' convergence.
Goal - 0.9300
Safe Stop Loss - 0.9313
About Used Indicators:
The pivot point itself is simply the average of the high, low and closing prices from the previous trading day.
Disclosure: I am part of Trade Nation's Influencer program and receive a monthly fee for using their TradingView charts in my analysis.
———————————
WISH YOU ALL LUCK

NZDUSD My Opinion! SELL!
My dear friends,
My technical analysis for NZDUSD is below:
The market is trading on 0.5611 pivot level.
Bias - Bearish
Technical Indicators: Both Super Trend & Pivot HL indicate a highly probable Bearish continuation.
Target - 0.5598
Recommended Stop Loss - 0.5619
About Used Indicators:
A pivot point is a technical analysis indicator, or calculations, used to determine the overall trend of the market over different time frames.
Disclosure: I am part of Trade Nation's Influencer program and receive a monthly fee for using their TradingView charts in my analysis.
———————————
WISH YOU ALL LUCK

Light crude oil On oil, I like two levels for trade, one is short from the approximate price of 66.3, where a deviation above the high could be created, and the close fibo level of 0.5 adds to the confluence, and the daily level on the long, I would like a drop at least below the value low around the price level of 57.46, where the daily level is also nearby

EURUSD: Targets focus on declines to 1.1480 support levelHello everyone, here is my breakdown of the current Euro setup.
Market Analysis
EURUSD continues to trade within a clear Downward Channel, maintaining a strong bearish structure characterized by consistent lower highs and lower lows. Early in the chart, the pair formed a prolonged Range Phase, signaling indecision before sellers eventually took control and pushed the price downward. After breaking below the range, EURUSD repeatedly retested the Resistance Area around 1.1550, where the market showed strong bearish reactions. Each bounce into this resistance zone resulted in a clear rejection, proving that sellers consistently defend this area. The chart also highlights multiple Breakout attempts, all of which failed to sustain upward continuation, confirming a lack of bullish strength. Additionally, the chart shows the formation of a Triangle Pattern, with price reacting between the Triangle Resistance Line and the Triangle Support Line. Despite temporary recoveries, every move upward was limited and capped by descending trendline pressure.
Currently, EURUSD broke below the minor structure support again, demonstrating that bearish momentum remains dominant. Price is now heading toward the Support Zone near 1.1480, which aligns with both horizontal demand and the Triangle Support Line. This confluence makes it a key level to watch. As long as EURUSD trades below the 1.1550 Resistance Area and stays inside the Downward Channel, the bearish structure remains intact. Any bullish recovery is likely to be corrective rather than trend-changing unless buyers manage to break above major resistance.
My Scenario & Strategy
I expect EURUSD to continue edging lower toward the 1.1480 Support Zone, following the recent rejection from resistance. A minor upward correction may occur, potentially retesting broken support or the Triangle Resistance Line, but such a move would likely be short-lived without strong bullish confirmation.
A confirmed breakdown below 1.1480 would open the path for deeper bearish continuation within the Downward Channel. Only a solid breakout above 1.1550, backed by strong buying pressure, would challenge the prevailing bearish trend. For now, selling the pullbacks remains the more favorable strategy while price stays below major resistance.
That's the setup I'm tracking. Thank you for your attention, and always manage your risk.

EURUSD Weakens at Resistance — Pullback Toward 1.1480 ExpectedHello traders! Let’s break down the current EURUSD structure. EURUSD continues to trade inside a broad descending channel, where both the resistance and support lines have been respected multiple times, forming a steady sequence of lower highs and lower lows. Each touch of the upper boundary resulted in a clear Turned Around reaction, confirming the strength of seller control within the overall bearish trend. Earlier, the pair entered a range phase in the left section of the chart, where price consolidated before breaking to the downside. This breakout accelerated bearish momentum, pushing EURUSD toward the lower half of the channel. Subsequent attempts at recovery formed shallow corrections, each aligning with the mid-channel dashed trendline, signaling persistent downward pressure. Recently, price approached the Buyer Zone near the 1.1480–1.1500 region, which also overlaps with the broader Support Level and the lower boundary of the descending channel. This area has previously acted as a strong reaction zone, and buyers are once again attempting to hold this level. At the moment, the EURUSD pair is showing early signs of a potential corrective rebound, with the price aiming for the nearest resistance level around 1.1540, which also coincides with the seller's zone. This region previously acted as support, and is now expected to serve as a barrier for a retest. As long as the pair remains below the descending resistance line, the broader trend remains bearish. A short-term correction to the level around 1.1540 is likely if buyers continue to defend the support level. However, a deviation from the resistance cluster could trigger renewed selling pressure, potentially sending EURUSD back to the channel bottom for another reaction. In my opinion, the price will move towards TP1 with a target of 1.14800. A confirmed break above the descending resistance line would be the first sign of a possible bullish shift, opening the door for a stronger recovery. Please share this idea with your friends and click "Boost" 🚀

US30 BEARS ARE GAINING STRENGTH|SHORT
US30 SIGNAL
Trade Direction: short
Entry Level: 46,264.6
Target Level: 45,574.0
Stop Loss: 46,722.1
RISK PROFILE
Risk level: medium
Suggested risk: 1%
Timeframe: 4h
Disclosure: I am part of Trade Nation's Influencer program and receive a monthly fee for using their TradingView charts in my analysis.
✅LIKE AND COMMENT MY IDEAS✅
