GBPCHF: Market of Sellers
It is essential that we apply multitimeframe technical analysis and there is no better example of why that is the case than the current GBPCHF chart which, if analyzed properly, clearly points in the downward direction.
Disclosure: I am part of Trade Nation's Influencer program and receive a monthly fee for using their TradingView charts in my analysis.
❤️ Please, support our work with like & comment! ❤️
Short!!!!

NZDCAD: Short Trade Explained
NZDCAD
- Classic bearish formation
- Our team expects fall
SUGGESTED TRADE:
Swing Trade
Sell NZDCAD
Entry Level - 0.7912
Sl - 0.7921
Tp - 0.7894
Our Risk - 1%
Start protection of your profits from lower levels
Disclosure: I am part of Trade Nation's Influencer program and receive a monthly fee for using their TradingView charts in my analysis.
❤️ Please, support our work with like & comment! ❤️

NZDJPY Buyers In Panic! SELL!
My dear subscribers,
My technical analysis for NZDJPY is below:
The price is coiling around a solid key level - 88.787
Bias - Bearish
Technical Indicators: Pivot Points Low anticipates a potential price reversal.
Super trend shows a clear sell, giving a perfect indicators' convergence.
Goal - 88.343
My Stop Loss - 89.041
About Used Indicators:
By the very nature of the supertrend indicator, it offers firm support and resistance levels for traders to enter and exit trades. Additionally, it also provides signals for setting stop losses
Disclosure: I am part of Trade Nation's Influencer program and receive a monthly fee for using their TradingView charts in my analysis.
———————————
WISH YOU ALL LUCK

GBPUSD Is Very Bearish! Sell!
Here is our detailed technical review for GBPUSD.
Time Frame: 4h
Current Trend: Bearish
Sentiment: Overbought (based on 7-period RSI)
Forecast: Bearish
The market is testing a major horizontal structure 1.315.
Taking into consideration the structure & trend analysis, I believe that the market will reach 1.311 level soon.
P.S
We determine oversold/overbought condition with RSI indicator.
When it drops below 30 - the market is considered to be oversold.
When it bounces above 70 - the market is considered to be overbought.
Like and subscribe and comment my ideas if you enjoy them!

USOIL BEARISH BIAS RIGHT NOW| SHORT
USOIL SIGNAL
Trade Direction: short
Entry Level: 59.57
Target Level: 56.37
Stop Loss: 61.70
RISK PROFILE
Risk level: medium
Suggested risk: 1%
Timeframe: 1D
Disclosure: I am part of Trade Nation's Influencer program and receive a monthly fee for using their TradingView charts in my analysis.
✅LIKE AND COMMENT MY IDEAS✅

NZD/CAD BEARS ARE STRONG HERE|SHORT
Hello, Friends!
The BB upper band is nearby so NZD-CAD is in the overbought territory. Thus, despite the uptrend on the 1W timeframe I think that we will see a bearish reaction from the resistance line above and a move down towards the target at around 0.788.
Disclosure: I am part of Trade Nation's Influencer program and receive a monthly fee for using their TradingView charts in my analysis.
✅LIKE AND COMMENT MY IDEAS✅

EUR/USD SENDS CLEAR BEARISH SIGNALS|SHORT
EUR/USD SIGNAL
Trade Direction: short
Entry Level: 1.159
Target Level: 1.156
Stop Loss: 1.160
RISK PROFILE
Risk level: medium
Suggested risk: 1%
Timeframe: 1h
Disclosure: I am part of Trade Nation's Influencer program and receive a monthly fee for using their TradingView charts in my analysis.
✅LIKE AND COMMENT MY IDEAS✅

EURUSD Short: Price Sliding Back Toward 1.1540 SupportHello traders! EURUSD continues to move within a broader bearish trend structure, consistently respecting the descending Trend Line that has acted as a dynamic resistance for several weeks. Each retest of this line has resulted in strong bearish reactions, confirming persistent seller dominance. Throughout the decline, the market formed several pivot points and repeated breakouts, showing how price reacts to key liquidity areas. A notable pattern on the chart is the Rounding Top, which formed near the mid-trend zone and signaled an early shift from bullish correction to renewed bearish pressure. After completing this pattern, EURUSD dropped sharply, breaking down through support and heading toward the demand area. Recently, price attempted a breakout above the descending Trend Line but created a Fake Breakout, indicating that buyers were unable to hold gains above resistance. This rejection occurred inside the Supply Zone around 1.1620, reinforcing the bearish sentiment.
Currently, EURUSD is trading below the trend line once again, showing weakening bullish attempts and maintaining the overall downward trajectory. Price is slowly drifting toward the Demand Zone at 1.15400, which has previously served as a strong reaction area.
My scenario if EURUSD fails to break the descending Trend Line and stays below the Supply Zone, the pair is likely to continue moving lower toward the 1.15400 Demand Zone. This area is the next major support and the most probable target for sellers. However, if buyers defend the current levels and push price back toward resistance, a short-term correction toward the trend line may occur before another bearish impulse. A confirmed break below 1.15400 would open the way for further downside continuation, in line with the broader bearish structure. For now, the bias remains bearish while price trades under the Trend Line and below 1.1620. Manage your risk!

EURUSD: Sellers Target Move Toward 1.1550 Support ZoneHello everyone, here is my breakdown of the current Euro setup.
Market Analysis
EURUSD is currently reacting within a broader corrective structure after failing to break above the major Resistance Area around 1.16500. This zone has repeatedly acted as a strong supply region, where price formed multiple rejection points and false breakouts. Each attempt to move higher was stopped by the descending Resistance Line, confirming continued bearish pressure. Earlier, EURUSD moved inside a wide Range Phase, followed by a breakout that initiated an upward correction inside an Upward Channel. However, bullish momentum weakened once price reached the upper boundary of the channel and the major resistance area. This led to a strong reversal and a bearish breakout below channel support.
Currently, EURUSD is climbing again toward the same Resistance Area near 1.16500, but the structure suggests the move is likely a corrective pullback, not a trend reversal. Price is approaching the intersection of the Resistance Line and the Resistance Zone, creating a confluence area where sellers are expected to regain control.As long as the market trades below this resistance cluster, the overall trend remains bearish. A rejection from the 1.16500 level could trigger a decline toward the Support Zone at 1.15550, which previously acted as a key demand region.
My Scenario & Strategy
I expect EURUSD to complete its pullback soon and resume the bearish trend once price reaches the 1.16500 Resistance Area. This zone remains the strongest supply region in the current structure. Potential short entries become valid once bearish confirmation appears near 1.16500, with the primary target at the 1.15550 Support Zone (TP1).
A clean breakdown below 1.15550 would signal continuation of the downtrend.
Alternatively, if EURUSD successfully breaks above 1.16500 and stays above the descending resistance line, bullish momentum may develop — but for now, this scenario remains secondary. Market bias stays bearish as long as price trades below resistance.
That's the setup I'm tracking. Thank you for your attention, and always manage your risk.

BITCOIN – THE TIDES ARE TURNING Traders,
On November 5 I mapped out a scenario where Bitcoin would push into 107k to 108k and then decline to 98k first and 89k second.
This entire scenario has now played out perfectly to the pixel. We swept 108k, we dumped to 98k, and then we flushed into 89k. Where I expected price to retrace from exactly this level: $88.912
So the real question now is simple. What now? Do we break lower, or do we go up?
Let’s break Bitcoin down cleanly, without bias, and only by reading structure, levels, and order flow.
Levels, Structure and Order Flow
AVWAP at the core of the structure
Bitcoin is currently trading right near the AVWAP from the 06 August 24 anchor. This is the blue line on your chart and the exact level is 90.881. This anchor began with a large volume impulse.
When heavy volume kicks off a leg, the AVWAP from that point becomes a core reference level for the entire future auction. We are now sitting right on top of it, which is exactly where you would expect absorption or a strong reaction.
The market is basically deciding if this AVWAP will hold or break.
AB=CD completion
The full AB=CD measured move has completed exactly into the AVWAP zone. This is a clean harmonic completion and adds confluence to why price reacted here. AB=CD means the downside leg is symmetrical and usually marks exhaustion inside a trend.
Fixed Range Volume Profile
Using a FRVP from the start of the current HTF auction (07 April until now), we see price wicked directly into the LVN that sits inside the weekly FVG. This area had imbalance and low participation. A wick into an LVN inside an FVG often means that the inefficiency is now cleaned and the auction has reached completion for that side of the range.
Wedge breakout
Bitcoin technically broke out of the falling wedge, but the breakout does not look clean.
We are outside the wedge, but momentum on the breakout is weak. True confirmation would come if price re-enters the wedge from the outside and climbs back through the wedge body.
Re-entering the wedge tells you that the breakdown was liquidity and not a structural continuation. If we reclaim it, upside targets become more likely.
Order Flow – What the data shows
Spot and Futures CVD
Across the 15m, 30m and 1h charts, Spot CVD is forming a bullish divergence. Price keeps making lower lows, but Spot CVD is holding higher. This shows that spot buyers are stepping in at the lows and absorbing sell pressure.
Futures CVD on both stablecoin margined and coin margined contracts continues to push lower.
Price is not following these lower lows. This creates hidden bullish divergence and confirms that aggressive sellers are hitting the market while limit buyers are absorbing the pressure.
This is a classic sign of absorption. Selling continues, but the market is refusing to break lower with the same intensity.
Open Interest – A shift
Earlier in the dump, Open Interest was falling. This means positions were being closed.
Most of this was shorts taking profit or exiting the move. When OI drops during a downtrend, continuation becomes harder because the move loses fuel.
Near the end of the screenshots, there is a shift. Both stablecoin margined and coin margined OI start to rise again.
This rise in OI happens while:
CVD continues to make lower lows
Price stops making new lows
Price begins to stabilize
This tells us that new positions are being opened at the lows. Given the CVD behavior, most of these are new shorts entering the market.
When new shorts enter and price does not break, the probability of those shorts becoming trapped increases. If buyers step in, this setup often leads to a short squeeze.
This is how reversals form in a controlled market.
Funding rate – Binance
Funding is positive but very small. This means there is no extreme long pressure. There is no overcrowding on the long side. The market is not stretched. With fresh shorts entering at the lows and funding staying neutral, the market can turn quickly if support holds.
What this means
The combination of:
Spot CVD divergence
Hidden bullish divergence on futures CVD
Rising Open Interest at the lows
Neutral funding
Price refusing to break down - So price needs to hold.
shows that the market is absorbing aggressive selling at a key level. If buyers defend the current level, this can force newly opened shorts to cover, which would fuel the next move up.
Targets
109k
This is the first upside objective.
There is a CME ETH gap resting at this level and gaps of this type tend to get filled.
109k also aligns with the 1.113 Fibonacci extension of the latest wave.
This makes it the first logical level if price continues to hold the AVWAP and absorb selling pressure.
112k
The next major level is 112k.
This area contains single prints on CME and matches an AVWAP level on the BTC CME chart.
112k also lines up with the 1.272 extension of the wave.
From a Fibonacci rotation perspective, 1.272 is the next stop after 1.113 and often acts as a mid-cycle continuation target.
118.800
The final target sits at 118.800.
This is the full 1.618 extension of the wave and mathematically completes the auction.
If the market rotates from AVWAP support, this level becomes the natural endpoint of the move.
As long as price continues to hold the AVWAP at 90.881 and the market keeps absorbing futures selling, all three upside targets remain in play.
Invalidation
The structure changes only if price breaks below 88k. A clean drop under 88k opens the door for the next major high timeframe support at 85k.
85k carries strong confluence. It aligns with the 0.786 Fibonacci retracement on the HTF move and sits directly on a Point of Control zone within the Fixed Range Volume Profile.
Below that level, the auction shifts into a lower structure entirely.
TLDR
Bitcoin completed the downside scenario perfectly.
Price is now sitting directly on the AVWAP at 90.881.
AB=CD is complete.
LVN inside weekly FVG has been cleaned.
Futures CVD is still pressing lower but price is not. That is absorption.
But the key update is OI. OI was dropping earlier on the LTF, but now OI is rising again, and this is happening while CVD continues down and price holds steady.
That means new shorts are entering the market and getting absorbed.
If AVWAP holds, expect a bounce.
Targets:
109k
112k
118.8k
If 88k breaks, 85k is next.
--------
Abbreviation List
AVWAP
Anchored Volume Weighted Average Price. A dynamic support or resistance level based on volume since a chosen anchor.
AB=CD
A harmonic measured move where AB equals CD.
FRVP
Fixed Range Volume Profile. Shows where volume was traded inside a chosen range.
LVN
Low Volume Node. A low interest level where price often rejects strongly.
FVG
Fair Value Gap. An imbalance left by aggressive price moves.
CVD
Cumulative Volume Delta. Tracks buying vs selling pressure.
OI
Open Interest. The amount of open futures positions.
POC
Point of Control. Level with the highest traded volume.
--------
If you like this kind of analysis, drop a like and leave a comment. Everything here is shared for free so more people can cut through the noise and finally see what is actually happening under the surface. No hopium. No fear. Just real data, real structure, and real order flow.
The goal is simple. To help traders stop guessing and start understanding what the market is actually saying.
Stay sharp.
Stay objective.
And remember… the chart whispers long before it speaks.
- ThetaNomad

AUDJPY Massive Short! SELL!
My dear followers,
This is my opinion on the AUDJPY next move:
The asset is approaching an important pivot point 101.34
Bias - Bearish
Technical Indicators: Supper Trend generates a clear short signal while Pivot Point HL is currently determining the overall Bearish trend of the market.
Goal - 100.96
About Used Indicators:
For more efficient signals, super-trend is used in combination with other indicators like Pivot Points.
Disclosure: I am part of Trade Nation's Influencer program and receive a monthly fee for using their TradingView charts in my analysis.
———————————
WISH YOU ALL LUCK

GBPUSD A Fall Expected! SELL!
My dear friends,
GBPUSD looks like it will make a good move, and here are the details:
The market is trading on 1.3181 pivot level.
Bias - Bearish
Technical Indicators: Supper Trend generates a clear short signal while Pivot Point HL is currently determining the overall Bearish trend of the market.
Goal - 1.3152
About Used Indicators:
Pivot points are a great way to identify areas of support and resistance, but they work best when combined with other kinds of technical analysis
Disclosure: I am part of Trade Nation's Influencer program and receive a monthly fee for using their TradingView charts in my analysis.
———————————
WISH YOU ALL LUCK

EURAUD Technical Analysis! SELL!
My dear followers,
I analysed this chart on EURAUD and concluded the following:
The market is trading on 1.7853 pivot level.
Bias - Bearish
Technical Indicators: Both Super Trend & Pivot HL indicate a highly probable Bearish continuation.
Target - 1.7776
About Used Indicators:
A super-trend indicator is plotted on either above or below the closing price to signal a buy or sell. The indicator changes color, based on whether or not you should be buying. If the super-trend indicator moves below the closing price, the indicator turns green, and it signals an entry point or points to buy.
Disclosure: I am part of Trade Nation's Influencer program and receive a monthly fee for using their TradingView charts in my analysis.
———————————
WISH YOU ALL LUCK

USDCHF: Bearish Continuation
The analysis of the USDCHF chart clearly shows us that the pair is finally about to tank due to the rising pressure from the sellers.
Disclosure: I am part of Trade Nation's Influencer program and receive a monthly fee for using their TradingView charts in my analysis.
❤️ Please, support our work with like & comment! ❤️

USDCAD Under Pressure! SELL!
My dear subscribers,
This is my opinion on the USDCAD next move:
The instrument tests an important psychological level 1.4029
Bias - Bearish
Technical Indicators: Supper Trend gives a precise Bearish signal, while Pivot Point HL predicts price changes and potential reversals in the market.
Target - 1.4009
My Stop Loss - 1.4041
About Used Indicators:
On the subsequent day, trading above the pivot point is thought to indicate ongoing bullish sentiment, while trading below the pivot point indicates bearish sentiment.
Disclosure: I am part of Trade Nation's Influencer program and receive a monthly fee for using their TradingView charts in my analysis.
———————————
WISH YOU ALL LUCK

SILVER Will Go Down From Resistance! Short!
Take a look at our analysis for SILVER.
Time Frame: 1D
Current Trend: Bearish
Sentiment: Overbought (based on 7-period RSI)
Forecast: Bearish
The market is approaching a key horizontal level 5,142.9.
Considering the today's price action, probabilities will be high to see a movement to 4,723.3.
P.S
The term oversold refers to a condition where an asset has traded lower in price and has the potential for a price bounce.
Overbought refers to market scenarios where the instrument is traded considerably higher than its fair value. Overvaluation is caused by market sentiments when there is positive news.
Like and subscribe and comment my ideas if you enjoy them!

USDJPY Will Go Down! Sell!
Here is our detailed technical review for USDJPY.
Time Frame: 1D
Current Trend: Bearish
Sentiment: Overbought (based on 7-period RSI)
Forecast: Bearish
The market is on a crucial zone of supply 155.460.
The above-mentioned technicals clearly indicate the dominance of sellers on the market. I recommend shorting the instrument, aiming at 152.862 level.
P.S
Overbought describes a period of time where there has been a significant and consistent upward move in price over a period of time without much pullback.
Like and subscribe and comment my ideas if you enjoy them!

GBPAUD Will Move Lower! Short!
Take a look at our analysis for GBPAUD.
Time Frame: 6h
Current Trend: Bearish
Sentiment: Overbought (based on 7-period RSI)
Forecast: Bearish
The price is testing a key resistance 2.023.
Taking into consideration the current market trend & overbought RSI, chances will be high to see a bearish movement to the downside at least to 2.006 level.
P.S
Please, note that an oversold/overbought condition can last for a long time, and therefore being oversold/overbought doesn't mean a price rally will come soon, or at all.
Like and subscribe and comment my ideas if you enjoy them!

EURUSD Rejected From Resistance — Pullback Toward 1.1560 in PlayHello traders! Let’s analyze the current EURUSD market structure. EURUSD continues to move within a broad descending channel, where both the Resistance Line and the Support Line have been respected multiple times, confirming a well-defined bearish market structure. Throughout the past sessions, price formed several Range phases near key levels, followed by Breakouts that maintained the overall downward momentum. Recently, EURUSD approached the upper boundary of the channel and reacted strongly from the major Resistance Level near 1.16600, which overlaps with the Seller Zone. This area has triggered multiple Turned Around movements in the past, reinforcing its importance as a supply region where sellers consistently regain control. After rejecting this resistance, price started a downward move toward the mid-range structure. The pair is now approaching the Buyer Zone around 1.15500–1.15600, which aligns with both the local support area and previous Range accumulation. This zone has historically served as a strong reaction level, where short-term bullish corrections often began. As long as EURUSD remains below the descending channel’s resistance and fails to break above the Seller Zone, the bearish structure remains intact. A continuation toward TP1: 1.15600 is the most likely scenario in the short term, especially if sellers maintain momentum below the 1.16200 area. A clean break below the Buyer Zone could open the door for a deeper decline toward the Support Line at the bottom of the channel. On the other hand, a confirmed breakout above the 1.16600 Resistance Level would invalidate the current bearish view and potentially shift the trend toward recovery. Please share this idea with your friends and click Boost 🚀

AUD/CHF BEARS ARE GAINING STRENGTH|SHORT
Hello, Friends!
We are targeting the 0.514 level area with our short trade on AUD/CHF which is based on the fact that the pair is overbought on the BB band scale and is also approaching a resistance line above thus going us a good entry option.
Disclosure: I am part of Trade Nation's Influencer program and receive a monthly fee for using their TradingView charts in my analysis.
✅LIKE AND COMMENT MY IDEAS✅

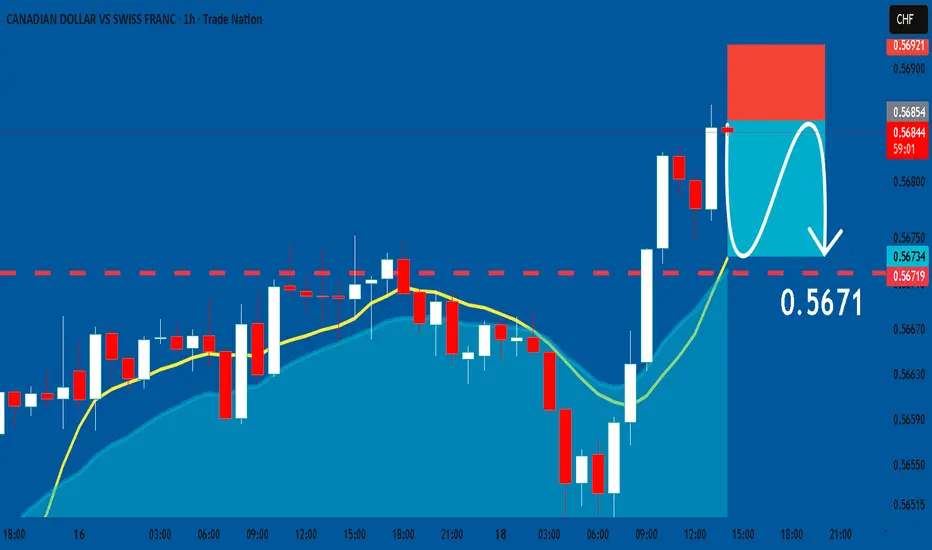
CADCHF: Short Signal with Entry/SL/TP
CADCHF
- Classic bearish formation
- Our team expects pullback
SUGGESTED TRADE:
Swing Trade
Short CADCHF
Entry - 0.5685
Sl - 0.5692
Tp - 0.5671
Our Risk - 1%
Start protection of your profits from lower levels
Disclosure: I am part of Trade Nation's Influencer program and receive a monthly fee for using their TradingView charts in my analysis.
❤️ Please, support our work with like & comment! ❤️
GOLD SENDS CLEAR BEARISH SIGNALS|SHORT
GOLD SIGNAL
Trade Direction: short
Entry Level: 4,168.46
Target Level: 4,053.04
Stop Loss: 4,244.92
RISK PROFILE
Risk level: medium
Suggested risk: 1%
Timeframe: 9h
Disclosure: I am part of Trade Nation's Influencer program and receive a monthly fee for using their TradingView charts in my analysis.
✅LIKE AND COMMENT MY IDEAS✅

EURGBP Is Going Down! Short!
Take a look at our analysis for EURGBP.
Time Frame: 1h
Current Trend: Bearish
Sentiment: Overbought (based on 7-period RSI)
Forecast: Bearish
The market is approaching a key horizontal level 0.881.
Considering the today's price action, probabilities will be high to see a movement to 0.880.
P.S
Overbought describes a period of time where there has been a significant and consistent upward move in price over a period of time without much pullback.
Like and subscribe and comment my ideas if you enjoy them!
