USDCAD My Opinion! SELL!
My dear friends,
My technical analysis for USDCAD is below:
The market is trading on 1.4027 pivot level.
Bias - Bearish
Technical Indicators: Both Super Trend & Pivot HL indicate a highly probable Bearish continuation.
Target - 1.4012
Recommended Stop Loss - 1.4037
About Used Indicators:
A pivot point is a technical analysis indicator, or calculations, used to determine the overall trend of the market over different time frames.
Disclosure: I am part of Trade Nation's Influencer program and receive a monthly fee for using their TradingView charts in my analysis.
———————————
WISH YOU ALL LUCK
Short!!!!

SILVER Is Bearish! Short!
Please, check our technical outlook for SILVER.
Time Frame: 1D
Current Trend: Bearish
Sentiment: Overbought (based on 7-period RSI)
Forecast: Bearish
The market is trading around a solid horizontal structure 4,794.2.
The above observations make me that the market will inevitably achieve 4,123.0 level.
P.S
The term oversold refers to a condition where an asset has traded lower in price and has the potential for a price bounce.
Overbought refers to market scenarios where the instrument is traded considerably higher than its fair value. Overvaluation is caused by market sentiments when there is positive news.
Like and subscribe and comment my ideas if you enjoy them!

EURUSD Is Very Bearish! Sell!
Here is our detailed technical review for EURUSD.
Time Frame: 2h
Current Trend: Bearish
Sentiment: Overbought (based on 7-period RSI)
Forecast: Bearish
The market is testing a major horizontal structure 1.158.
Taking into consideration the structure & trend analysis, I believe that the market will reach 1.154 level soon.
P.S
We determine oversold/overbought condition with RSI indicator.
When it drops below 30 - the market is considered to be oversold.
When it bounces above 70 - the market is considered to be overbought.
Like and subscribe and comment my ideas if you enjoy them!

USOIL BEARISH BIAS RIGHT NOW| SHORT
USOIL SIGNAL
Trade Direction: short
Entry Level: 58.02
Target Level: 57.01
Stop Loss: 58.69
RISK PROFILE
Risk level: medium
Suggested risk: 1%
Timeframe: 2h
Disclosure: I am part of Trade Nation's Influencer program and receive a monthly fee for using their TradingView charts in my analysis.
✅LIKE AND COMMENT MY IDEAS✅

CAD/CHF BEST PLACE TO SELL FROM|SHORT
CAD/CHF SIGNAL
Trade Direction: short
Entry Level: 0.568
Target Level: 0.564
Stop Loss: 0.570
RISK PROFILE
Risk level: medium
Suggested risk: 1%
Timeframe: 5h
Disclosure: I am part of Trade Nation's Influencer program and receive a monthly fee for using their TradingView charts in my analysis.
✅LIKE AND COMMENT MY IDEAS✅

NZD/CAD BEARS ARE STRONG HERE|SHORT
Hello, Friends!
Bearish trend on NZD/CAD, defined by the red colour of the last week candle combined with the fact the pair is overbought based on the BB upper band proximity, makes me expect a bearish rebound from the resistance line above and a retest of the local target below at 0.801.
Disclosure: I am part of Trade Nation's Influencer program and receive a monthly fee for using their TradingView charts in my analysis.
✅LIKE AND COMMENT MY IDEAS✅

CHF/JPY SHORT FROM RESISTANCE
Hello, Friends!
CHF-JPY uptrend evident from the last 1W green candle makes short trades more risky, but the current set-up targeting 188.106 area still presents a good opportunity for us to sell the pair because the resistance line is nearby and the BB upper band is close which indicates the overbought state of the CHF/JPY pair.
Disclosure: I am part of Trade Nation's Influencer program and receive a monthly fee for using their TradingView charts in my analysis.
✅LIKE AND COMMENT MY IDEAS✅

GBP/NZD SHORT FROM RESISTANCE
Hello, Friends!
We are now examining the GBP/NZD pair and we can see that the pair is going up locally while also being in a uptrend on the 1W TF. But there is also a powerful signal from the BB upper band being nearby, indicating that the pair is overbought so we can go short from the resistance line above and a target at 2.320 level.
Disclosure: I am part of Trade Nation's Influencer program and receive a monthly fee for using their TradingView charts in my analysis.
✅LIKE AND COMMENT MY IDEAS✅

GBP/CAD BEST PLACE TO SELL FROM|SHORT
GBP/CAD SIGNAL
Trade Direction: short
Entry Level: 1.883
Target Level: 1.871
Stop Loss: 1.891
RISK PROFILE
Risk level: medium
Suggested risk: 1%
Timeframe: 12h
Disclosure: I am part of Trade Nation's Influencer program and receive a monthly fee for using their TradingView charts in my analysis.
✅LIKE AND COMMENT MY IDEAS✅

GBP/JPY Short Trade Setup – H1 TimeframeFollowing last week’s gap open after the Japanese elections, GBP/JPY has shown significant signs of distribution on the 1-hour chart. Many traders entered short positions prematurely during the immediate post-gap volatility, resulting in widespread stop-outs and losses.
Today, the UK CPI print came in at 4.0%, marking the highest inflation level since 2020. This stronger-than-expected inflation data initially supported the pound, but price action now appears to be exhausting into key resistance, suggesting a potential short opportunity.
I initiated a short position at 203.30—an early entry anticipating further weakness. However, based on the current structure and my technical levels, there is still a valid opportunity to enter now with proper confirmation and alignment to my key levels.
Note: Risk management remains paramount. Ensure your position sizing, stop placement, and trade plan are consistent with your overall trading strategy.

NASDAQ Short There is a lot of resistance, as it is at an all-time high and is unable to break this level
There are 2 patterns on M15 and M30 showing a potential reversal zone
This is against the H4 trend; however, it is overbought on H1
RSI is showing strong divergence with a triple top on H1
Stoploss above 21300
First target 24870 or when M15 is oversold

XAUUSD: Price can Drop to Support Zone and Break Trend LineHello everyone, here is my breakdown of the current Gold setup.
Market Analysis
Gold has been in a very strong uptrend, which accelerated after breaking out of a prior Upward Channel. This led to a new, steeper rally along a major Trend Line, culminating in a new All-Time High around the 4380 mark.
Currently, after reaching that peak, the price has completed a healthy correction back down to the main Trend Line, which also aligns with the Support zone at the 4250 level. The price has bounced from this area and is now attempting to rally again.
My Scenario & Strategy
My scenario is a bearish one, built on the idea that this second attempt to rally will fail to make a new high. I'm looking for this current rally to lose momentum as it approaches the prior ATH of 4380. The key signal for me would be a strong and clear rejection from that area, showing that buyers no longer have the strength to continue pushing the price higher.
Therefore, the strategy is to watch for this failure at the highs. A confirmed reversal would validate the short scenario and should lead to a decline that breaks the major ascending Trend Line. The primary target for this corrective move is 4205, which is inside the major Support zone.
That's the setup I'm tracking. Thank you for your attention, and always manage your risk.

BTCUSD Completes Correction – Heading Towards $125,000BINANCE:BTCUSD is currently trading in a well-defined ascending channel, indicating that the bullish trend continues. The price is following the channel's structure, creating higher highs and higher lows, which is a clear sign that the uptrend remains intact. The recent price correction shows a healthy pullback, which could serve as the foundation for the next upward move.
The price is now approaching an important support zone, marked by the lower boundary of the channel and a previous demand zone. If this support holds, it could present an opportunity for buyers to re-enter with strength. The expected target is $125,000 , aligning with the middle of the channel and the previous resistance level.
As long as the price remains above the support zone and the ascending trendline, the bullish scenario remains valid. However, if the price breaks below this level, it could invalidate the current setup and increase the likelihood of a deeper correction.
Always ensure you confirm your setups and trade with proper risk management.
Good luck!

USDJPY: Will Start Falling! Here is Why:
The charts are full of distraction, disturbance and are a graveyard of fear and greed which shall not cloud our judgement on the current state of affairs in the USDJPY pair price action which suggests a high likelihood of a coming move down.
Disclosure: I am part of Trade Nation's Influencer program and receive a monthly fee for using their TradingView charts in my analysis.
❤️ Please, support our work with like & comment! ❤️

GBPJPY Set To Fall! SELL!
My dear followers,
I analysed this chart on GBPJPY and concluded the following:
The market is trading on 203.21 pivot level.
Bias - Bearish
Technical Indicators: Both Super Trend & Pivot HL indicate a highly probable Bearish continuation.
Target - 202.48
About Used Indicators:
A super-trend indicator is plotted on either above or below the closing price to signal a buy or sell. The indicator changes color, based on whether or not you should be buying. If the super-trend indicator moves below the closing price, the indicator turns green, and it signals an entry point or points to buy.
Disclosure: I am part of Trade Nation's Influencer program and receive a monthly fee for using their TradingView charts in my analysis.
———————————
WISH YOU ALL LUCK

USDCHF Will Collapse! SELL!
My dear subscribers,
USDCHF looks like it will make a good move, and here are the details:
The market is trading on 0.7950 pivot level.
Bias - Bearish
My Stop Loss - 0.7959
Technical Indicators: Both Super Trend & Pivot HL indicate a highly probable Bearish continuation.
Target - 0.7934
About Used Indicators:
The average true range (ATR) plays an important role in 'Supertrend' as the indicator uses ATR to calculate its value. The ATR indicator signals the degree of price volatility.
Disclosure: I am part of Trade Nation's Influencer program and receive a monthly fee for using their TradingView charts in my analysis.
———————————
WISH YOU ALL LUCK

NZDCAD Will Move Lower! Sell!
Here is our detailed technical review for NZDCAD.
Time Frame: 9h
Current Trend: Bearish
Sentiment: Overbought (based on 7-period RSI)
Forecast: Bearish
The market is testing a major horizontal structure 0.803.
Taking into consideration the structure & trend analysis, I believe that the market will reach 0.794 level soon.
P.S
Please, note that an oversold/overbought condition can last for a long time, and therefore being oversold/overbought doesn't mean a price rally will come soon, or at all.
Like and subscribe and comment my ideas if you enjoy them!

EURJPY The Target Is DOWN! SELL!
My dear friends,
EURJPY looks like it will make a good move, and here are the details:
The market is trading on 176.42 pivot level.
Bias - Bearish
Technical Indicators: Supper Trend generates a clear short signal while Pivot Point HL is currently determining the overall Bearish trend of the market.
Goal - 175.91
About Used Indicators:
Pivot points are a great way to identify areas of support and resistance, but they work best when combined with other kinds of technical analysis
Disclosure: I am part of Trade Nation's Influencer program and receive a monthly fee for using their TradingView charts in my analysis.
———————————
WISH YOU ALL LUCK

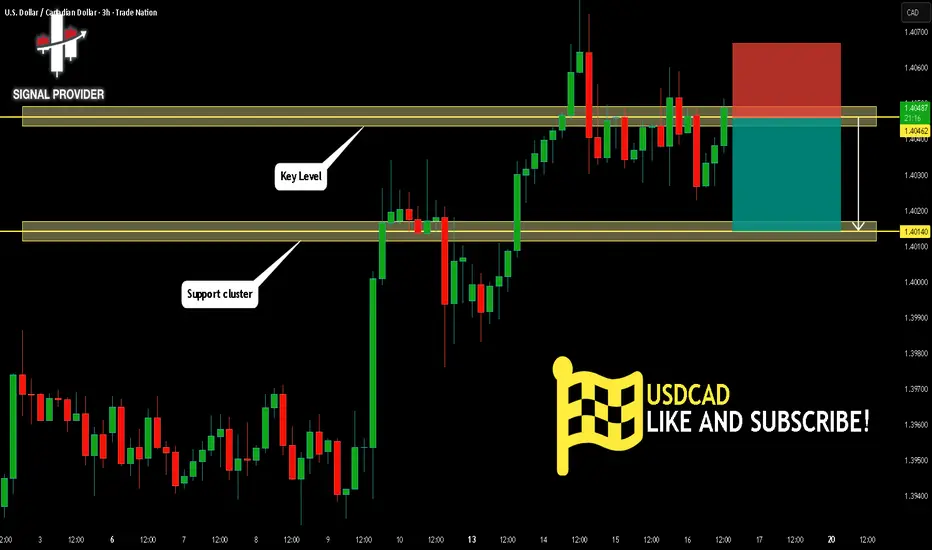
USDCAD Will Go Lower! Short!
Here is our detailed technical review for USDCAD.
Time Frame: 3h
Current Trend: Bearish
Sentiment: Overbought (based on 7-period RSI)
Forecast: Bearish
The market is on a crucial zone of supply 1.404.
The above-mentioned technicals clearly indicate the dominance of sellers on the market. I recommend shorting the instrument, aiming at 1.401 level.
P.S
Overbought describes a period of time where there has been a significant and consistent upward move in price over a period of time without much pullback.
Like and subscribe and comment my ideas if you enjoy them!
NZD/JPY SENDS CLEAR BEARISH SIGNALS|SHORT
NZD/JPY SIGNAL
Trade Direction: short
Entry Level: 86.714
Target Level: 86.288
Stop Loss: 86.998
RISK PROFILE
Risk level: medium
Suggested risk: 1%
Timeframe: 2h
Disclosure: I am part of Trade Nation's Influencer program and receive a monthly fee for using their TradingView charts in my analysis.
✅LIKE AND COMMENT MY IDEAS✅

CAD/JPY BEARS ARE GAINING STRENGTH|SHORT
Hello, Friends!
CAD/JPY pair is in the downtrend because previous week’s candle is red, while the price is obviously rising on the 4H timeframe. And after the retest of the resistance line above I believe we will see a move down towards the target below at 106.478 because the pair is overbought due to its proximity to the upper BB band and a bearish correction is likely.
Disclosure: I am part of Trade Nation's Influencer program and receive a monthly fee for using their TradingView charts in my analysis.
✅LIKE AND COMMENT MY IDEAS✅

AUD/JPY SELLERS WILL DOMINATE THE MARKET|SHORT
Hello, Friends!
AUD/JPY pair is trading in a local downtrend which know by looking at the previous 1W candle which is red. On the 1H timeframe the pair is going up. The pair is overbought because the price is close to the upper band of the BB indicator. So we are looking to sell the pair with the upper BB line acting as resistance. The next target is 97.676 area.
Disclosure: I am part of Trade Nation's Influencer program and receive a monthly fee for using their TradingView charts in my analysis.
✅LIKE AND COMMENT MY IDEAS✅

EUR/GBP - Outlook🔥 EUR/GBP – Outlook (Weekly / Daily / 8H) 🔥
Alright, traders — this one’s simmering inside a tight squeeze before the next big move! Let’s break it down 🧩
🧠 Weekly View
Price is sitting inside a weekly demand zone after rejecting the upper supply area near 0.8750 – 0.8780 (BSL zone). The structure’s still lower-high based, suggesting bearish intent if the range floor gives way.
Major resistance: 0.8750 – 0.8780
Major support: 0.8600 – 0.8630
A clear weekly close below that support = door open toward 0.8500 → 0.8350 (next weekly demand).
📅 Daily View
The daily chart shows price consolidation within weekly demand — a contracting triangle pattern right under major resistance. That’s a classic “coiled spring” setup.
Bulls need a clean breakout above 0.8700 to flip bias short-term.
Bears are eyeing a break and retest of 0.8650 → 0.8600 to confirm downside momentum.
Momentum indicators (EMA compression) hint the bears might grab control soon.
⏱ 8H View
The 8H triangle’s getting tight — every test of the descending trendline keeps rejecting. Liquidity likely builds above the highs before a potential sweep + dump toward the weekly zone.
If we sweep 0.8700 and fail to hold, look for short entries toward 0.8550 (Target 1)
If momentum accelerates, extension to 0.8350 (Target 2) could follow — that’s the deeper liquidity pocket.
⚖️ Bias & Plan
HTF supports bearish price action, although the short-term is still ranging — HTF will take control soon.
📉 Bias: Bearish-to-neutral
🎯 Targets: 0.8550 → 0.8350
📈 Invalidation: Daily close above 0.8750
🧩 Summary
Market’s compressing between key zones — expect a breakout soon.
Watch for a liquidity sweep above 0.8700, then potential drop toward 0.8500 zones.
Bears remain in charge unless price cleanly flips the daily resistance structure.
