NZDUSD The Target Is DOWN! SELL!
My dear subscribers,
This is my opinion on the NZDUSD next move:
The instrument tests an important psychological level 0.5677
Bias - Bearish
Technical Indicators: Supper Trend gives a precise Bearish signal, while Pivot Point HL predicts price changes and potential reversals in the market.
Target - 0.5640
About Used Indicators:
On the subsequent day, trading above the pivot point is thought to indicate ongoing bullish sentiment, while trading below the pivot point indicates bearish sentiment.
Disclosure: I am part of Trade Nation's Influencer program and receive a monthly fee for using their TradingView charts in my analysis.
———————————
WISH YOU ALL LUCK
Short!!!!

GOLD Buyers In Panic! SELL!
My dear friends,
Please, find my technical outlook for GOLD below:
The instrument tests an important psychological level 4150.7
Bias - Bearish
Technical Indicators: Supper Trend gives a precise Bearish signal, while Pivot Point HL predicts price changes and potential reversals in the market.
Target - 4134.3
Recommended Stop Loss - 4160.3
About Used Indicators:
Super-trend indicator is more useful in trending markets where there are clear uptrends and downtrends in price.
Disclosure: I am part of Trade Nation's Influencer program and receive a monthly fee for using their TradingView charts in my analysis.
———————————
WISH YOU ALL LUCK

FVG- Order Block- ChocH- H2 gold🔥 Why the ENTRY is at 4186
It sits inside the premium zone (between 0.618–0.786 Fibonacci), which is where smart money prefers to SELL.
There is an unmitigated H2 FVG + Supply zone exactly there.
There is liquidity above (equal highs / wick highs), so price is likely to spike into this zone first.
It aligns with a previous swing high, making it a perfect reaction area.
➡ 4186 = Premium + Supply + FVG + Liquidity = A+ short entry
🛡 Why the STOP LOSS is at 4223
4220–4225 is the final liquidity pool above the supply.
If price breaks this level, the entire bearish idea becomes invalid.
Above 4223, H2 would create a bullish BOS, killing the short idea.
➡ 4223 = structural invalidation + liquidity protection
🎯 Why the TAKE PROFIT is at 3998
3998 is the next major H2/H4 demand zone.
It is the full imbalance (iFVG) fill target.
It aligns with the next liquidity pool below.
➡ 3998 = perfect smart money target

Bitcoin Target 60K - Here's why (...you should hedge now)🔱 Bitcoin is behaving like a model student when it comes to the fork framework. 🔱
The first re-test at the white centerline, followed by a drop down to the red centerline, and then to the white lower median line parallel was already impressive. And the story isn’t over yet!
In the past days we’ve seen a re-test at the white L-MLH. Bitcoin failed to trade its way back into the fork. That leaves further price losses as the likely outcome.
The next targets are:
👉 the 1/4 level at around 76,000
👉 the white warning line at about 70K–72K
👉 the final move to the red L-MLH at around 60K
This decline would go hand in hand with continued sell-offs in the major indices like the Nasdaq and S&P 500. It would also support my previous post regarding a massive rise in TLT.
(props to @coinwide for the heads-up!)
🚨 A hedge would be appropriate now, before the VIX ignites its rocket and option prices explode.
Wish you all the best out there!

GOLD BEARS ARE STRONG HERE|SHORT
GOLD SIGNAL
Trade Direction: short
Entry Level: 4,167.31
Target Level: 3,975.91
Stop Loss: 4,294.65
RISK PROFILE
Risk level: medium
Suggested risk: 1%
Timeframe: 12h
Disclosure: I am part of Trade Nation's Influencer program and receive a monthly fee for using their TradingView charts in my analysis.
✅LIKE AND COMMENT MY IDEAS✅

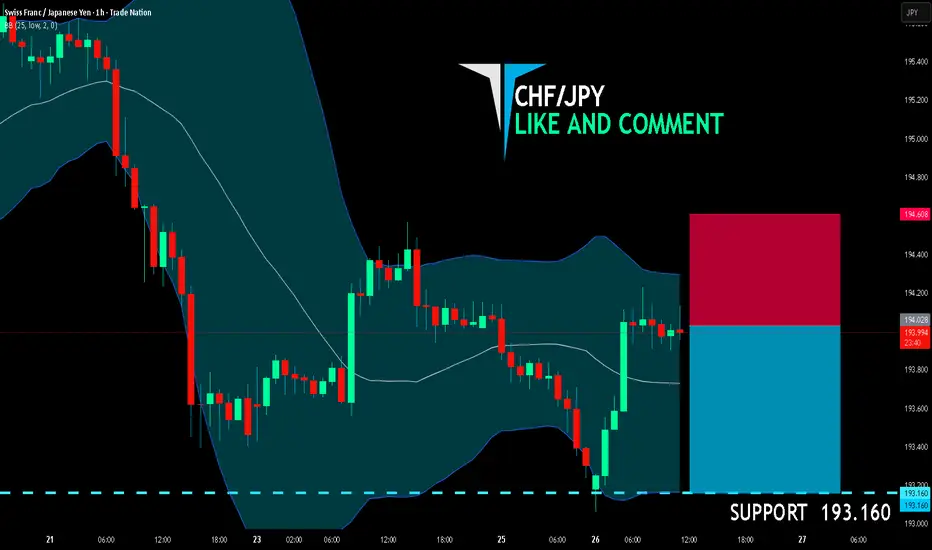
CHF/JPY SHORT FROM RESISTANCE
CHF/JPY SIGNAL
Trade Direction: short
Entry Level: 194.028
Target Level: 193.160
Stop Loss: 194.608
RISK PROFILE
Risk level: medium
Suggested risk: 1%
Timeframe: 1h
Disclosure: I am part of Trade Nation's Influencer program and receive a monthly fee for using their TradingView charts in my analysis.
✅LIKE AND COMMENT MY IDEAS✅
NZD/JPY BEARS WILL DOMINATE THE MARKET|SHORT
Hello, Friends!
We are now examining the NZD/JPY pair and we can see that the pair is going up locally while also being in a uptrend on the 1W TF. But there is also a powerful signal from the BB upper band being nearby, indicating that the pair is overbought so we can go short from the resistance line above and a target at 88.001 level.
Disclosure: I am part of Trade Nation's Influencer program and receive a monthly fee for using their TradingView charts in my analysis.
✅LIKE AND COMMENT MY IDEAS✅

CAD/JPY SENDS CLEAR BEARISH SIGNALS|SHORT
Hello, Friends!
The BB upper band is nearby so CAD-JPY is in the overbought territory. Thus, despite the uptrend on the 1W timeframe I think that we will see a bearish reaction from the resistance line above and a move down towards the target at around 109.581.
Disclosure: I am part of Trade Nation's Influencer program and receive a monthly fee for using their TradingView charts in my analysis.
✅LIKE AND COMMENT MY IDEAS✅

RESOLV UPDATE #2 and TARGET 2 BOOOOOOOM Hello friends 😍
I hope you are well 👌😊
💁♂️ First of all, thank you for clicking the "boost button" to give me a thumbs up. ❤️
💁♂️ Let's go for a new update on the RESOLV - USDT cryptocurrency
💁♂️ The second target was also touched and we were able to take advantage of a very good drop
Up to this moment, the RESOLV cryptocurrency has also rejected the second target with a 60% drop 🔥
🤔 Did you use this analysis?
😊 Share your comments with me
⚠️The analysis may not reach the final target, so at each target, if you make a good profit and see signs of a trend change, you can exit the trade or manage your capital.
⚠️ None of the analysis is a recommendation to buy or sell, but simply my personal opinions on the charts. You can use the charts and choose any that interest you and take a position if you wish.
To support me, I would appreciate it if you boost the analysis and share it with your friends so that I can analyze it with more energy for you, my dears. Thank you all. 💖

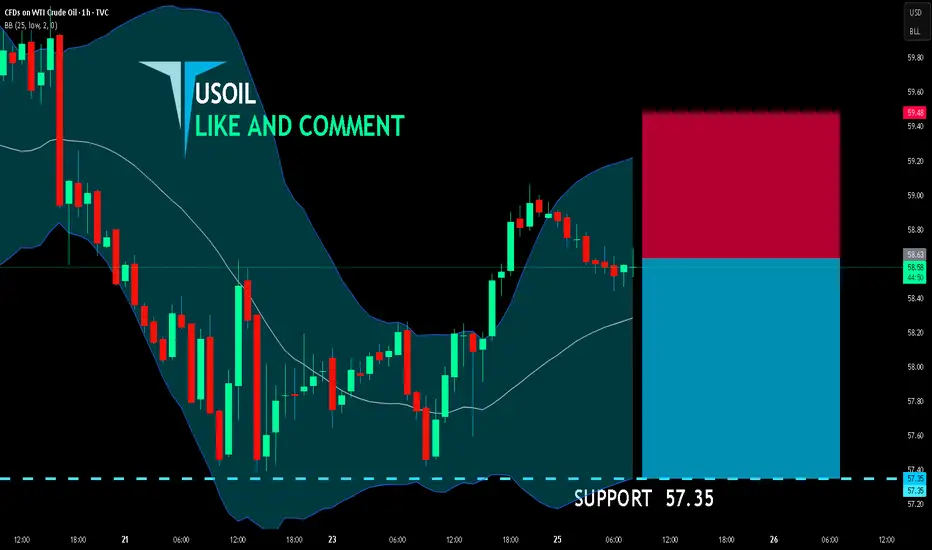
USOIL BEARS ARE GAINING STRENGTH|SHORT
USOIL SIGNAL
Trade Direction: short
Entry Level: 58.63
Target Level: 57.35
Stop Loss: 59.48
RISK PROFILE
Risk level: medium
Suggested risk: 1%
Timeframe: 1h
Disclosure: I am part of Trade Nation's Influencer program and receive a monthly fee for using their TradingView charts in my analysis.
✅LIKE AND COMMENT MY IDEAS✅
GBPUSD Will Go Lower From Resistance! Sell!
Take a look at our analysis for GBPUSD.
Time Frame: 6h
Current Trend: Bearish
Sentiment: Overbought (based on 7-period RSI)
Forecast: Bearish
The market is approaching a key horizontal level 1.316.
Considering the today's price action, probabilities will be high to see a movement to 1.309.
P.S
The term oversold refers to a condition where an asset has traded lower in price and has the potential for a price bounce.
Overbought refers to market scenarios where the instrument is traded considerably higher than its fair value. Overvaluation is caused by market sentiments when there is positive news.
Like and subscribe and comment my ideas if you enjoy them!

EURCAD Will Go Lower! Short!
Please, check our technical outlook for EURCAD.
Time Frame: 1D
Current Trend: Bearish
Sentiment: Overbought (based on 7-period RSI)
Forecast: Bearish
The market is approaching a significant resistance area 1.630.
Due to the fact that we see a positive bearish reaction from the underlined area, I strongly believe that sellers will manage to push the price all the way down to 1.619 level.
P.S
We determine oversold/overbought condition with RSI indicator.
When it drops below 30 - the market is considered to be oversold.
When it bounces above 70 - the market is considered to be overbought.
Like and subscribe and comment my ideas if you enjoy them!

EURCHF Will Go Down! Sell!
Here is our detailed technical review for EURCHF.
Time Frame: 1h
Current Trend: Bearish
Sentiment: Overbought (based on 7-period RSI)
Forecast: Bearish
The market is on a crucial zone of supply 0.933.
The above-mentioned technicals clearly indicate the dominance of sellers on the market. I recommend shorting the instrument, aiming at 0.930 level.
P.S
Overbought describes a period of time where there has been a significant and consistent upward move in price over a period of time without much pullback.
Like and subscribe and comment my ideas if you enjoy them!

EURCAD: Bearish Forecast & Bearish Scenario
It is essential that we apply multitimeframe technical analysis and there is no better example of why that is the case than the current EURCAD chart which, if analyzed properly, clearly points in the downward direction.
Disclosure: I am part of Trade Nation's Influencer program and receive a monthly fee for using their TradingView charts in my analysis.
❤️ Please, support our work with like & comment! ❤️

EURAUD: Short Trade Explained
EURAUD
- Classic bearish setup
- Our team expects bearish continuation
SUGGESTED TRADE:
Swing Trade
Short EURAUD
Entry Point - 1.7915
Stop Loss - 1.7940
Take Profit - 1.7869
Our Risk - 1%
Start protection of your profits from lower levels
Disclosure: I am part of Trade Nation's Influencer program and receive a monthly fee for using their TradingView charts in my analysis.
❤️ Please, support our work with like & comment! ❤️

SPX500 Short
Deep crab pattern completes on M15, mapping a potential reversal zone.
Multiple tops formed on M15 and M30 at the same area, reinforcing overhead supply from the prior day’s high that price could not break.
RSI reached overbought on M15 and M30, indicating crowded long positioning.
Approximately 20 points of RSI bearish divergence across M15 and M30, consistent with a weakening advance.
H4 has turned down after last week’s rebound and now aligns with a downside continuation view.
Daily slope is flattening and price is trading beneath it, suggesting the early stages of a broader reversal can develop if sellers follow through.
Bias is short of the reversal zone identified by the deep crab and repeated tops.
Stop loss set at 50 pips to cap risk if resistance fails.
First target at 6,600, which is 100 pips from entry, with room to manage partials at nearby structure if momentum confirms.
Several US indices and other global indices are printing similar topping behavior and momentum fades, adding intermarket confluence to the short idea.

GBPUSD Massive Short! SELL!
My dear friends,
Please, find my technical outlook for GBPUSD below:
The price is coiling around a solid key level - 1.3156
Bias - Bearish
Technical Indicators: Pivot Points High anticipates a potential price reversal.
Super trend shows a clear sell, giving a perfect indicators' convergence.
Goal - 1.3121
About Used Indicators:
The pivot point itself is simply the average of the high, low and closing prices from the previous trading day.
Disclosure: I am part of Trade Nation's Influencer program and receive a monthly fee for using their TradingView charts in my analysis.
———————————
WISH YOU ALL LUCK

EURUSD Under Pressure! SELL!
My dear subscribers,
My technical analysis for EURUSD is below:
The price is coiling around a solid key level - 1.1563
Bias - Bearish
Technical Indicators: Pivot Points Low anticipates a potential price reversal.
Super trend shows a clear sell, giving a perfect indicators' convergence.
Goal - 1.1547
My Stop Loss - 1.1572
About Used Indicators:
By the very nature of the supertrend indicator, it offers firm support and resistance levels for traders to enter and exit trades. Additionally, it also provides signals for setting stop losses
Disclosure: I am part of Trade Nation's Influencer program and receive a monthly fee for using their TradingView charts in my analysis.
———————————
WISH YOU ALL LUCK

GOLD: Bearish Continuation & Short Trade
GOLD
- Classic bearish formation
- Our team expects fall
SUGGESTED TRADE:
Swing Trade
Sell GOLD
Entry Level - 4130.2
Sl - 4144.7
Tp - 4106.1
Our Risk - 1%
Start protection of your profits from lower levels
Disclosure: I am part of Trade Nation's Influencer program and receive a monthly fee for using their TradingView charts in my analysis.
❤️ Please, support our work with like & comment! ❤️

GOLD Will Move Lower! Short!
Take a look at our analysis for GOLD.
Time Frame: 9h
Current Trend: Bearish
Sentiment: Overbought (based on 7-period RSI)
Forecast: Bearish
The price is testing a key resistance 4,126.79.
Taking into consideration the current market trend & overbought RSI, chances will be high to see a bearish movement to the downside at least to 4,038.14 level.
P.S
Please, note that an oversold/overbought condition can last for a long time, and therefore being oversold/overbought doesn't mean a price rally will come soon, or at all.
Like and subscribe and comment my ideas if you enjoy them!

AUDUSD Is Very Bearish! Sell!
Here is our detailed technical review for AUDUSD.
Time Frame: 4h
Current Trend: Bearish
Sentiment: Overbought (based on 7-period RSI)
Forecast: Bearish
The market is testing a major horizontal structure 0.645.
Taking into consideration the structure & trend analysis, I believe that the market will reach 0.641 level soon.
P.S
We determine oversold/overbought condition with RSI indicator.
When it drops below 30 - the market is considered to be oversold.
When it bounces above 70 - the market is considered to be overbought.
Like and subscribe and comment my ideas if you enjoy them!

GBPAUD Is Going Down! Short!
Take a look at our analysis for GBPAUD.
Time Frame: 6h
Current Trend: Bearish
Sentiment: Overbought (based on 7-period RSI)
Forecast: Bearish
The market is approaching a key horizontal level 2.033.
Considering the today's price action, probabilities will be high to see a movement to 2.022.
P.S
Overbought describes a period of time where there has been a significant and consistent upward move in price over a period of time without much pullback.
Like and subscribe and comment my ideas if you enjoy them!

USOIL Is Very Bearish! Sell!
Please, check our technical outlook for USOIL.
Time Frame: 15m
Current Trend: Bearish
Sentiment: Overbought (based on 7-period RSI)
Forecast: Bearish
The market is approaching a significant resistance area 57.983.
Due to the fact that we see a positive bearish reaction from the underlined area, I strongly believe that sellers will manage to push the price all the way down to 57.471 level.
P.S
We determine oversold/overbought condition with RSI indicator.
When it drops below 30 - the market is considered to be oversold.
When it bounces above 70 - the market is considered to be overbought.
Like and subscribe and comment my ideas if you enjoy them!
