AUD/JPY SELLERS WILL DOMINATE THE MARKET|SHORT
AUD/JPY SIGNAL
Trade Direction: short
Entry Level: 101.104
Target Level: 98.334
Stop Loss: 102.941
RISK PROFILE
Risk level: medium
Suggested risk: 1%
Timeframe: 1D
Disclosure: I am part of Trade Nation's Influencer program and receive a monthly fee for using their TradingView charts in my analysis.
✅LIKE AND COMMENT MY IDEAS✅
Short!!!!

GBP/JPY BEARISH BIAS RIGHT NOW| SHORT
Hello, Friends!
Previous week’s green candle means that for us the GBP/JPY pair is in the uptrend. And the current movement leg was also up but the resistance line will be hit soon and upper BB band proximity will signal an overbought condition so we will go for a counter-trend short trade with the target being at 203.382.
Disclosure: I am part of Trade Nation's Influencer program and receive a monthly fee for using their TradingView charts in my analysis.
✅LIKE AND COMMENT MY IDEAS✅

GBP/AUD BEST PLACE TO SELL FROM|SHORT
Hello, Friends!
GBP-AUD uptrend evident from the last 1W green candle makes short trades more risky, but the current set-up targeting 2.017 area still presents a good opportunity for us to sell the pair because the resistance line is nearby and the BB upper band is close which indicates the overbought state of the GBP/AUD pair.
Disclosure: I am part of Trade Nation's Influencer program and receive a monthly fee for using their TradingView charts in my analysis.
✅LIKE AND COMMENT MY IDEAS✅

SELL GOLDIn todays session we have noted apotential selling scenario on GOLD. Our shorts are at 4140 and stops above 4055, targets 4044. Use proper risk management.

Bitcoin Market Truth: Whales, Corrections, and the BraveHello my friends,
I have carefully analyzed Bitcoin for you.
Markets never move straight up; they progress with corrections. Whales often take profit along the way. Think of it like running a supermarket: you buy apples at the cheapest price so that when customers purchase from you, you make a profit. Whales use the same logic. They trick people into thinking prices are falling, but in reality, their goal is to balance supply and demand. They feed on the losses of others.
For me, the most suitable buying zone is between 85,000 and 74,000 dollars. From this range I will enter the trade, with my first target at 107,000 and my second target at 120,000 dollars.
This business belongs to the fearless and the brave. If you act out of fear of losing money, this is not for you. Those who cannot manage risk should look for other paths.
My dear friends, every single like you give is my greatest motivation to continue sharing these analyses. Thank you to all who support me—you are the reason I keep going.
Each of my followers is like family to me, never forget that.
⚠️ And remember this: In trading, don’t trust everyone who calls themselves a “trader.” Most of the people you follow don’t earn a cent in their real accounts. This is not an easy business. Around 90% of people lose consistently, while only about 10% make money regularly. Many YouTubers or influencers you see online don’t actually profit with their real money. In fact, some of the celebrities you follow come to me asking for analysis. I won’t expose names, but these are the facts.
Respect and love

Bitcoin Price Approaches Key Support: Rebound Toward 98,700?BITSTAMP:BTCUSD is approaching a key support zone, an area where buyers have repeatedly stepped in before and triggered notable reversals. That price history alone makes this level worth watching very closely. Price is pressing into this zone again, and the current structure suggests bullish potential if we see clear signs of rejection, such as a strong bullish engulfing candle, long lower wicks that show absorption of selling, or a visible increase in buying volume.
If this support holds, I expect price to push up toward the 98,700 area, which fits well with a short-term rebound scenario. If, on the other hand, price breaks below this zone and starts to hold underneath it, the bullish idea is invalidated and the door opens for a deeper downside move.
In my view, the best approach here is to let the chart confirm the story at this level. Watch how candles close, how volume reacts, and only consider long setups if the market clearly defends this zone. Solid risk management is essential: position size, stop loss placement and invalidation levels all need to respect the potential volatility around such an important area.
This is simply my personal view on the current support and resistance structure, not financial advice. Always confirm your own setup and trade with disciplined risk management. Good luck out there.

BitcizzoinHere's a random chart for you to gander at. Based on my ability to time travel, it's the perfect setup. DYOR EL o EL

There is a chance BTC can return the 80K zone - Data should confEven with the increase from 80K zone to up 86.7K, BTC is able to return from this zone into the breakdown trend, where this will go exactly the coming time frames, which should be confirmed with time. We need to confirm this, the data change, and the last data shows a bitcoin that can get a correction again.

EURCHF: Weak Market & Bearish Continuation
The analysis of the EURCHF chart clearly shows us that the pair is finally about to tank due to the rising pressure from the sellers.
Disclosure: I am part of Trade Nation's Influencer program and receive a monthly fee for using their TradingView charts in my analysis.
❤️ Please, support our work with like & comment! ❤️

EURGBP: Short Signal with Entry/SL/TP
EURGBP
- Classic bearish formation
- Our team expects pullback
SUGGESTED TRADE:
Swing Trade
Short EURGBP
Entry - 0.8800
Sl - 0.8805
Tp - 0.8791
Our Risk - 1%
Start protection of your profits from lower levels
Disclosure: I am part of Trade Nation's Influencer program and receive a monthly fee for using their TradingView charts in my analysis.
❤️ Please, support our work with like & comment! ❤️

24/11/25 Weekly OutlookLast weeks high: $96,057.33
Last weeks low: $93,034.53
Midpoint: $80,642.73
Has Bitcoin found its low, or is there more downside to come?
After yet another brutal week of downtrend BTC tags $80,000 before bouncing back towards the weekly range midpoint at $88,000, a +10% bounce. It's important to note that back in April during the Tariff War sell-off, the $80,000 area was the origin of the subsequent move up to $110,000. So historically this area should provide support when retested as it has initially.
What this does mean to me, the high time frame trend has shifted from bullish with areas of choppy rangebound consolidation before the next leg up, to now a new lower high ($108,000 rejection) which confirmed the 1d 200 EMA as resistance, and much lower low ($80,000 last weeks low) which confirms a bearish flip.
For me this week it's about finding out if the bottom is already in or if not, where will it be? In terms of bullish target should the bottom already be in, it's the $98,000-$100,000 area. This key s/r level has been an important battleground since December '24, it's a big even level too so psychologically important, and the origin of this 20% sell-off. Fear & Greed Index currently sits at 19 but hit as low as 11 over the weekend, the lowest so far this bull run. These factors have me leaning towards the local bottom is in.
However, if the bottom is not in then $74,000 comes into play, the Tariff war low. That would complete a full retrace of this years move up to $126,000 (-40% from high). The current weekly low sits at -36% move which is the largest of the bull run so far but not uncommon in previous cycles.
Good luck this week everybody!

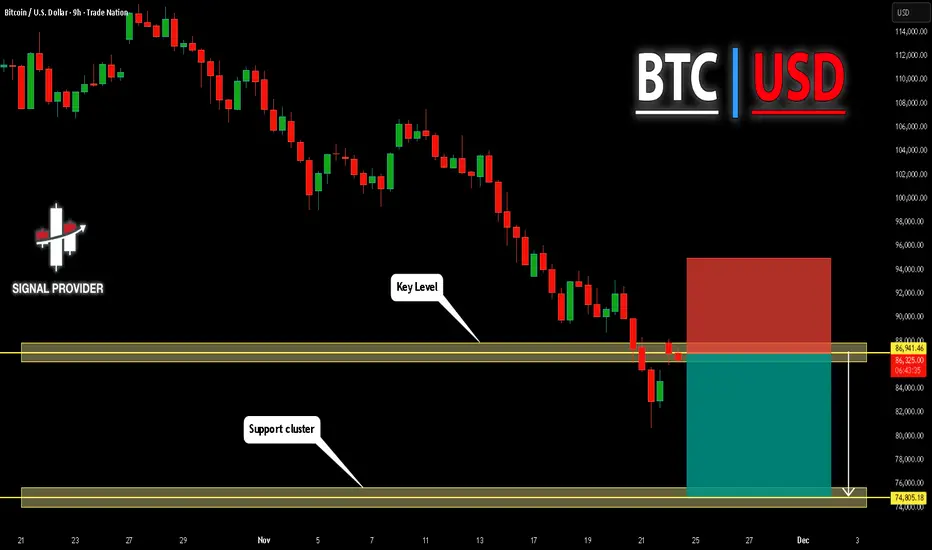
BITCOIN Will Fall! Sell!
Please, check our technical outlook for BITCOIN.
Time Frame: 9h
Current Trend: Bearish
Sentiment: Overbought (based on 7-period RSI)
Forecast: Bearish
The market is approaching a significant resistance area 86,941.46.
Due to the fact that we see a positive bearish reaction from the underlined area, I strongly believe that sellers will manage to push the price all the way down to 74,805.18 level.
P.S
Please, note that an oversold/overbought condition can last for a long time, and therefore being oversold/overbought doesn't mean a price rally will come soon, or at all.
Like and subscribe and comment my ideas if you enjoy them!
USDJPY Will Go Down From Resistance! Short!
Here is our detailed technical review for USDJPY.
Time Frame: 6h
Current Trend: Bearish
Sentiment: Overbought (based on 7-period RSI)
Forecast: Bearish
The market is on a crucial zone of supply 156.909.
The above-mentioned technicals clearly indicate the dominance of sellers on the market. I recommend shorting the instrument, aiming at 155.044 level.
P.S
The term oversold refers to a condition where an asset has traded lower in price and has the potential for a price bounce.
Overbought refers to market scenarios where the instrument is traded considerably higher than its fair value. Overvaluation is caused by market sentiments when there is positive news.
Like and subscribe and comment my ideas if you enjoy them!

GBPCAD: Bearish Forecast & Outlook
Looking at the chart of GBPCAD right now we are seeing some interesting price action on the lower timeframes. Thus a local move down seems to be quite likely.
Disclosure: I am part of Trade Nation's Influencer program and receive a monthly fee for using their TradingView charts in my analysis.
❤️ Please, support our work with like & comment! ❤️

EURAUD Will Go Lower! Sell!
Take a look at our analysis for EURAUD.
Time Frame: 4h
Current Trend: Bearish
Sentiment: Overbought (based on 7-period RSI)
Forecast: Bearish
The price is testing a key resistance 1.785.
Taking into consideration the current market trend & overbought RSI, chances will be high to see a bearish movement to the downside at least to 1.777 level.
P.S
We determine oversold/overbought condition with RSI indicator.
When it drops below 30 - the market is considered to be oversold.
When it bounces above 70 - the market is considered to be overbought.
Like and subscribe and comment my ideas if you enjoy them!

EURUSD: Short Signal Explained
EURUSD
- Classic bearish pattern
- Our team expects retracement
SUGGESTED TRADE:
Swing Trade
Sell EURUSD
Entry - 1.1530
Stop - 1.1537
Take - 1.1520
Our Risk - 1%
Start protection of your profits from lower levels
Disclosure: I am part of Trade Nation's Influencer program and receive a monthly fee for using their TradingView charts in my analysis.
❤️ Please, support our work with like & comment! ❤️

EURCAD Trading Opportunity! SELL!
My dear followers,
This is my opinion on the EURCAD next move:
The asset is approaching an important pivot point 1.6259
Bias - Bearish
Technical Indicators: Supper Trend generates a clear short signal while Pivot Point HL is currently determining the overall Bearish trend of the market.
Goal - 1.6220
About Used Indicators:
For more efficient signals, super-trend is used in combination with other indicators like Pivot Points.
Disclosure: I am part of Trade Nation's Influencer program and receive a monthly fee for using their TradingView charts in my analysis.
———————————
WISH YOU ALL LUCK

GBPAUD The Target Is DOWN! SELL!
My dear subscribers,
This is my opinion on the GBPAUD next move:
The instrument tests an important psychological level 2.0297
Bias - Bearish
Technical Indicators: Supper Trend gives a precise Bearish signal, while Pivot Point HL predicts price changes and potential reversals in the market.
Target - 2.0205
About Used Indicators:
On the subsequent day, trading above the pivot point is thought to indicate ongoing bullish sentiment, while trading below the pivot point indicates bearish sentiment.
Disclosure: I am part of Trade Nation's Influencer program and receive a monthly fee for using their TradingView charts in my analysis.
———————————
WISH YOU ALL LUCK

NATGAS Set To Fall! SELL!
My dear followers,
I analysed this chart on NATGAS and concluded the following:
The market is trading on 4.577pivot level.
Bias - Bearish
Technical Indicators: Both Super Trend & Pivot HL indicate a highly probable Bearish continuation.
Target - 4.474
About Used Indicators:
A super-trend indicator is plotted on either above or below the closing price to signal a buy or sell. The indicator changes color, based on whether or not you should be buying. If the super-trend indicator moves below the closing price, the indicator turns green, and it signals an entry point or points to buy.
Disclosure: I am part of Trade Nation's Influencer program and receive a monthly fee for using their TradingView charts in my analysis.
———————————
WISH YOU ALL LUCK

SILVER BEARS ARE STRONG HERE|SHORT
SILVER SIGNAL
Trade Direction: short
Entry Level: 4,992.1
Target Level: 4,536.3
Stop Loss: 5,296.0
RISK PROFILE
Risk level: medium
Suggested risk: 1%
Timeframe: 1D
Disclosure: I am part of Trade Nation's Influencer program and receive a monthly fee for using their TradingView charts in my analysis.
✅LIKE AND COMMENT MY IDEAS✅

GBP/CHF SHORT FROM RESISTANCE
GBP/CHF SIGNAL
Trade Direction: short
Entry Level: 1.059
Target Level: 1.049
Stop Loss: 1.066
RISK PROFILE
Risk level: medium
Suggested risk: 1%
Timeframe: 6h
Disclosure: I am part of Trade Nation's Influencer program and receive a monthly fee for using their TradingView charts in my analysis.
✅LIKE AND COMMENT MY IDEAS✅

EUR/CHF BEARS WILL DOMINATE THE MARKET|SHORT
Hello, Friends!
EUR/CHF pair is in the uptrend because previous week’s candle is green, while the price is evidently rising on the 1D timeframe. And after the retest of the resistance line above I believe we will see a move down towards the target below at 0.925 because the pair overbought due to its proximity to the upper BB band and a bearish correction is likely.
Disclosure: I am part of Trade Nation's Influencer program and receive a monthly fee for using their TradingView charts in my analysis.
✅LIKE AND COMMENT MY IDEAS✅

NATGAS: Expecting Bearish Continuation! Here is Why:
Remember that we can not, and should not impose our will on the market but rather listen to its whims and make profit by following it. And thus shall be done today on the NATGAS pair which is likely to be pushed down by the bears so we will sell!
Disclosure: I am part of Trade Nation's Influencer program and receive a monthly fee for using their TradingView charts in my analysis.
❤️ Please, support our work with like & comment! ❤️
