DAX 3-Drives Pattern - Monster Short SignalOK, I admit, it’s very early to call this a three-drives pattern.
But as a trader, I always think, “What if?”
This is my way of preparing early in the process. It allows me to make educated decisions, rather than FOMO trades.
What I am waiting for now is a break of the yellow CIB line. Typically, after such a break, price pulls back to retest it. This behavior is similar to what we see when the median line of a fork is broken.
If this setup triggers, it would clearly be a long-term play. Or it could be over vevry quick via a very sharp, violent move to the south.
Let’s watch it and prepare for this thesis.
Short-setup

BTC is at the stage of overheating.We have reached the upper limit of our monthly sideways movement and removed liquidity from above. Now, we need to remove liquidity from below.
We will either leave from the current level or from the $92,300 level.
Use your RM. Good luck with your trading, everyone! Let's see how Monday opens.
BINANCE:BTCUSDT.P

Si1! - A "Short" Silver Heads-UpWhat we see on these two charts are two different Andrews Pitchforks.
- same time window
- different time period
- different pitchfork placement
The left chart maps the pendulum swings.
The right chart maps the real swings.
LEFT CHART
The market has almost reached the maximum stretch point, arriving at the U-MLH. A reversal toward the centerline is very likely, as the market tends to seek balance after such an extreme stretch. Classic mean reversion.
RIGHT CHART
Here we see that silver has reached the centerline - the classic 80% target for a pitchfork trader. From here, the market can break/zoom through the centerline, retest it, and continue upward. In the LEFT chart, this would correspond to a larger stretch toward Warning Line 1. Or the market may turn at the centerline because it has found its balance, which in the LEFT chart would confirm the stretch-and-turn scenario.
Either way, caution is warranted. I would at least take partial profits (50% is always good) and treat myself to an enjoyable Christmas party!
Anyone who would like to learn more about pitchforks, please read my bio here on TradingView.
Happy profits to you Silver Arrows §8-)

CVNA after the rebalancing - still stalking a shortIsn’t it remarkable how effectively Andrews Pitchforks perform?
After CVNA was rebalanced following its addition to the S&P 500, price moved directly to the centerline. From here, I’m watching for a short setup.
I’m even more encouraged, as this creates additional opportunity and $'s in profit. §8-)

XHB – A continuing long-term short with further downside potentiIn my analysis it is unquestionable that the housing market is weakening further, and a significant mid-term decline is inevitable.
My godchild is currently spending a few months in the United States, preparing for an English degree. What she tells me about the housing situation and grocery prices is even more alarming than I expected.
I have already taken some short positions during the decline since September and closed part of them. Now I see further downside potential, so I have added long-dated put options, some in-the-money for longer setups and some out-of-the-money for shorter-term moves.
On the chart, we can see that price has breached the CIB line (yellow) and continued downward. At the U-MLH, we are again seeing signs of weakness - a favorable setup for action.
By the time my godchild returns from the U.S. in May 2026, I’m confident I will be able to treat her to steak and lobster, courtesy of this trade.
If not, well - my Carbonara Speciale is also a fine way to soothe the sting of a stop-loss.
Take care out there.

BTC (MBT) on the way ot 86'000Price reacted very well at the white and red fork lines (see arrows).
We have left the white centerline, and now price is hovering around the red one. If we get an open and close below it, we’ll have a new target: the WL1 of the white fork, which unsurprisingly, lines up with the red L-MLH.
Rough times ahead...

S&P500/ES Intraday Trade Idea VideoThoday I see a potential trade setting up in the S&P500 Futures.
My overall thesis is to the upside, so no Shorts today. Unless we come up to the first resistance level, or even beter, the 1/4 line. From there I'll be willing to risk some of my money.
Long option 2:
From the CIB or Centerline, after a pullback to these lower levels.
Happy Monday all §8-)

MSTR - How to profit from a $140 short target🔱 The MS ponzi is taking its toll. 🔱
I’m not laughing, because it’s genuinely unfortunate for everyone who believed in this scam.
But today, I don’t want to rant about that.
I want to show how one could profit from a potential drop of more than $100.
As an Andrews Pitchfork trader, I know there’s roughly an 80% chance that price will reach the centerline. From there, price either reverses in the opposite direction or breaks through the centerline to continue its journey.
That’s exactly what happened with MSTR.
You can see how the price first reached the centerline, held there a few times, and then broke it. Since then, it’s been following the rulebook by moving further to the downside.
Now, there’s another rule worth remembering:
price often tests or retests the line it just broke.
In our case, that line is the centerline.
This means we could be lucky enough to get a pullback to the centerline, and that would be a good level to consider shorting.
The target is usually the opposite line of the centerline, which in our case is the L-MLH (Lower Median Line Parallel).
👉 If you want to learn the full framework and its rules, check the links for free material.
I hope this helps many of you, and I wish you all good profits.

KRBN - Clear resistance for a potential short🔱 The multiple struggle at the Centerline gives us a hint for a potential short. 🔱
The thin slanted support needs to be broken and only then can we consider a move to the downside.
The L-MLH is my first PTG and the red Centerline my second.
Wish you all a happy new week and don't forget to watch my 👉 Weekly Trading Watchlist.

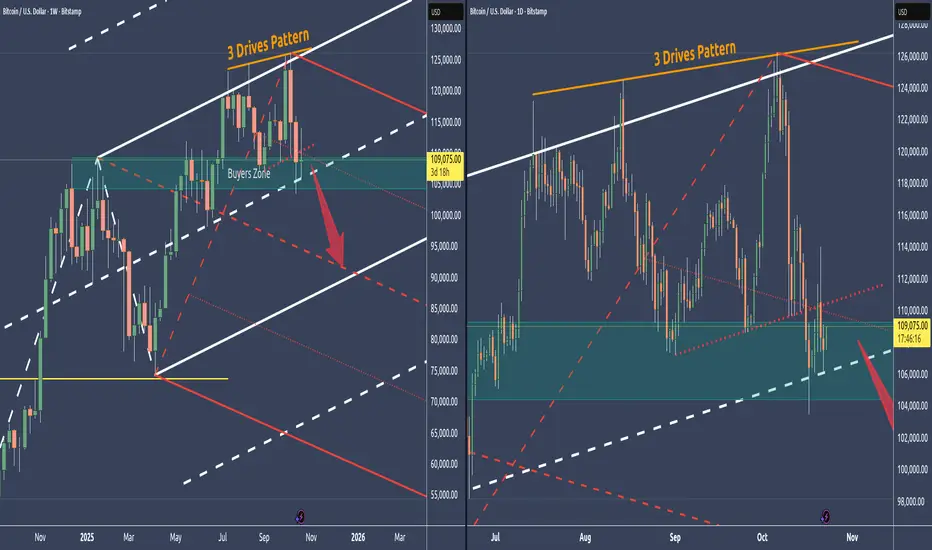
Bitcoin - We've reached the last line of support🔱 The Buyers’ Zone represents the last major support before price potentially drops toward the red centerline. 🔱
👉 The 3-Drives pattern, signaling exhaustion in the current move.
👉 Broader markets are highly stretched; a broader trend reversal would likely pull Bitcoin down with it.
👉 The slanted support line in the dayli chart is now resistance that could not be washed away.
Given these conditions, there’s a strong possibility that this final support zone won’t hold, leading to a deeper flush.
For targets I see the red Centerline, and even the L-MLH, which gives us a natural support.
Stay sharp and trade safe—wishing you a profitable week ahead
ARKK — A “Short” Ranting🔱 ARKK isn’t a revolution - it’s a high-fee, high-drama lottery ticket dressed in a lab coat. 🔱
🏦 Here's my take on the Fundamentals 🏦
⚠️ Overpriced Dreams:
You’re paying luxury prices for companies that don’t make money—most can’t even spell “free cash flow.”
⚠️ Interest-Rate Kryptonite:
When rates rise, ARKK melts. Its “future profits” vanish faster than smoke in a wind tunnel.
⚠️Liquidity Trap:
It owns too much of too little; one wave of redemptions and it’s forced to dump stocks into a falling market.
⚠️ Weak Alpha, Big Fee:
For all the hype, it lags a plain NASDAQ ETF - you’re paying 0.75% to underperform.
⚠️ Factor Suicide:
It’s built from the worst statistical factors. Expensive, volatile, unprofitable stocks that hate inflation.
⚠️ Concentration Bomb:
Half the fund sits in a handful of “disruptors.” If one blows up, the whole thing shakes.
⚠️ Dumb Money Flow:
Retail investors chase this thing at highs and bail at lows. Every short seller’s dream.
⚠️ Copycats and Fee Drag:
Competitors now clone the “innovation” pitch cheaper and better, while ARKK drags its old fee chain.
📈 And finally, here's the Chart Analysis
This flying Pig is ready to be Barbequed.
It missed the pump up to the Warning Line and fell back into the Fork. Today it opened inside, and if nothing superstitious happens, it’ll close inside too.
So, I’m short - period.
As always, my first target is the Centerline.
Have a great weekend, everyone and grab some gas for the BBQ.

METAs Short Target At $630🔱 The Cracks Are Showing 🔱
🏦 Let’s talk fundamentals.
The biggest storm cloud hanging over META right now? Regulation — in both the EU and the U.S. If fines or compliance costs ramp up, profits get squeezed and strategy shifts become inevitable.
👉 Competition is biting too. New apps are stealing attention, and every second users spend elsewhere chips away at Meta’s moat.
⚠️ Then there’s the AI spending spree. Billions are burning to build infrastructure, but if those bets don’t pay off fast, margins will bleed.
Add growing media pressure — from content moderation to child safety — and you’ve got a brand walking through a minefield of reputational risk.
📈 Now, look at the chart.
The price has fallen below the Centerline. That’s not noise — that’s a message. It’s a classic short signal.
Before the drop, we saw price action stall again and again at the upper quarter line. That’s not random congestion. That’s distribution — the big whales quietly unloading while everyone else was still bullish.
Then came the pullback to the Centerline. followed by a weak close. Translation: buyers are drying up.
💰 Target? $630 at the L-MLH. With smart position sizing, this could be a sweet Christmas trade.

SI1! - Dancing on the SILVER Tracks🔱 I like risk. Specially when it's skewed to my favor 🔱
WL1 has been reached, and the market is wildly overextended.
Is it crazy to stand in front of this speeding train?
Absolutely — if you don’t know when to jump.
I’ve done my warm-up, and I’m ready to leap off the rails the moment it gets too close, too fast.
My move is with options — that means my risk is defined, my escape route mapped.
I would never short the underlying — not in a million years.
Now let’s see if this setup earns me that Steak & Lobster target.

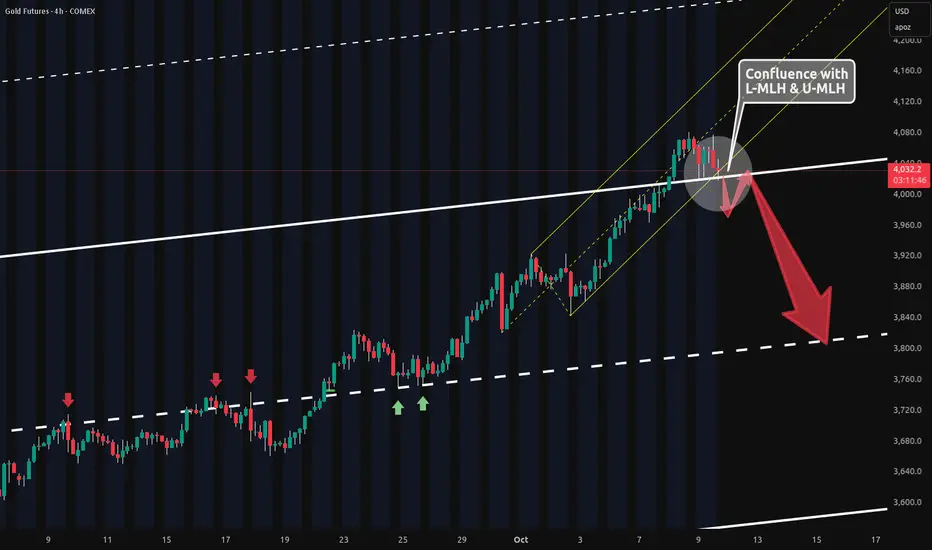
Gold 4h Potential Short Confluence🔱 Just wanted to highlight this confluence 🔱
The yellow L-MLH and white U-MLH are lining up to form a potential short setup.
Today’s selling pressure is also giving an early warning signal.
If we open and close below the white U-MLH, we’ll likely retest it before any major drop.
Shorting this move will require a decent stop, given the inherent volatility. So maybe a play with an Options Strategy would be a more secure way.
Let’s see if the party finally takes a breather.
Bitcoin Hodlers are happy campers - BUT🕷️ 🌕 🦇 In Switzerland it’s now 11:50 PM 🕷️ 🌕 🦇
I’m tired from a long day in the markets, but I feel I have to get this one out because it’s important for many of you holding Bitcoin.
In my last post, I said we’d run upward to reach the Hagopian Line, and here we are, even higher.
We’ve just tagged the U-MLH for the third time.
There’s an old pattern from the futures markets that farmers once noticed. It’s called the “Three Drives” pattern.
The old farmers knew that when this pattern appeared, it was time to hedge their crops, or add to their hedge.
When I was a student at MarketGeometry, Tim Morge explained this pattern, and ever since it’s served me well as a signal for a trend reversal.
I don’t know exactly how this will help each of you, but I’m sure it’s worth a heads-up. Whether you decide to hedge, close your positions, or just HODL until the sun burns out, it’s something to keep in mind.
Meanwhile, the Harvest Moon is shining into my office tonight, twinkling with a strange grin... 🌕
Time for me to rest.
Good night, everyone.
🌾 🌾 🌾 🌾 🌾 🌾 🌾

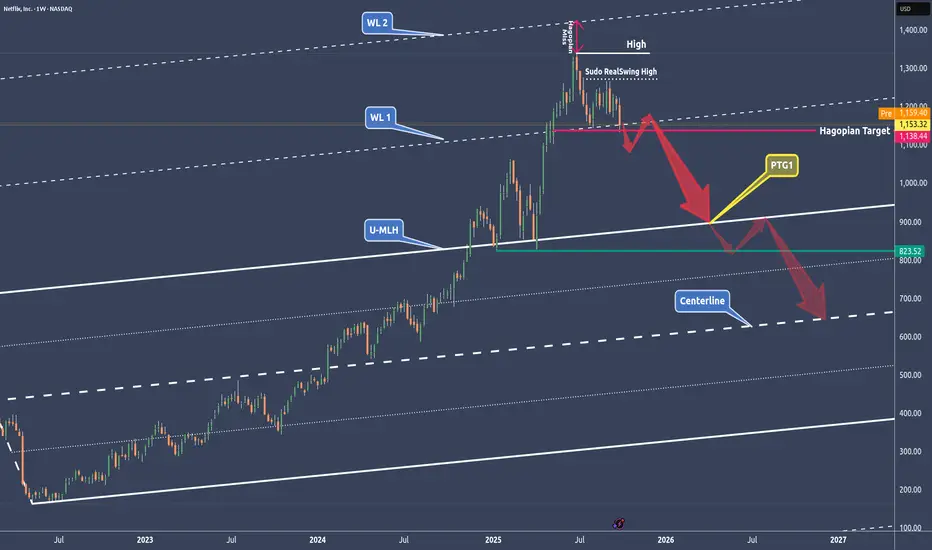
NFLX - NetFlix done after the run?🔱 A break of the WL1 could be the technical short signal 🔱
NetFlix had a monster run.
✅ Here’s a grounded fundamental breakdown of risks that could push Netflix downward. None of these are certainties, instead think of them as warning signs, not predictions.
👉 Slowing subscriber growth – growth in mature markets may plateau, and churn could rise if hit shows underperform.
👉 Rising competition and costs – rivals like Disney+ and Amazon force Netflix to spend more on content, squeezing profit margins.
👉 High valuation risk – expectations are lofty, so even a small earnings miss could trigger a sharp sell-off.
✅ Chart analysis
After missing WL2, we’ve got a Hagopian in play, which I’d say still hasn’t been fulfilled. The line was touched by a few ticks, but usually these lines break more decisively.
🔨 If we open and close below WL1, I’m stalking a pullback to it, just to hit the market on the head. If this break really happens, we’ll also have a clean structure for our stop, placed above the last RealSwing high.
🎯 The target is set in stone for me: It's the U-MLH and beyond, down to the Centerline.
Let’s stay focused and keep our cool.
Happy new week!
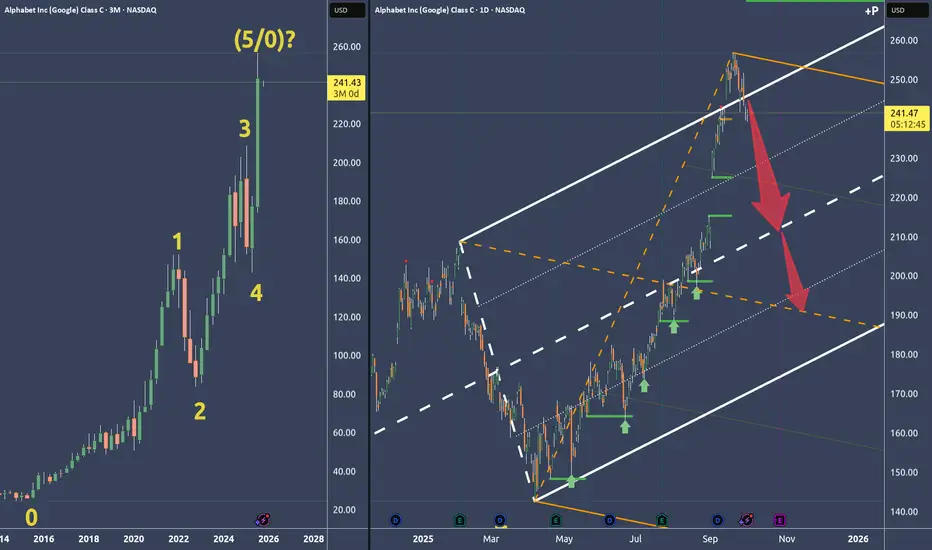
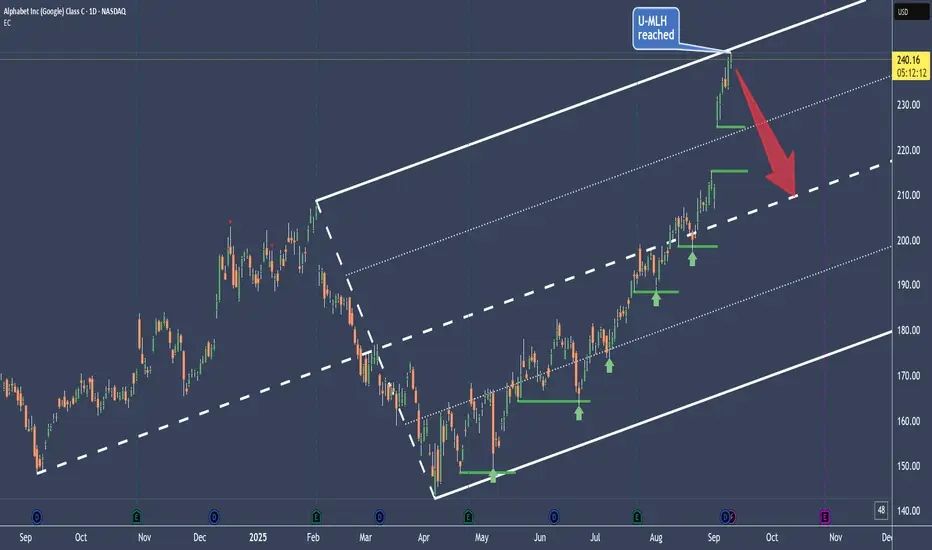
Google Alphabet: Why I think it's time to short🔱 Simple decision because of the Fork framework 🔱
Left Chart:
Zero-to-five count with a potential P5 and a turn.
Why P5?...
Right Chart:
...because price broke out of the U-MLH, then fell back into the fork. As a filter I like it when price is opening and closing inside the fork again. All in all it's a new and weak behaviour.
Or in short: That’s a pretty darn strong short signal to me.
Following the rules, taking acceptable risks, and hunting a fat profit.
👉 PTG1: The white centerline
👉 PTG2: The orange centerline
🛷 Happy Sleigh Ride 🎄
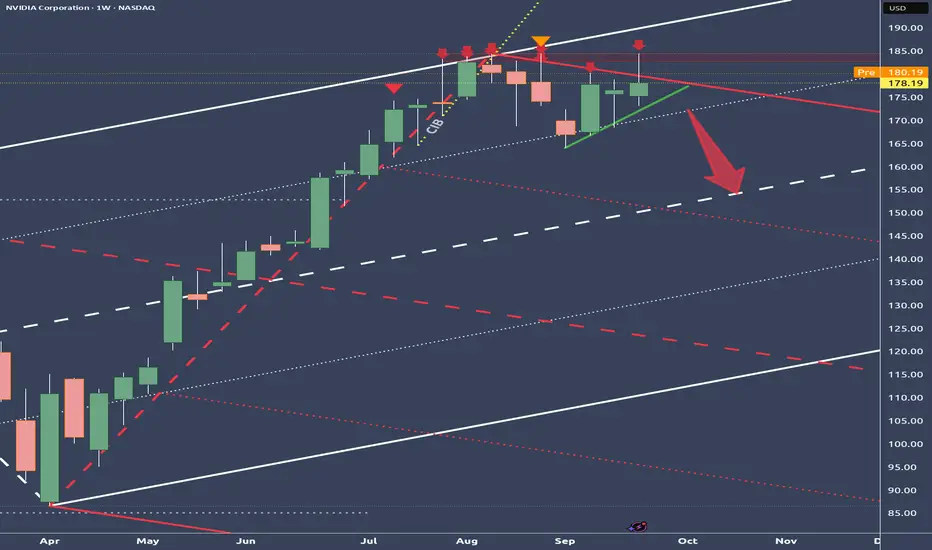
NVIDIA – Enormous Pressure After Reaching the Stretch LevelBetween July 31 and August 13, price kept nagging at the white U-MLH,
but there wasn’t enough strength to break through.
From there, price began to drift lower, pressing against the red U-MLH.
The close last Friday failed to break below the red U-MLH –
a clear sign of weakness!
If the green mini-trendline gives way and the white ¼-Line moves above price as well,
NVDA could be ripe for a short setup.
Let’s stalk the trade.
EUR/USD: A Decision Level for SurePrice managed to reach the white centerline again (80% rule!) after forming a Hagopian in early 2025.
Now it’s sandwiched between the orange U-MLH and the white centerline.
Wherever it breaks out will determine the direction we should trade.
If it breaks upwards, the next targets are the ¼-line and then the U-MLH.
If it breaks below the white centerline, I’ll wait for a test/retest and then jump on the train south toward the white L-MLH.
Patience is key!

Google has reached it's stretch level👉 The rubber band is stretched 📉💥🐍
👉 Euphoria is at it's top 🚀💸🌕
👉 Greed eats brain 💰🤑👐
So, why not taking a casual short?
Let's say, with some ITM Put Options, just to define the risk?
Because if I short the UL, there's still a chance that greed and euphoria goes nuts and gaps way above the U-MLH.
So, let's give it time to mature, like a good old Whiskey §8-)
Cheers 🥃
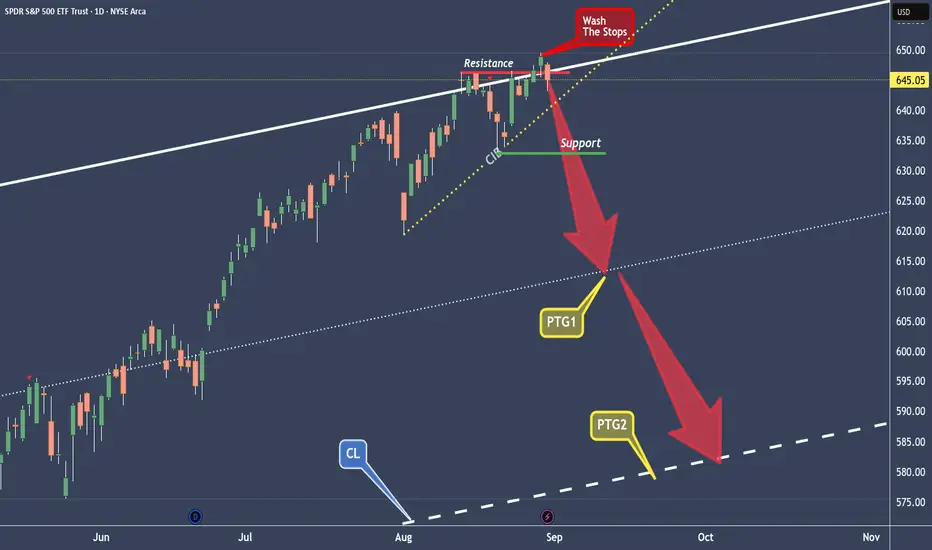
SPY washed away the Stops, and now rinse supportAt the U-MLH the air is very, very thin now.
SPY is experience this and it looks like this market shows it's hand.
It's the second time where the breakout failed.
A classical Double-Top.
Today SPY will open back into the Fork, which is a very bad sign for climbing markets. And if SPY can't close outside the Fork today, it would be a clear short to me.
So, after the Wash of the Stops at the Top, what follows is the "Rinse" of the support level and then way down to the PTG1, the 1/4 line, and further to the PTG2 at the Center-Line.
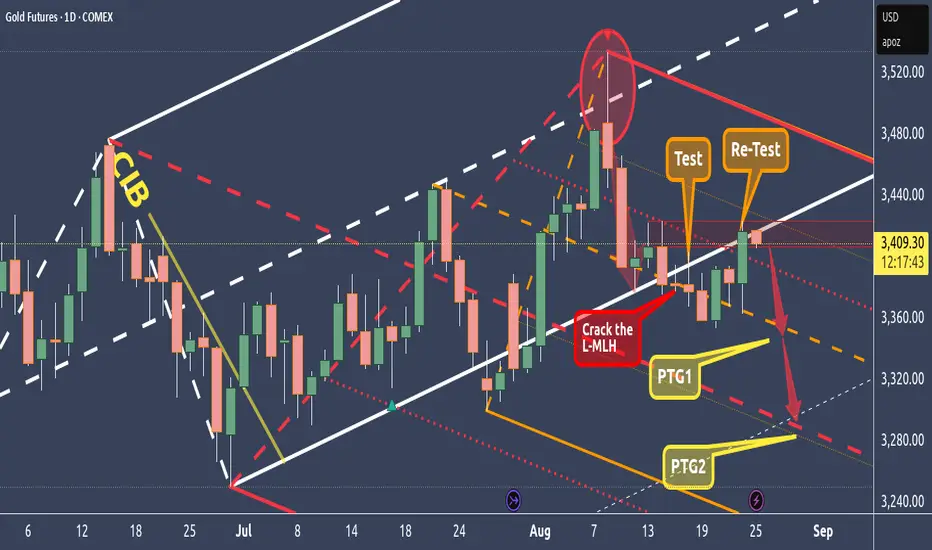
GC - Gold Re-Testing The L-MLH - Short AheadFirst we crack the L-MLH.
Then we got a test and now the re-test.
On a close outside the fork it's a present to short wit stops above somewhere the wicks high.
Profit at the orange Centerline (PTG1) and at the Red Centerline. All in all a wonderful trade with a decent risk/reward.
And if the train leaves without us, NO FOMO please §8-)
XAU USDxau usd we are expecting kind a move according to our analysis.... right now price is ranging on sideways so we will plan accordingly as per direction which we havr marked
