NZDCAD Set To Fall! SELL!
My dear friends,
My technical analysis for NZDCAD is below:
The market is trading on 0.8065 pivot level.
Bias - Bearish
Technical Indicators: Both Super Trend & Pivot HL indicate a highly probable Bearish continuation.
Target - 0.8053
Recommended Stop Loss - 0.8072
About Used Indicators:
A pivot point is a technical analysis indicator, or calculations, used to determine the overall trend of the market over different time frames.
Disclosure: I am part of Trade Nation's Influencer program and receive a monthly fee for using their TradingView charts in my analysis.
———————————
WISH YOU ALL LUCK
Short

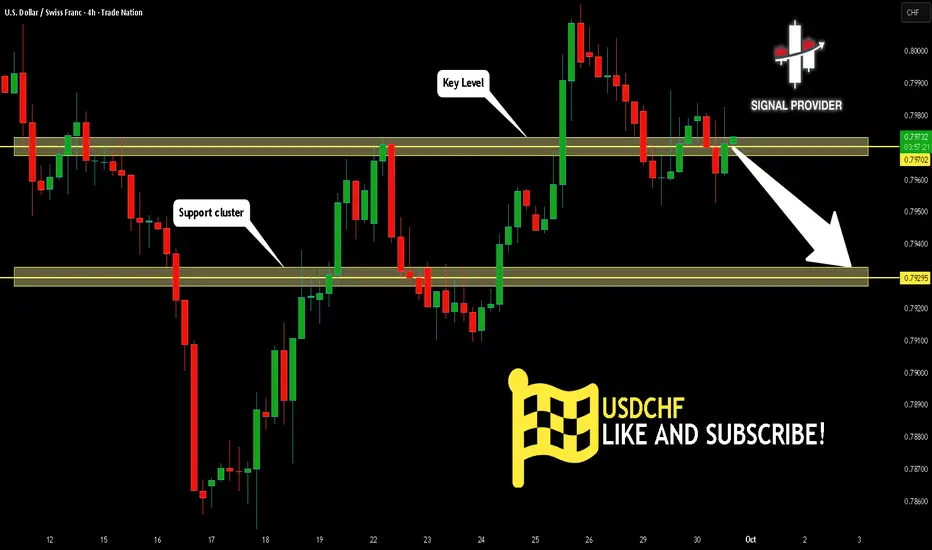
USDCHF Will Go Lower From Resistance! Short!
Here is our detailed technical review for USDCHF.
Time Frame: 4h
Current Trend: Bearish
Sentiment: Overbought (based on 7-period RSI)
Forecast: Bearish
The market is on a crucial zone of supply 0.797.
The above-mentioned technicals clearly indicate the dominance of sellers on the market. I recommend shorting the instrument, aiming at 0.792 level.
P.S
Overbought describes a period of time where there has been a significant and consistent upward move in price over a period of time without much pullback.
Like and subscribe and comment my ideas if you enjoy them!
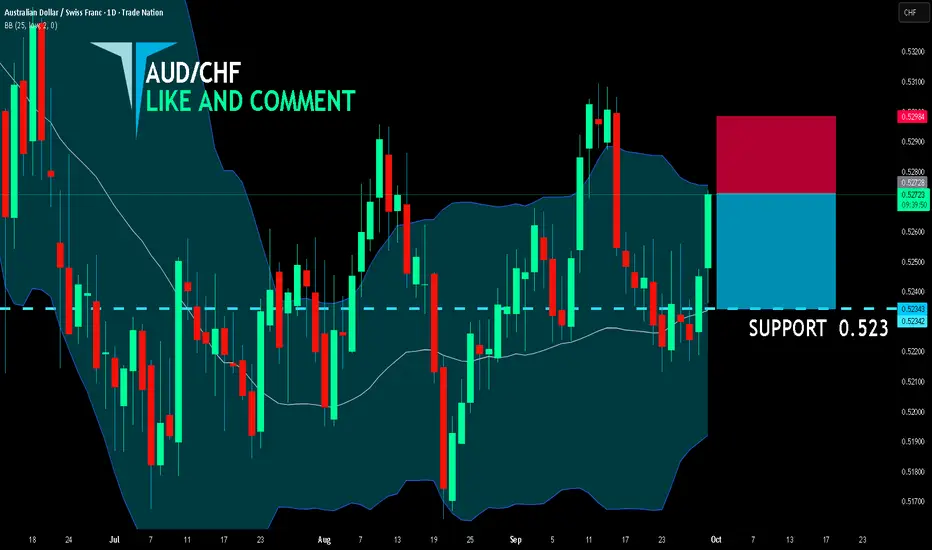
AUD/CHF SHORT FROM RESISTANCE
AUD/CHF SIGNAL
Trade Direction: short
Entry Level: 0.527
Target Level: 0.523
Stop Loss: 0.529
RISK PROFILE
Risk level: medium
Suggested risk: 1%
Timeframe: 1D
Disclosure: I am part of Trade Nation's Influencer program and receive a monthly fee for using their TradingView charts in my analysis.
✅LIKE AND COMMENT MY IDEAS✅
EUR/AUD BEARS ARE STRONG HERE|SHORT
Hello, Friends!
Bearish trend on EUR/AUD, defined by the red colour of the last week candle combined with the fact the pair is overbought based on the BB upper band proximity, makes me expect a bearish rebound from the resistance line above and a retest of the local target below at 1.778.
Disclosure: I am part of Trade Nation's Influencer program and receive a monthly fee for using their TradingView charts in my analysis.
✅LIKE AND COMMENT MY IDEAS✅

GBP/AUD BEARS ARE GAINING STRENGTH|SHORT
Hello, Friends!
GBP/AUD is making a bullish rebound on the 1H TF and is nearing the resistance line above while we are generally bearish biased on the pair due to our previous 1W candle analysis, thus making a trend-following short a good option for us with the target being the 2.043 level.
Disclosure: I am part of Trade Nation's Influencer program and receive a monthly fee for using their TradingView charts in my analysis.
✅LIKE AND COMMENT MY IDEAS✅

USOIL BEARS WILL DOMINATE THE MARKET|SHORT
USOIL SIGNAL
Trade Direction: short
Entry Level: 65.18
Target Level: 63.42
Stop Loss: 66.35
RISK PROFILE
Risk level: medium
Suggested risk: 1%
Timeframe: 9h
Disclosure: I am part of Trade Nation's Influencer program and receive a monthly fee for using their TradingView charts in my analysis.
✅LIKE AND COMMENT MY IDEAS✅

HYPE SHORT #Update2Hello everyone 😍
💁♂️ Let's have an update for the HYPE-USDT cryptocurrency
👉 In the first analysis, we identified two paths, one is a decline from the same area,
The second is a decline from a higher area after consuming liquidity
From the first area, it fell by 18% and then moved up and consumed the high liquidity and the main decline started and fell again by 33%. 🔥
👉 It seems that the first and second targets, which are the lower orange areas, are within reach.
The first orange area is the $36.5 area.
The second orange area is the $31.5 area.
The third area is the $26 area (low probability) compared to the two areas above.
The blue path is the path I identified in the first analysis.
The red line is also a head and shoulders pattern on the daily and 4-hour time frames (the head and shoulders are inside the red circle)
The upper blue area is also the QM-level.
🤔 Did you use this analysis?
⚠️The analysis may not reach the final target, so at each target, if you make a good profit and see signs of a trend change, you can exit the trade or manage your capital.
⚠️ None of the analysis is a recommendation to buy or sell, but simply my personal opinions on the charts. You can use the charts and choose any that interest you and take a position if you wish.
To support me, I would appreciate it if you boost the analysis and share it with your friends so that I can analyze it with more energy for you, my dears. Thank you all. 💖

M-USDT SHORT #Update1Hello everyone 😍
💁♂️ Let's go for an exciting update
The M-USDT cryptocurrency touched 3 of its targets with a Sharpie move
It fell 34% from where I placed the analysis and 40% from where the trigger entered until now 🔥🔥🔥
In the previous analysis, I said what the signs of the decline were
It wouldn't be bad to review it together once again
💁♂️ Signs of trend weakness:
The slope of the tops is decreasing
The tops are getting closer
The chart's movement angle is also decreasing and becoming negative
Lower tops are forming
Lower bottoms are forming
Did you use this analysis?
⚠️The analysis may not reach the final target, so at each target, if you make a good profit and see signs of a trend change, you can exit the trade or manage your capital.
⚠️ None of the analysis is a recommendation to buy or sell, but simply my personal opinions on the charts. You can use the charts and choose any that interest you and take a position if you wish.
To support me, I would appreciate it if you boost the analysis and share it with your friends so that I can analyze it with more energy for you, my dears. Thank you all. 💖

EUR/USD Macro + Technical TargetLiquidity Run Complete
• EUR/USD swept last week’s key high and stalled.
• Dollar Index (DXY) just balanced on its weekly range—classic setup for a euro fade if USD strength resumes.
Macro Undercurrent
• U.S. Side: September core PCE inflation held at 2.8% y/y, keeping the Fed cautious about rate cuts. Futures now price only ~40 bps of easing into Q1.
• Eurozone Side: HICP inflation slowed to 2.4% and the ECB’s minutes flagged “weak growth, sticky wages.” Rate-cut odds for March keep rising.
Levels to Watch
• Resistance near 1.17540,todays High
• Southbound magnets: 1.16455 Lows

#028: USD/CHF SHORT Investment Opportunity
The USD/CHF exchange rate is once again in a crucial technical and psychological zone: the 0.8000 level remains a key barrier defended by institutional investors. Hello, I'm Andrea Russo, an independent Forex trader and prop trader with $200,000 in capital under management. Thank you in advance for your time.
🔎 Technical and Intermarket Analysis
The price has repeatedly reacted below this level, showing an inability to consolidate above 0.8010–0.8020.
The 8-hour structure remains in a medium-term bearish channel.
Indicators confirm bearish divergences, with the Swiss franc gradually strengthening against the dollar.
📊 Flows and Positioning
Retail remains heavily long (over 70%), a signal opposite to the banks' direction.
Open interest on CME highlights an increase in bearish positions, while FX options show a concentration of strikes in the 0.8000 area, with a negative range favoring short positions.
📉 Expected scenario
With these elements, the primary scenario remains bearish:
The psychological and institutional resistance at 0.8000 represents the level from which strong hands defend their positions.
The main risk is represented by spikes above 0.8015, which serve to absorb retail liquidity before a new downward momentum.

GBPCAD: Bearish Continuation
It is essential that we apply multitimeframe technical analysis and there is no better example of why that is the case than the current GBPCAD chart which, if analyzed properly, clearly points in the downward direction.
Disclosure: I am part of Trade Nation's Influencer program and receive a monthly fee for using their TradingView charts in my analysis.
❤️ Please, support our work with like & comment! ❤️

EURGBP: Trading Signal From Our Team
EURGBP
- Classic bearish setup
- Our team expects bearish continuation
SUGGESTED TRADE:
Swing Trade
Short EURGBP
Entry Point - 0.8738
Stop Loss - 0.8742
Take Profit - 0.8731
Our Risk - 1%
Start protection of your profits from lower levels
Disclosure: I am part of Trade Nation's Influencer program and receive a monthly fee for using their TradingView charts in my analysis.
❤️ Please, support our work with like & comment! ❤️

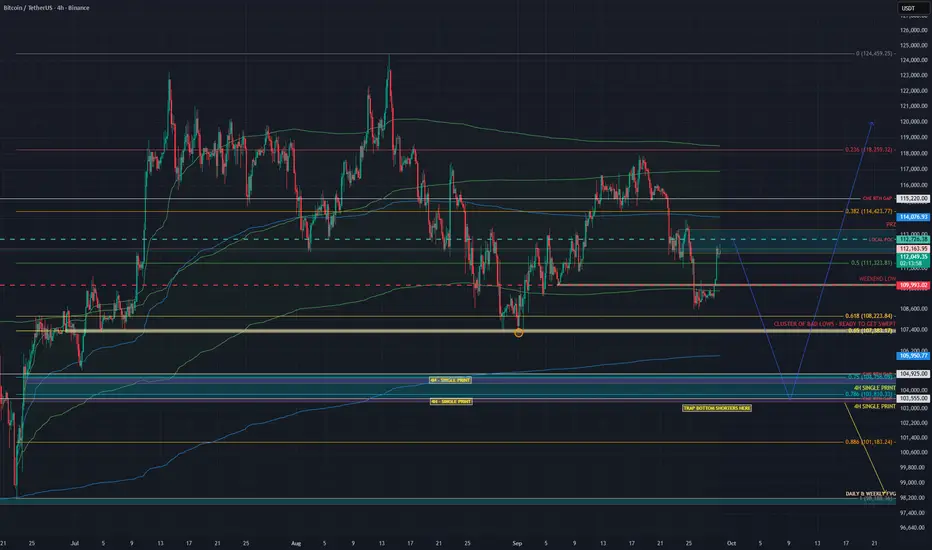
SHORT BITCOIN – THE TRAP IS BELOW, NOT ABOVE!Traders,
From the current levels around $112.8K–$113K, I believe Bitcoin is setting up for another leg down into the $104K region.
Why? Because at current levels we already have multiple Anchored VWAPs (AVWAPs) lining up from different swing high → low auctions, which makes this area heavy resistance.
That means the probability of retracing higher is limited, and instead, the market is more likely to drop into $104K — where there’s significant unfinished business — before a proper bounce can occur.
🔮 Hypothesis
From current levels ($112.8K–$113K), price will reject and move down toward $104K.
Retracement higher than $113K is unlikely given AVWAP confluence + resistance stack.
The $104K region will act as a bounce zone, potentially with a Swing Failure Pattern (SFP) wick.
📊 Data & Confluence
🔻 Why $104K Is a Magnet
HTF Point of Control (POC): The high-volume node where markets naturally seek equilibrium.
HTF AVWAP: Anchored VWAP from major pivots aligns here, marking fair value.
4H TPO Single Prints + Fib Retracements (0.75–0.786): Gaps in auction structure converge with key Fibonacci levels.
CME Gap: The $104K CME RTH gap still needs filling — markets often return here for balance.
Sept 1st Low (Weekly TPO): Poor excess signals unfinished auction business, pulling price back down.
🔼 Why Current Levels Won’t Hold
Clustered AVWAPs (different swing high → low auctions): Acting as strong dynamic resistance.
Multiple POCs at current zone: Volume saturation suggests exhaustion.
Fibonacci confluence + harmonic pattern: Pointing to lower continuation.
💵 Macro Flows
USDT Dominance (USDT.D): Breaking higher → capital shifting to stablecoins → bearish BTC.
Aggregated CVD: Spot CVD drifting slightly higher, but futures CVD flat with no OI expansion.
→ No real demand behind the move.
📌 My Take
Bitcoin is most likely to:
Reject from current AVWAP resistance ($112.8K–$113K).
Drop into $104K, clearing imbalances and luring in shorts below the 0.786 fib.
Trigger a wick/squeeze move up (Swing Failure Pattern) to trap those late shorters.
⚠️ If $104K fails to hold, next target is the imbalance zone around $98.5K.
✅ Conclusion
The market is loaded with resistance at current levels. Until that’s broken with conviction, the path of least resistance is down into $104K.
That’s where the real battle will be.
Trade safe, manage risk, and don’t get trapped on the wrong side of the wick.
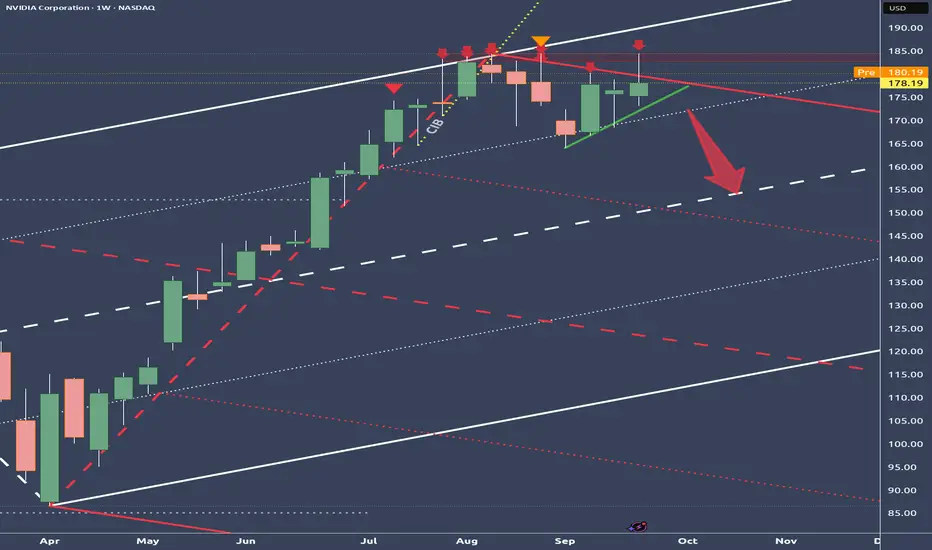
NVIDIA – Enormous Pressure After Reaching the Stretch LevelBetween July 31 and August 13, price kept nagging at the white U-MLH,
but there wasn’t enough strength to break through.
From there, price began to drift lower, pressing against the red U-MLH.
The close last Friday failed to break below the red U-MLH –
a clear sign of weakness!
If the green mini-trendline gives way and the white ¼-Line moves above price as well,
NVDA could be ripe for a short setup.
Let’s stalk the trade.
EUR/USD: A Decision Level for SurePrice managed to reach the white centerline again (80% rule!) after forming a Hagopian in early 2025.
Now it’s sandwiched between the orange U-MLH and the white centerline.
Wherever it breaks out will determine the direction we should trade.
If it breaks upwards, the next targets are the ¼-line and then the U-MLH.
If it breaks below the white centerline, I’ll wait for a test/retest and then jump on the train south toward the white L-MLH.
Patience is key!

SPX - That's all folks?The world has gone nuts, but markets didn't even blink.
Now the SPX has reached it's U-MLH, which means, it's at a real extreme.
This is a level where price starts to stall, then turn.
Often we see "a last attempt" to break through, and it really could happen. But then, gravity again takes it's toll and the rocket starts to turn south.
Here are the scenarios I see:
1. Immediate turn at the U-MLH. Target is the Centerline.
2. A break of the U-MLH, then back into the fork and a fall down to the Centerline.
3. Break the U-MLH, continuation to the WL1.
The most unlikely would be 3.
In my view, Party People should have left allready, but they refused to.
And that's why this time headaches will be the least problem they face.
Wating for a short signal, to load up heavy.

BTCUSD – Last Chance to Go HigherOver the weekend, price found support just outside the white L-MLH. That’s where I previously mentioned the red Centerline — the target for the earlier short trade.
Now, however, price has jumped back into the fork. Tthis could be the last chance to break out of the down-sloping yellow fork to the upside.
P3 would be my next level to watch for support after the break of the red Centerline.

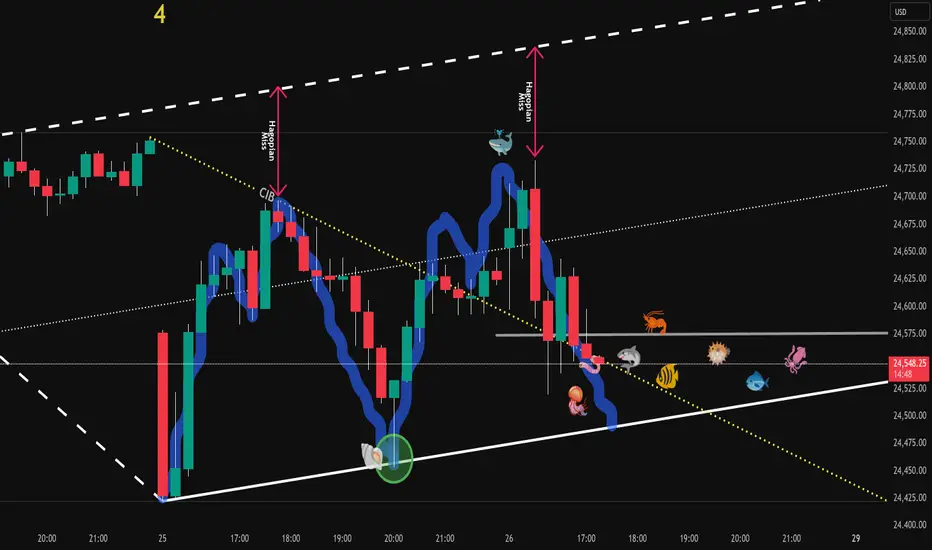
NQ is twitching the worm - Don't take the bait🎣 Don’t take the bait! 🎣
Just sitting here, watching my pre-market setup.
Now I can see them twitching the worm, trying to lure me in.
NOPE!
This price action’s way too twitchy for me. §8-)
This Chart is a RTH with "Gap-Attached" and gives a perfect catch of the first drop.
So, just casually watching...maybe I can learn even more...
🐟🐠🐡🐟🐠🐡🐟🐠🐡🐟🐠🐡🐟🐠🐡🐟🐠🐡🐟🐠🐡
USDJPY Will Go Lower! Sell!
Please, check our technical outlook for USDJPY.
Time Frame: 1D
Current Trend: Bearish
Sentiment: Overbought (based on 7-period RSI)
Forecast: Bearish
The market is trading around a solid horizontal structure 148.642.
The above observations make me that the market will inevitably achieve 146.320 level.
P.S
The term oversold refers to a condition where an asset has traded lower in price and has the potential for a price bounce.
Overbought refers to market scenarios where the instrument is traded considerably higher than its fair value. Overvaluation is caused by market sentiments when there is positive news.
Like and subscribe and comment my ideas if you enjoy them!

GBPUSD Will Go Down! Short!
Here is our detailed technical review for GBPUSD.
Time Frame: 1D
Current Trend: Bearish
Sentiment: Overbought (based on 7-period RSI)
Forecast: Bearish
The market is testing a major horizontal structure 1.343.
Taking into consideration the structure & trend analysis, I believe that the market will reach 1.320 level soon.
P.S
We determine oversold/overbought condition with RSI indicator.
When it drops below 30 - the market is considered to be oversold.
When it bounces above 70 - the market is considered to be overbought.
Like and subscribe and comment my ideas if you enjoy them!

USDJPY Will Go Lower! Short!
Please, check our technical outlook for USDJPY.
Time Frame: 2h
Current Trend: Bearish
Sentiment: Overbought (based on 7-period RSI)
Forecast: Bearish
The market is approaching a significant resistance area 149.732.
Due to the fact that we see a positive bearish reaction from the underlined area, I strongly believe that sellers will manage to push the price all the way down to 148.888 level.
P.S
We determine oversold/overbought condition with RSI indicator.
When it drops below 30 - the market is considered to be oversold.
When it bounces above 70 - the market is considered to be overbought.
Like and subscribe and comment my ideas if you enjoy them!

GOLD BEARS ARE GAINING STRENGTH|SHORT
GOLD SIGNAL
Trade Direction: short
Entry Level: 3,824.27
Target Level: 3,583.49
Stop Loss: 3,983.30
RISK PROFILE
Risk level: medium
Suggested risk: 1%
Timeframe: 1D
Disclosure: I am part of Trade Nation's Influencer program and receive a monthly fee for using their TradingView charts in my analysis.
✅LIKE AND COMMENT MY IDEAS✅

AUD/CAD SELLERS WILL DOMINATE THE MARKET|SHORT
AUD/CAD SIGNAL
Trade Direction: short
Entry Level: 0.913
Target Level: 0.906
Stop Loss: 0.918
RISK PROFILE
Risk level: medium
Suggested risk: 1%
Timeframe: 9h
Disclosure: I am part of Trade Nation's Influencer program and receive a monthly fee for using their TradingView charts in my analysis.
✅LIKE AND COMMENT MY IDEAS✅
