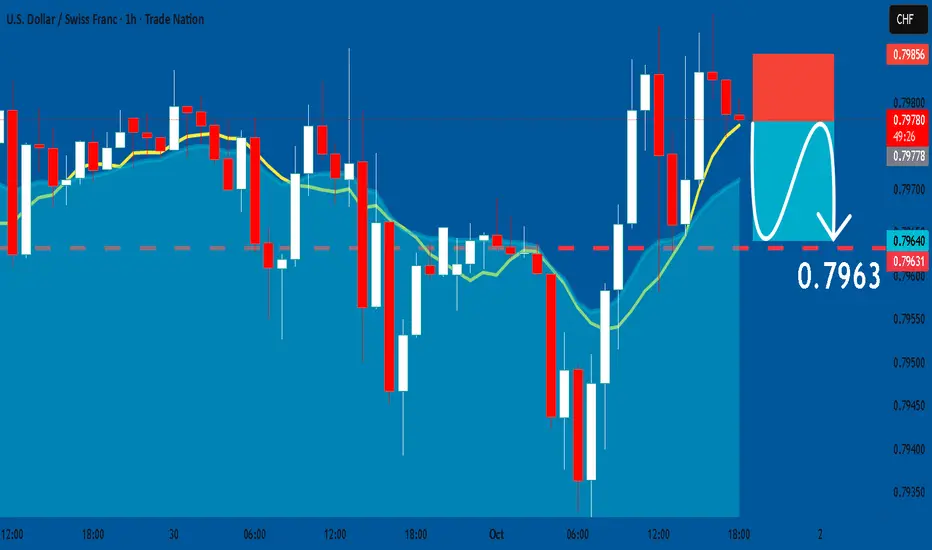
USDCHF: Short Signal Explained
USDCHF
- Classic bearish formation
- Our team expects pullback
SUGGESTED TRADE:
Swing Trade
Short USDCHF
Entry - 0.7978
Sl - 0.7985
Tp - 0.7963
Our Risk - 1%
Start protection of your profits from lower levels
Disclosure: I am part of Trade Nation's Influencer program and receive a monthly fee for using their TradingView charts in my analysis.
❤️ Please, support our work with like & comment! ❤️
Short
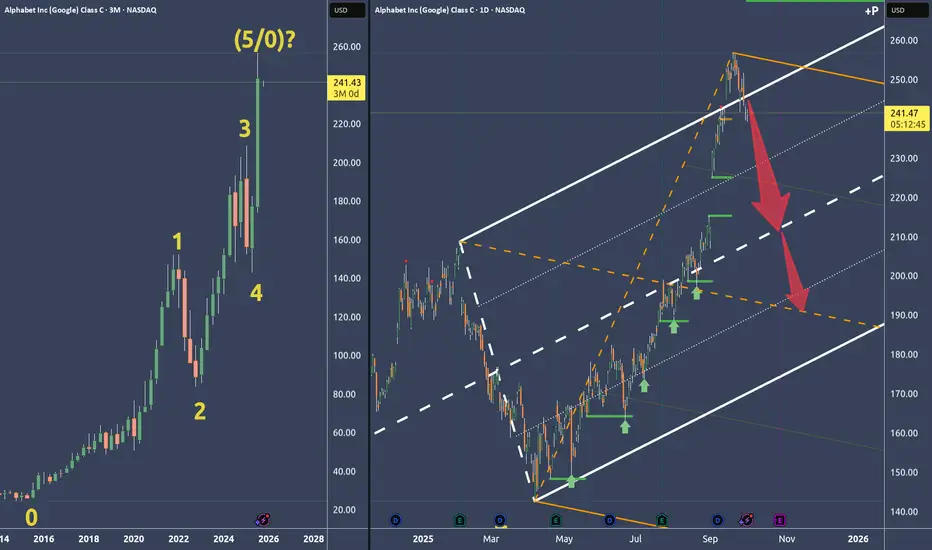
Google Alphabet: Why I think it's time to short🔱 Simple decision because of the Fork framework 🔱
Left Chart:
Zero-to-five count with a potential P5 and a turn.
Why P5?...
Right Chart:
...because price broke out of the U-MLH, then fell back into the fork. As a filter I like it when price is opening and closing inside the fork again. All in all it's a new and weak behaviour.
Or in short: That’s a pretty darn strong short signal to me.
Following the rules, taking acceptable risks, and hunting a fat profit.
👉 PTG1: The white centerline
👉 PTG2: The orange centerline
🛷 Happy Sleigh Ride 🎄
EURNZD The Target Is DOWN! SELL!
My dear subscribers,
EURNZD looks like it will make a good move, and here are the details:
The market is trading on 2.0307 pivot level.
Bias - Bearish
My Stop Loss - 2.0329
Technical Indicators: Both Super Trend & Pivot HL indicate a highly probable Bearish continuation.
Target - 2.0272
About Used Indicators:
The average true range (ATR) plays an important role in 'Supertrend' as the indicator uses ATR to calculate its value. The ATR indicator signals the degree of price volatility.
Disclosure: I am part of Trade Nation's Influencer program and receive a monthly fee for using their TradingView charts in my analysis.
———————————
WISH YOU ALL LUCK

EURCHF Will Collapse! SELL!
My dear followers,
I analysed this chart on EURCHF and concluded the following:
The market is trading on 0.9362 pivot level.
Bias - Bearish
Technical Indicators: Both Super Trend & Pivot HL indicate a highly probable Bearish continuation.
Target - 0.9352
About Used Indicators:
A super-trend indicator is plotted on either above or below the closing price to signal a buy or sell. The indicator changes color, based on whether or not you should be buying. If the super-trend indicator moves below the closing price, the indicator turns green, and it signals an entry point or points to buy.
Disclosure: I am part of Trade Nation's Influencer program and receive a monthly fee for using their TradingView charts in my analysis.
———————————
WISH YOU ALL LUCK

EURUSD My Opinion! SELL!
My dear friends,
Please, find my technical outlook for EURUSD below:
The price is coiling around a solid key level - 1.1756
Bias - Bearish
Technical Indicators: Pivot Points Low anticipates a potential price reversal.
Super trend shows a clear sell, giving a perfect indicators' convergence.
Goal - 1.1741
Safe Stop Loss - 1.1765
About Used Indicators:
The pivot point itself is simply the average of the high, low and closing prices from the previous trading day.
Disclosure: I am part of Trade Nation's Influencer program and receive a monthly fee for using their TradingView charts in my analysis.
———————————
WISH YOU ALL LUCK

EURUSD: Short Trade with Entry/SL/TP
EURUSD
- Classic bearish pattern
- Our team expects retracement
SUGGESTED TRADE:
Swing Trade
Sell EURUSD
Entry - 1.1752
Stop - 1.1760
Take - 1.1736
Our Risk - 1%
Start protection of your profits from lower levels
Disclosure: I am part of Trade Nation's Influencer program and receive a monthly fee for using their TradingView charts in my analysis.
❤️ Please, support our work with like & comment! ❤️

NZDUSD What Next? SELL!
My dear followers,
This is my opinion on the NZDUSD next move:
The asset is approaching an important pivot point 0.5826
Bias - Bearish
Technical Indicators: Supper Trend generates a clear short signal while Pivot Point HL is currently determining the overall Bearish trend of the market.
Goal - 0.5795
About Used Indicators:
For more efficient signals, super-trend is used in combination with other indicators like Pivot Points.
Disclosure: I am part of Trade Nation's Influencer program and receive a monthly fee for using their TradingView charts in my analysis.
———————————
WISH YOU ALL LUCK

BITCOIN Will Go Lower! Sell!
Please, check our technical outlook for BITCOIN.
Time Frame: 9h
Current Trend: Bearish
Sentiment: Overbought (based on 7-period RSI)
Forecast: Bearish
The market is approaching a significant resistance area 116,555.66.
Due to the fact that we see a positive bearish reaction from the underlined area, I strongly believe that sellers will manage to push the price all the way down to 113,250.42 level.
P.S
Please, note that an oversold/overbought condition can last for a long time, and therefore being oversold/overbought doesn't mean a price rally will come soon, or at all.
Like and subscribe and comment my ideas if you enjoy them!

GBPUSD Will Move Lower! Short!
Take a look at our analysis for GBPUSD.
Time Frame: 12h
Current Trend: Bearish
Sentiment: Overbought (based on 7-period RSI)
Forecast: Bearish
The price is testing a key resistance 1.351.
Taking into consideration the current market trend & overbought RSI, chances will be high to see a bearish movement to the downside at least to 1.339 level.
P.S
We determine oversold/overbought condition with RSI indicator.
When it drops below 30 - the market is considered to be oversold.
When it bounces above 70 - the market is considered to be overbought.
Like and subscribe and comment my ideas if you enjoy them!

GBPCAD Is Bearish! Sell!
Please, check our technical outlook for GBPCAD.
Time Frame: 12h
Current Trend: Bearish
Sentiment: Overbought (based on 7-period RSI)
Forecast: Bearish
The market is trading around a solid horizontal structure 1.882.
The above observations make me that the market will inevitably achieve 1.869 level.
P.S
Overbought describes a period of time where there has been a significant and consistent upward move in price over a period of time without much pullback.
Like and subscribe and comment my ideas if you enjoy them!

XAUUSD Short: Targeting 3800 on a Corrective MoveHello, traders! The price auction for XAUUSD has been operating within a well-defined ascending channel, confirming a strong bullish trend. This structure has guided the price higher through a series of impulsive moves and pullbacks, with buyers maintaining the initiative throughout this phase.
Currently, the auction is at a critical inflection point at the top of this channel. The price has rallied to directly test the channel's ascending supply line after a strong run-up. This is a key area where sellers are expected to emerge and challenge the prevailing bullish momentum.
My scenario for the development of events is a short-term corrective move from these highs. I expect that sellers will defend the supply line and reject the price, initiating a downward rotation back towards the channel's support. A failure to break out higher would confirm a temporary correction is underway. The take-profit is therefore set at 3800, targeting the major demand zone. Manage your risk.

SILVER BEARS ARE GAINING STRENGTH|SHORT
SILVER SIGNAL
Trade Direction: short
Entry Level: 4,733.3
Target Level: 4,466.5
Stop Loss: 4,911.7
RISK PROFILE
Risk level: medium
Suggested risk: 1%
Timeframe: 9h
Disclosure: I am part of Trade Nation's Influencer program and receive a monthly fee for using their TradingView charts in my analysis.
✅LIKE AND COMMENT MY IDEAS✅

NZD/USD SELLERS WILL DOMINATE THE MARKET|SHORT
NZD/USD SIGNAL
Trade Direction: short
Entry Level: 0.581
Target Level: 0.574
Stop Loss: 0.585
RISK PROFILE
Risk level: medium
Suggested risk: 1%
Timeframe: 5h
Disclosure: I am part of Trade Nation's Influencer program and receive a monthly fee for using their TradingView charts in my analysis.
✅LIKE AND COMMENT MY IDEAS✅

GBP/USD BEARISH BIAS RIGHT NOW| SHORT
Hello, Friends!
We are targeting the 1.340 level area with our short trade on GBP/USD which is based on the fact that the pair is overbought on the BB band scale and is also approaching a resistance line above thus going us a good entry option.
Disclosure: I am part of Trade Nation's Influencer program and receive a monthly fee for using their TradingView charts in my analysis.
✅LIKE AND COMMENT MY IDEAS✅

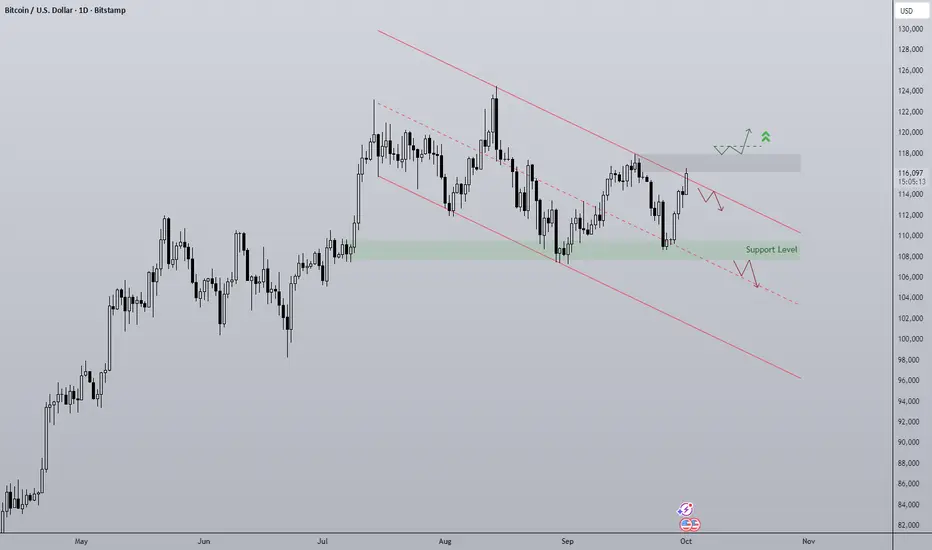
Bitcoin in Q4 As "Uptober" begins the layout for Bitcoin is as follows:
- Downtrend on the daily officially since 18th September but really it began after the SFP of ATH on August 14th.
- The origin of the rally to ATH has served as support twice since at $108,000
- Diagonal trendline resistance being tested as Q4 begins, seasonality shows October is very strong for returns, 21.89% average since 2019.
- Compression of the range inevitably leads to a breakout in either direction.
Bullish scenario is reclaim of $117,500 to push towards ATH.
Bearish scenario is a loss of $108,000
Q-usdt ShortHello friends 😍
💖 First of all, thank you for giving me the motivation to post more analyses by hitting the
💖👉 boost button 👈💖
Let's start the day with another analysis
The Q-USDT cryptocurrency has the potential to fall
👉If I see the structure I want in these areas and the blue areas above, I will take a short and wait until the orange areas below
⚠️If I don't see the trigger I want, I will not enter the trade and short position!
So, you should not rush to enter and you must enter with a reason and a trigger
⚠️The analysis may not reach the final target, so at each target, if you make a good profit and see signs of a trend change, you can exit the trade or manage your capital.
⚠️ None of the analysis is a recommendation to buy or sell, but simply my personal opinions on the charts. You can use the charts and choose any that interest you and take a position if you wish.
To support me, I would appreciate it if you boost the analysis and share it with your friends so that I can analyze it with more energy for you, my dears. Thank you all. 💖

GBP/JPY - Breakdown 1H🔥 GBP/JPY – 1H Breakdown 🔥
Alright fam, let’s cook this chart 👇
📊 Structure Check
Price has been tanking hard from that 4H supply zone up top.
We formed a lower high (LP S) and then rolled over, continuing bearish structure.
Currently price is consolidating under a descending trendline → looks like it’s coiling for a move.
🎯 Key Zones
Upside liquidity grab: Price could squeeze into that 71% retrace + 15M/1H supply pocket.
🔼 That’s the “snack stop” zone before bigger players slam it.
Downside magnet: We’ve got strong support marked lower (blue zone). That’s the real draw if supply holds.
🛠️ Scenarios
Fakeout Pump → Dump
Price squeezes up into that 71% + supply zone.
Liquidity gets eaten → sellers step in.
Drop straight into strong support.
Direct Breakdown
If no pump happens, this wedge could just crack down.
Same target: strong support area below.
⚖️ Bias
Short-term bullish liquidity sweep possible 🚀
But overall still bearish until strong support proves otherwise.
📝 Game Plan
Watch the 71% + supply combo for rejection entries 🎯
Target the support zone below
Manage risk – don’t chase mid-range chop
⏳ Looks like GBP/JPY wants to bait longs before flushing again. Stay sharp, fam.

GBPUSD: Bearish Continuation is Highly Probable! Here is Why:
Our strategy, polished by years of trial and error has helped us identify what seems to be a great trading opportunity and we are here to share it with you as the time is ripe for us to sell GBPUSD.
Disclosure: I am part of Trade Nation's Influencer program and receive a monthly fee for using their TradingView charts in my analysis.
❤️ Please, support our work with like & comment! ❤️

AUDUSD: Weak Market & Bearish Forecast
The recent price action on the AUDUSD pair was keeping me on the fence, however, my bias is slowly but surely changing into the bearish one and I think we will see the price go down.
Disclosure: I am part of Trade Nation's Influencer program and receive a monthly fee for using their TradingView charts in my analysis.
❤️ Please, support our work with like & comment! ❤️

NZDCAD Set To Fall! SELL!
My dear friends,
My technical analysis for NZDCAD is below:
The market is trading on 0.8065 pivot level.
Bias - Bearish
Technical Indicators: Both Super Trend & Pivot HL indicate a highly probable Bearish continuation.
Target - 0.8053
Recommended Stop Loss - 0.8072
About Used Indicators:
A pivot point is a technical analysis indicator, or calculations, used to determine the overall trend of the market over different time frames.
Disclosure: I am part of Trade Nation's Influencer program and receive a monthly fee for using their TradingView charts in my analysis.
———————————
WISH YOU ALL LUCK

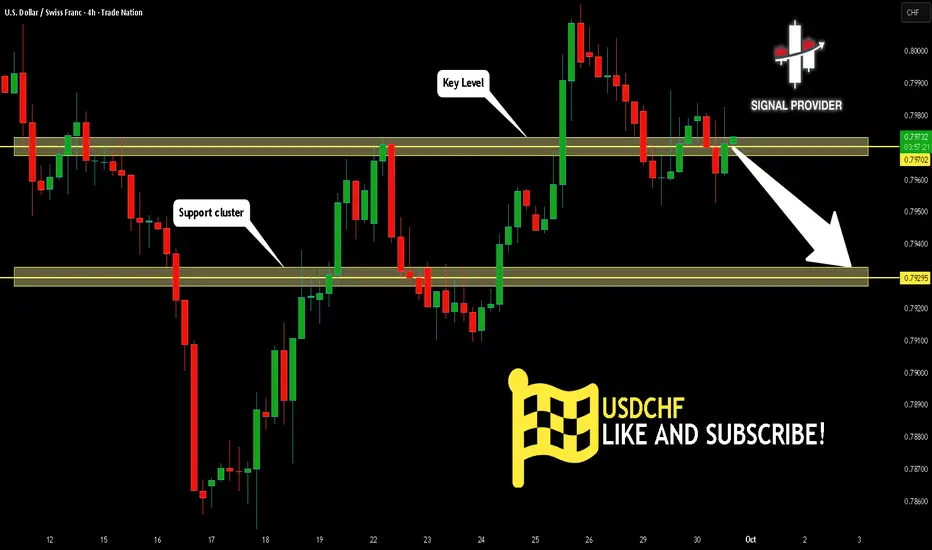
USDCHF Will Go Lower From Resistance! Short!
Here is our detailed technical review for USDCHF.
Time Frame: 4h
Current Trend: Bearish
Sentiment: Overbought (based on 7-period RSI)
Forecast: Bearish
The market is on a crucial zone of supply 0.797.
The above-mentioned technicals clearly indicate the dominance of sellers on the market. I recommend shorting the instrument, aiming at 0.792 level.
P.S
Overbought describes a period of time where there has been a significant and consistent upward move in price over a period of time without much pullback.
Like and subscribe and comment my ideas if you enjoy them!
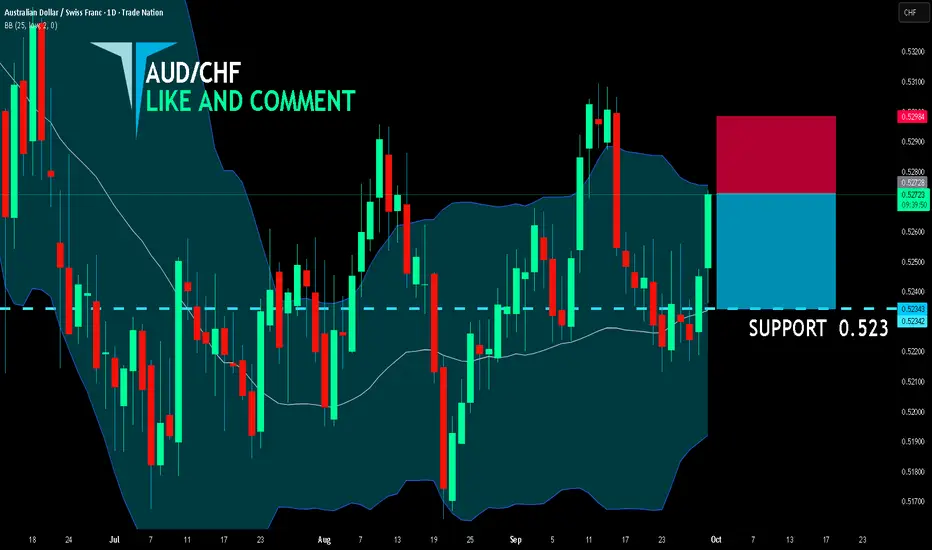
AUD/CHF SHORT FROM RESISTANCE
AUD/CHF SIGNAL
Trade Direction: short
Entry Level: 0.527
Target Level: 0.523
Stop Loss: 0.529
RISK PROFILE
Risk level: medium
Suggested risk: 1%
Timeframe: 1D
Disclosure: I am part of Trade Nation's Influencer program and receive a monthly fee for using their TradingView charts in my analysis.
✅LIKE AND COMMENT MY IDEAS✅
EUR/AUD BEARS ARE STRONG HERE|SHORT
Hello, Friends!
Bearish trend on EUR/AUD, defined by the red colour of the last week candle combined with the fact the pair is overbought based on the BB upper band proximity, makes me expect a bearish rebound from the resistance line above and a retest of the local target below at 1.778.
Disclosure: I am part of Trade Nation's Influencer program and receive a monthly fee for using their TradingView charts in my analysis.
✅LIKE AND COMMENT MY IDEAS✅
