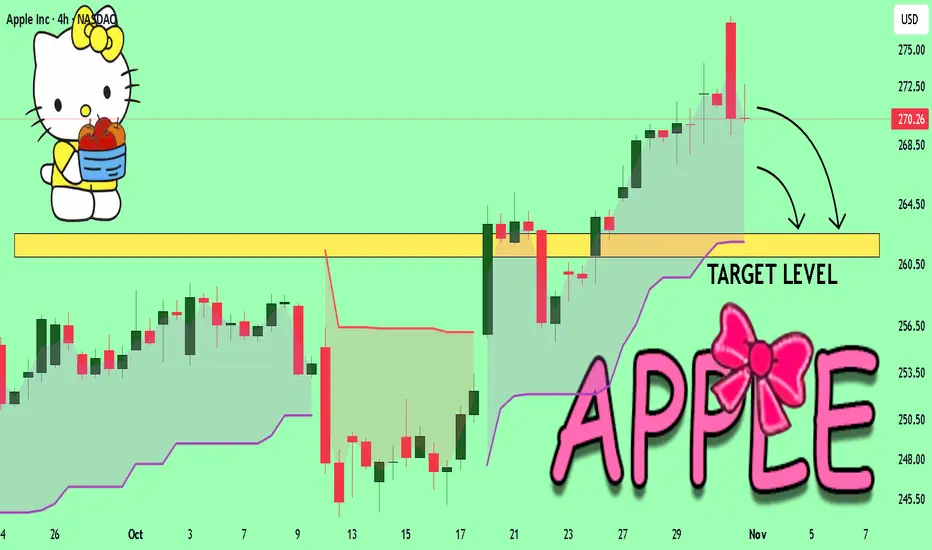
APPLE Set To Fall! SELL!
My dear subscribers,
APPLE looks like it will make a good move, and here are the details:
The market is trading on 270.26 pivot level.
Bias - Bearish
Technical Indicators: Both Super Trend & Pivot HL indicate a highly probable Bearish continuation.
Target - 262.56
About Used Indicators:
The average true range (ATR) plays an important role in 'Supertrend' as the indicator uses ATR to calculate its value. The ATR indicator signals the degree of price volatility.
Disclosure: I am part of Trade Nation's Influencer program and receive a monthly fee for using their TradingView charts in my analysis.
———————————
WISH YOU ALL LUCK
Short
USOIL Will Collapse! SELL!
My dear subscribers,
This is my opinion on the USOIL next move:
The instrument tests an important psychological level 60.87
Bias - Bearish
Technical Indicators: Supper Trend gives a precise Bearish signal, while Pivot Point HL predicts price changes and potential reversals in the market.
Target - 60.50
My Stop Loss - 61.09
About Used Indicators:
On the subsequent day, trading above the pivot point is thought to indicate ongoing bullish sentiment, while trading below the pivot point indicates bearish sentiment.
Disclosure: I am part of Trade Nation's Influencer program and receive a monthly fee for using their TradingView charts in my analysis.
———————————
WISH YOU ALL LUCK

USOIL BEARS WILL DOMINATE THE MARKET|SHORT
USOIL SIGNAL
Trade Direction: short
Entry Level: 60.87
Target Level: 55.71
Stop Loss: 64.31
RISK PROFILE
Risk level: medium
Suggested risk: 1%
Timeframe: 1D
Disclosure: I am part of Trade Nation's Influencer program and receive a monthly fee for using their TradingView charts in my analysis.
✅LIKE AND COMMENT MY IDEAS✅

USD/JPY SENDS CLEAR BEARISH SIGNALS|SHORT
Hello, Friends!
USD/JPY pair is in the downtrend because previous week’s candle is red, while the price is obviously rising on the 4H timeframe. And after the retest of the resistance line above I believe we will see a move down towards the target below at 152.709 because the pair is overbought due to its proximity to the upper BB band and a bearish correction is likely.
Disclosure: I am part of Trade Nation's Influencer program and receive a monthly fee for using their TradingView charts in my analysis.
✅LIKE AND COMMENT MY IDEAS✅

GBPUSD Will Fall! Short!
Take a look at our analysis for GBPUSD.
Time Frame: 9h
Current Trend: Bearish
Sentiment: Overbought (based on 7-period RSI)
Forecast: Bearish
The price is testing a key resistance 1.331.
Taking into consideration the current market trend & overbought RSI, chances will be high to see a bearish movement to the downside at least to 1.320 level.
P.S
Please, note that an oversold/overbought condition can last for a long time, and therefore being oversold/overbought doesn't mean a price rally will come soon, or at all.
Like and subscribe and comment my ideas if you enjoy them!

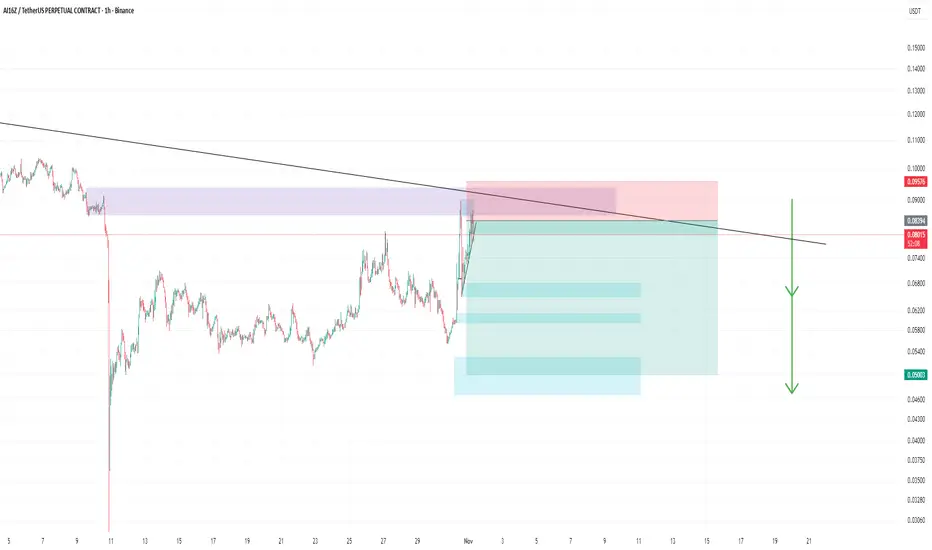
AI16Z shortHello everyone 😍
💁♂️This time we are back with a great position with a setup
I think the AI16Z cryptocurrency can fall to the lower areas
⚠️This is my opinion and please check yours before entering the trade
First target area $0.067
Second target area $0.0602
Last target area $0.052
⚠️The analysis may not reach the final target, so at each target, if you make a good profit and see signs of a trend change, you can exit the trade or manage your capital.
⚠️ None of the analysis is a recommendation to buy or sell, but simply my personal opinions on the charts. You can use the charts and choose any that interest you and take a position if you wish.
To support me, I would appreciate it if you boost the analysis and share it with your friends so that I can analyze it with more energy for you, my dears. Thank you all. 💖
USDCAD: Expecting Bearish Continuation! Here is Why:
The price of USDCAD will most likely collapse soon enough, due to the supply beginning to exceed demand which we can see by looking at the chart of the pair.
Disclosure: I am part of Trade Nation's Influencer program and receive a monthly fee for using their TradingView charts in my analysis.
❤️ Please, support our work with like & comment! ❤️

EURUSD Trading Opportunity! SELL!
My dear friends,
My technical analysis for EURUSD is below:
The market is trading on 1.1659 pivot level.
Bias - Bearish
Technical Indicators: Both Super Trend & Pivot HL indicate a highly probable Bearish continuation.
Target - 1.1623
About Used Indicators:
A pivot point is a technical analysis indicator, or calculations, used to determine the overall trend of the market over different time frames.
Disclosure: I am part of Trade Nation's Influencer program and receive a monthly fee for using their TradingView charts in my analysis.
———————————
WISH YOU ALL LUCK

USDJPY Trading Opportunity! SELL!
My dear subscribers,
My technical analysis for USDJPY is below:
The price is coiling around a solid key level - 154.15
Bias - Bearish
Technical Indicators: Pivot Points High anticipates a potential price reversal.
Super trend shows a clear sell, giving a perfect indicators' convergence.
Goal - 153.12
About Used Indicators:
By the very nature of the supertrend indicator, it offers firm support and resistance levels for traders to enter and exit trades. Additionally, it also provides signals for setting stop losses
Disclosure: I am part of Trade Nation's Influencer program and receive a monthly fee for using their TradingView charts in my analysis.
———————————
WISH YOU ALL LUCK

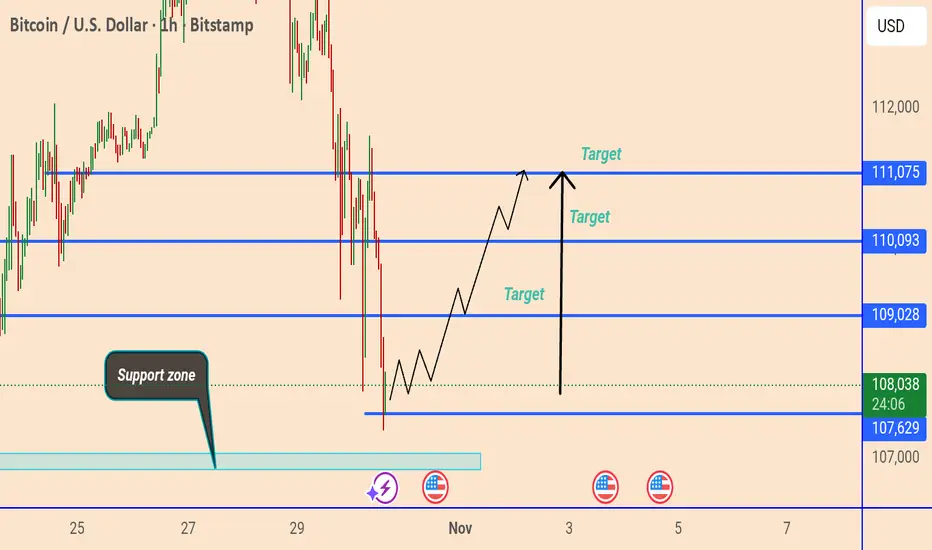
Bitcoin Price Analysis: Potential Rebound from Key Support Zone This chart shows the BTC/USD (1-hour) price action with key support and resistance levels. Bitcoin is currently trading near $107,904, slightly above a highlighted support zone around $107,629–$107,000. The analysis suggests a potential bullish reversal from this support, with projected upside targets at $109,028, $110,093, and $111,075.
GOLD The Target Is DOWN! SELL!
My dear friends,
My technical analysis for GOLD is below:
The market is trading on 4022.7 pivot level.
Bias - Bearish
Technical Indicators: Both Super Trend & Pivot HL indicate a highly probable Bearish continuation.
Target - 4010.3
Recommended Stop Loss - 4030.0
About Used Indicators:
A pivot point is a technical analysis indicator, or calculations, used to determine the overall trend of the market over different time frames.
Disclosure: I am part of Trade Nation's Influencer program and receive a monthly fee for using their TradingView charts in my analysis.
———————————
WISH YOU ALL LUCK

GOLD SELLERS WILL DOMINATE THE MARKET|SHORT
GOLD SIGNAL
Trade Direction: short
Entry Level: 4,010.34
Target Level: 3,889.94
Stop Loss: 4,089.87
RISK PROFILE
Risk level: medium
Suggested risk: 1%
Timeframe: 4h
Disclosure: I am part of Trade Nation's Influencer program and receive a monthly fee for using their TradingView charts in my analysis.
✅LIKE AND COMMENT MY IDEAS✅

AUD/CHF BEARS ARE STRONG HERE|SHORT
Hello, Friends!
AUD/CHF is making a bullish rebound on the 12H TF and is nearing the resistance line above while we are generally bearish biased on the pair due to our previous 1W candle analysis, thus making a trend-following short a good option for us with the target being the 0.517 level.
Disclosure: I am part of Trade Nation's Influencer program and receive a monthly fee for using their TradingView charts in my analysis.
✅LIKE AND COMMENT MY IDEAS✅

GBP/AUD SHORT FROM RESISTANCE
Hello, Friends!
It makes sense for us to go short on GBP/AUD right now from the resistance line above with the target of 2.044 because of the confluence of the two strong factors which are the general downtrend on the previous 1W candle and the overbought situation on the lower TF determined by it’s proximity to the upper BB band.
Disclosure: I am part of Trade Nation's Influencer program and receive a monthly fee for using their TradingView charts in my analysis.
✅LIKE AND COMMENT MY IDEAS✅

USDJPY Is Going Down! Short!
Here is our detailed technical review for USDJPY.
Time Frame: 2h
Current Trend: Bearish
Sentiment: Overbought (based on 7-period RSI)
Forecast: Bearish
The market is on a crucial zone of supply 154.213.
The above-mentioned technicals clearly indicate the dominance of sellers on the market. I recommend shorting the instrument, aiming at 153.254 level.
P.S
The term oversold refers to a condition where an asset has traded lower in price and has the potential for a price bounce.
Overbought refers to market scenarios where the instrument is traded considerably higher than its fair value. Overvaluation is caused by market sentiments when there is positive news.
Like and subscribe and comment my ideas if you enjoy them!

AUDUSD Will Fall! Sell!
Take a look at our analysis for AUDUSD.
Time Frame: 4h
Current Trend: Bearish
Sentiment: Overbought (based on 7-period RSI)
Forecast: Bearish
The price is testing a key resistance 0.654.
Taking into consideration the current market trend & overbought RSI, chances will be high to see a bearish movement to the downside at least to 0.650 level.
P.S
We determine oversold/overbought condition with RSI indicator.
When it drops below 30 - the market is considered to be oversold.
When it bounces above 70 - the market is considered to be overbought.
Like and subscribe and comment my ideas if you enjoy them!

GBPAUD Will Go Lower From Resistance! Short!
Please, check our technical outlook for GBPAUD.
Time Frame: 6h
Current Trend: Bearish
Sentiment: Overbought (based on 7-period RSI)
Forecast: Bearish
The market is trading around a solid horizontal structure 2.008.
The above observations make me that the market will inevitably achieve 1.984 level.
P.S
Overbought describes a period of time where there has been a significant and consistent upward move in price over a period of time without much pullback.
Like and subscribe and comment my ideas if you enjoy them!

EURUSD Will Go Lower! Sell!
Take a look at our analysis for EURUSD.
Time Frame: 2h
Current Trend: Bearish
Sentiment: Overbought (based on 7-period RSI)
Forecast: Bearish
The market is approaching a key horizontal level 1.160.
Considering the today's price action, probabilities will be high to see a movement to 1.157.
P.S
The term oversold refers to a condition where an asset has traded lower in price and has the potential for a price bounce.
Overbought refers to market scenarios where the instrument is traded considerably higher than its fair value. Overvaluation is caused by market sentiments when there is positive news.
Like and subscribe and comment my ideas if you enjoy them!

BTCUSD Short: Targeting 108,000 Demand ZoneHello, traders! Bitcoin (BTCUSD) has recently transitioned from a prolonged bullish structure into a corrective phase after facing strong rejection from the 116,000 Supply Zone. The market previously traded inside a well-defined Ascending Channel, forming a steady sequence of higher highs and higher lows — a classic bullish formation.However, after testing the upper boundary of the channel and the Pivot Point, BTC failed to sustain bullish momentum. The breakout attempts above the supply zone turned out to be fake breakouts, showing exhaustion among buyers. Since then, the market has shifted its tone and started to form a descending structure, moving below the Supply Line that now acts as dynamic resistance.
Currently, the price is pushing lower from the mid-range of the channel toward the Demand Zone, located between 108,000 and 107,700. This area has previously served as a strong support base that triggered impulsive bullish reversals in the past.
In my opinion, BTC is likely to extend its bearish correction toward the 108,000–107,700 demand area. A successful test and strong reaction from this zone could mark a potential bullish reversal, confirming demand absorption and the end of the correction phase. However, if sellers maintain control and manage to break decisively below 107,700, the market may open the way for a deeper decline toward the 106,000 level. As long as the price remains below the Supply Line, short-term bearish pressure prevails. I’m currently bearish to neutral, looking for price action signals around the demand area to confirm whether a new upward impulse is about to begin. Manage your risk!

Gold is Trading Under The Pressure of a Strong Dollar!!Hey Traders, in today's trading session we are monitoring XAUUSD for a selling opportunity around 4,020 zone, Gold is trading in a downtrend and currently is in a correction phase in which it is approaching the trend at 4,020 support and resistance area.
Trade safe, Joe.

#038: SHORT Investing Opportunity on NZD/USD
The NZD/USD exchange rate is exhibiting behavior that warrants attention from institutional traders. Hello, I'm Andrea Russo, an independent Forex trader and prop trader with $200,000 in capital under management. Thank you in advance for your time.
After a consolidation phase characterized by progressively higher lows, the market has reached a technical area that historically represents a decision point for directional flow.
In recent sessions, price action has shown a slowdown in the bullish momentum, with small-bodied candles and clear upper wicks, a sign of absorption of buying pressure. At the same time, an increase in intraday volatility has been observed, typical of phases in which liquidity begins to change sides.
Fundamentally, the environment remains fragile for the New Zealand dollar. Expectations of a more accommodative monetary policy from the RBNZ, combined with mixed macroeconomic data, are keeping medium-term sentiment anchored to a cautious outlook. The US dollar, while not showing particular strength, continues to benefit from the rate differential and demand for hedging in times of uncertainty.
From a technical perspective, recent price behavior suggests that the market is seeking liquidity near resistance areas, where pending orders and potential profit-taking by those who have been long in previous weeks are concentrated. This is often where the institutional transition between accumulation and distribution occurs, a prelude to broader directional movements.
Professional traders are closely monitoring the price reaction in this range: a confirmed rejection of the upper range, accompanied by consistent volume, could be an early sign of a return to bearish interest.

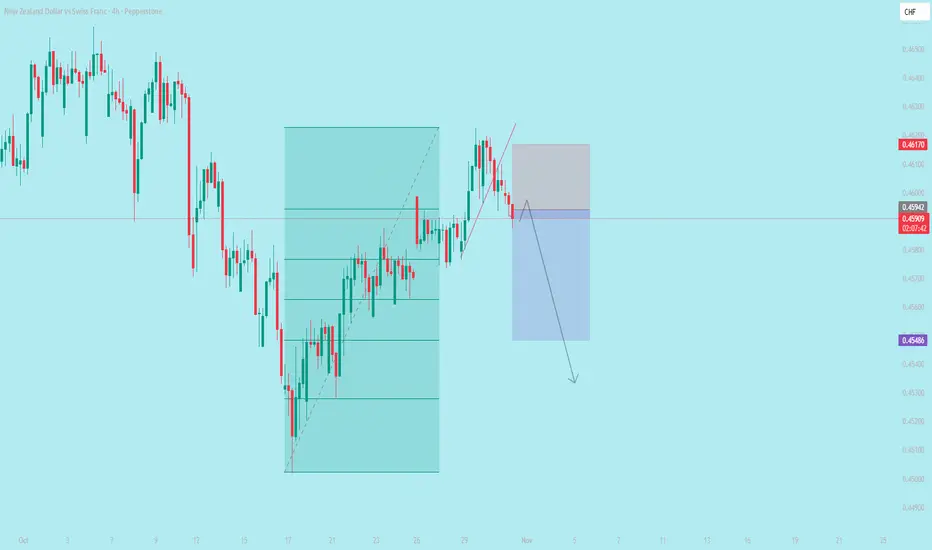
#039: SHORT Investing Opportunity on NZD/CHF
The NZD/CHF exchange rate is in a particularly interesting technical phase after the strong bullish expansion of recent weeks. Hello, I'm Andrea Russo, an independent Forex trader and prop trader with $200,000 in capital under management. Thank you in advance for your time.
The market has begun to show signs of structural weakness, with a sequence of lower highs and gradually declining volumes, while institutional flow suggests profit-taking at the top of the range.
The 4-hour chart shows a clear break of the short-term ascending trendline, accompanied by a loss of momentum in commodity currencies. The Swiss franc, on the other hand, is showing increasing relative strength, supported by defensive flows and gradually increasing volatility.
The current area represents a key point: the price is testing the volume equilibrium zone, where buy orders had accumulated in the past. A close below this level would open the door to a deeper bearish extension, while any bullish reactions at this range would be considered simple technical pullbacks until the market structure shows a true change in direction.
Momentum indicators confirm increasing bearish pressure, with negative divergences already active and cyclicality favorable to a further downturn.
On the intermarket level, the franc tends to benefit from the current risk-averse environment, while the New Zealand dollar remains exposed to more fragile sentiment linked to the agricultural sector and Asian demand dynamics.
GBPJPY Buyers In Panic! SELL!
My dear subscribers,
GBPJPY looks like it will make a good move, and here are the details:
The market is trading on 202.70 pivot level.
Bias - Bearish
My Stop Loss - 203.05
Technical Indicators: Both Super Trend & Pivot HL indicate a highly probable Bearish continuation.
Target - 202.02
About Used Indicators:
The average true range (ATR) plays an important role in 'Supertrend' as the indicator uses ATR to calculate its value. The ATR indicator signals the degree of price volatility.
Disclosure: I am part of Trade Nation's Influencer program and receive a monthly fee for using their TradingView charts in my analysis.
———————————
WISH YOU ALL LUCK
