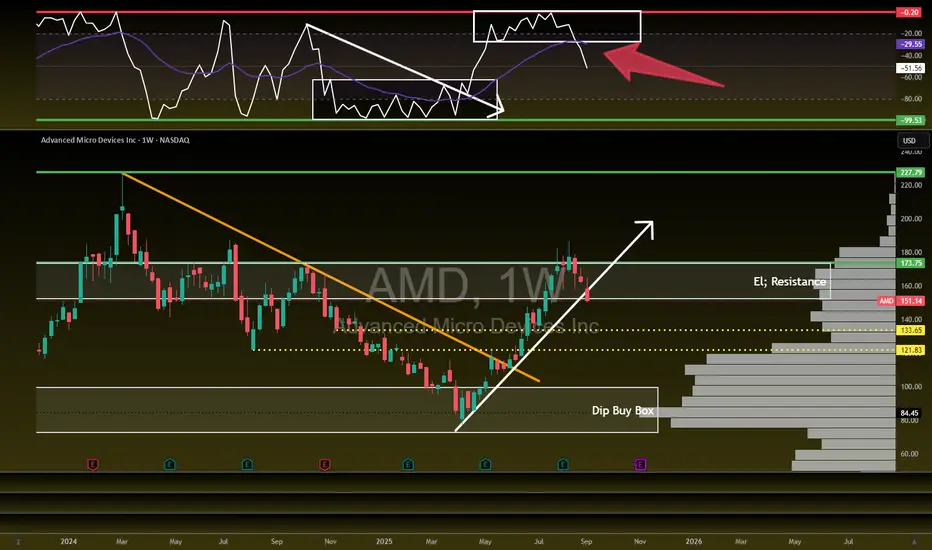
AMD - Free Fall TimeNASDAQ:AMD - Free Fall Time
Hit El' Resistance and collapsed. Uptrend broken.
WCB broken down and looking at $134 or $122 for a bottom from here.
Can't wait to get back into this trade once we flip again.
Short
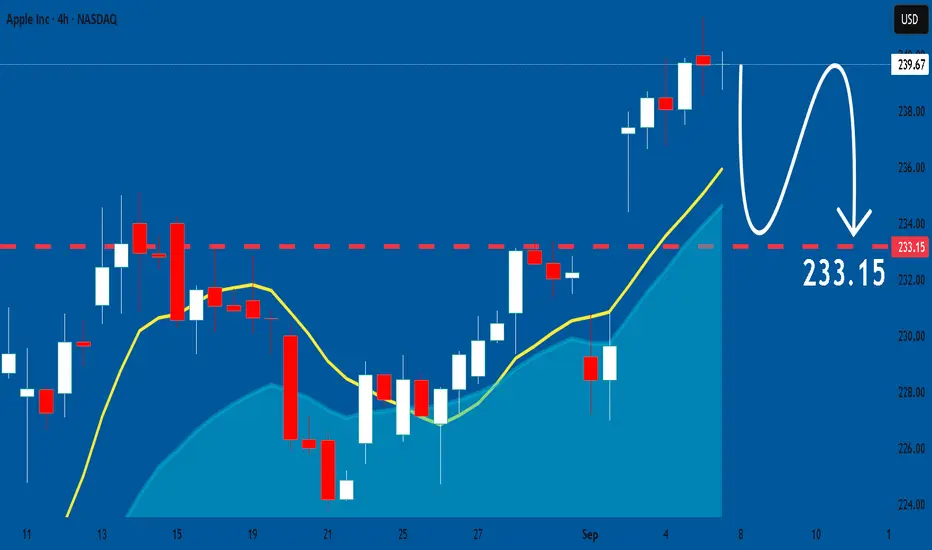
APPLE: Will Start Falling! Here is Why:
The price of APPLE will most likely collapse soon enough, due to the supply beginning to exceed demand which we can see by looking at the chart of the pair.
Disclosure: I am part of Trade Nation's Influencer program and receive a monthly fee for using their TradingView charts in my analysis.
❤️ Please, support our work with like & comment! ❤️
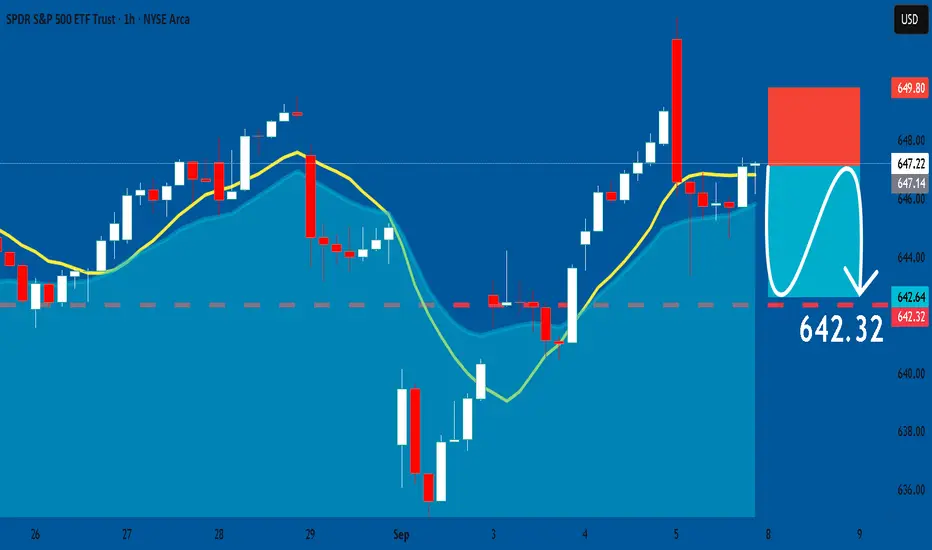
SPY: Short Trade with Entry/SL/TP
SPY
- Classic bearish pattern
- Our team expects retracement
SUGGESTED TRADE:
Swing Trade
Sell SPY
Entry - 647.14
Stop - 649.80
Take - 642.32
Our Risk - 1%
Start protection of your profits from lower levels
Disclosure: I am part of Trade Nation's Influencer program and receive a monthly fee for using their TradingView charts in my analysis.
❤️ Please, support our work with like & comment! ❤️
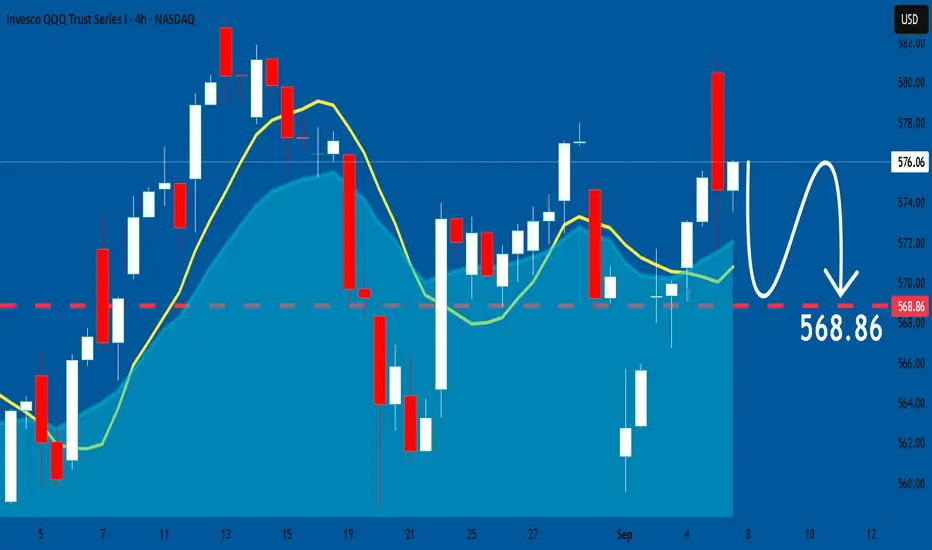
QQQ: Bearish Forecast & Outlook
Our strategy, polished by years of trial and error has helped us identify what seems to be a great trading opportunity and we are here to share it with you as the time is ripe for us to sell QQQ.
Disclosure: I am part of Trade Nation's Influencer program and receive a monthly fee for using their TradingView charts in my analysis.
❤️ Please, support our work with like & comment! ❤️
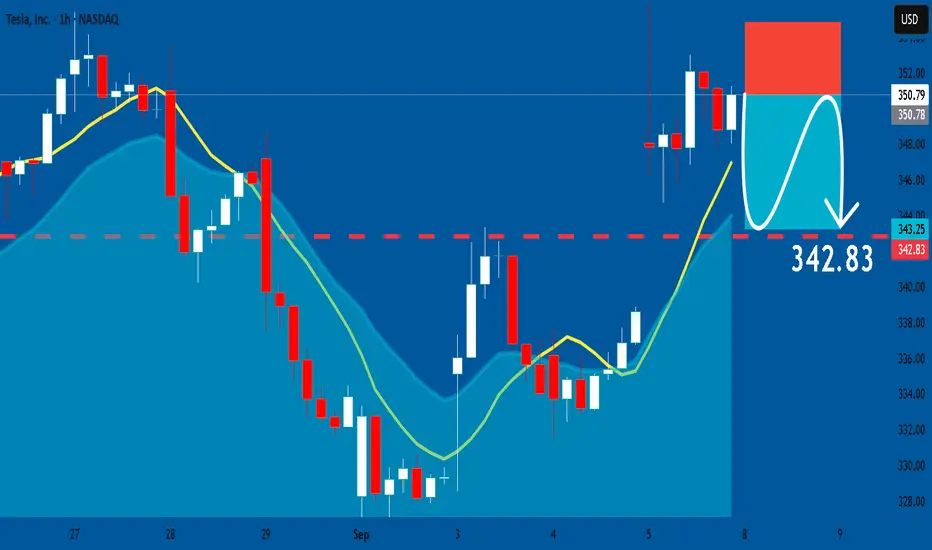
TESLA: Bearish Continuation & Short Signal
TESLA
- Classic bearish setup
- Our team expects bearish continuation
SUGGESTED TRADE:
Swing Trade
Short TESLA
Entry Point - 350.79
Stop Loss - 354.84
Take Profit - 342.83
Our Risk - 1%
Start protection of your profits from lower levels
Disclosure: I am part of Trade Nation's Influencer program and receive a monthly fee for using their TradingView charts in my analysis.
❤️ Please, support our work with like & comment! ❤️
EURUSD Trading Opportunity! SELL!
My dear subscribers,
EURUSD looks like it will make a good move, and here are the details:
The market is trading on 1.1717 pivot level.
Bias - Bearish
Technical Indicators: Both Super Trend & Pivot HL indicate a highly probable Bearish continuation.
Target - 1.1676
About Used Indicators:
The average true range (ATR) plays an important role in 'Supertrend' as the indicator uses ATR to calculate its value. The ATR indicator signals the degree of price volatility.
Disclosure: I am part of Trade Nation's Influencer program and receive a monthly fee for using their TradingView charts in my analysis.
———————————
WISH YOU ALL LUCK

XAUUSD: The Correction Phase BeginsHello everyone, here is my breakdown of the current Gold setup.
Market Analysis
From a broader perspective, the price of Gold has been in a strong uptrend since breaking out of a prior Downward Channel. This entire bullish phase has been developing within the confines of a large broadening wedge, a pattern that indicates expanding volatility as price makes higher highs and higher lows.
Currently, the price is at a critical point, testing the Broadening Resistance Line at the very top of this wedge. This test comes after a very strong and steep upward impulse, which often suggests that a trend might be overextended and due for a correction.
My Scenario & Strategy
My scenario is a tactical short, based on the idea that this strong rally is due for a healthy pullback. Trends rarely move in a straight line forever, and the resistance line of this multi-week wedge is a high-probability area for sellers to step in.
I'm looking for the price to make one final, small push higher and then show a clear sign of rejection. The primary target for this corrective fall is 3500 points. As you noted, this is an intermediate target, not the major Support 1, making it a logical first objective for a pullback.
That's the setup I'm tracking. Thank you for your attention, and always manage your risk.

USOIL Will Go Lower From Resistance! Sell!
Here is our detailed technical review for USOIL.
Time Frame: 12h
Current Trend: Bearish
Sentiment: Overbought (based on 7-period RSI)
Forecast: Bearish
The market is testing a major horizontal structure 61.941.
Taking into consideration the structure & trend analysis, I believe that the market will reach 58.529 level soon.
P.S
The term oversold refers to a condition where an asset has traded lower in price and has the potential for a price bounce.
Overbought refers to market scenarios where the instrument is traded considerably higher than its fair value. Overvaluation is caused by market sentiments when there is positive news.
Disclosure: I am part of Trade Nation's Influencer program and receive a monthly fee for using their TradingView charts in my analysis.
Like and subscribe and comment my ideas if you enjoy them!

NZDUSD Will Go Lower! Short!
Take a look at our analysis for NZDUSD.
Time Frame: 1D
Current Trend: Bearish
Sentiment: Overbought (based on 7-period RSI)
Forecast: Bearish
The market is approaching a key horizontal level 0.589.
Considering the today's price action, probabilities will be high to see a movement to 0.577.
P.S
We determine oversold/overbought condition with RSI indicator.
When it drops below 30 - the market is considered to be oversold.
When it bounces above 70 - the market is considered to be overbought.
Disclosure: I am part of Trade Nation's Influencer program and receive a monthly fee for using their TradingView charts in my analysis.
Like and subscribe and comment my ideas if you enjoy them!

GOLD SENDS CLEAR BEARISH SIGNALS|SHORT
GOLD SIGNAL
Trade Direction: short
Entry Level: 3,586.96
Target Level: 3,559.28
Stop Loss: 3,605.13
RISK PROFILE
Risk level: medium
Suggested risk: 1%
Timeframe: 1h
Disclosure: I am part of Trade Nation's Influencer program and receive a monthly fee for using their TradingView charts in my analysis.
✅LIKE AND COMMENT MY IDEAS✅

EUR/NZD BEARS ARE GAINING STRENGTH|SHORT
Hello, Friends!
EUR-NZD uptrend evident from the last 1W green candle makes short trades more risky, but the current set-up targeting 1.942 area still presents a good opportunity for us to sell the pair because the resistance line is nearby and the BB upper band is close which indicates the overbought state of the EUR/NZD pair.
Disclosure: I am part of Trade Nation's Influencer program and receive a monthly fee for using their TradingView charts in my analysis.
✅LIKE AND COMMENT MY IDEAS✅

EUR/AUD SELLERS WILL DOMINATE THE MARKET|SHORT
Hello, Friends!
EUR/AUD pair is in the uptrend because previous week’s candle is green, while the price is evidently rising on the 3H timeframe. And after the retest of the resistance line above I believe we will see a move down towards the target below at 1.779 because the pair overbought due to its proximity to the upper BB band and a bearish correction is likely.
Disclosure: I am part of Trade Nation's Influencer program and receive a monthly fee for using their TradingView charts in my analysis.
✅LIKE AND COMMENT MY IDEAS✅

GBPUSD: Bearish Continuation is Highly Probable! Here is Why:
The recent price action on the GBPUSD pair was keeping me on the fence, however, my bias is slowly but surely changing into the bearish one and I think we will see the price go down.
Disclosure: I am part of Trade Nation's Influencer program and receive a monthly fee for using their TradingView charts in my analysis.
❤️ Please, support our work with like & comment! ❤️

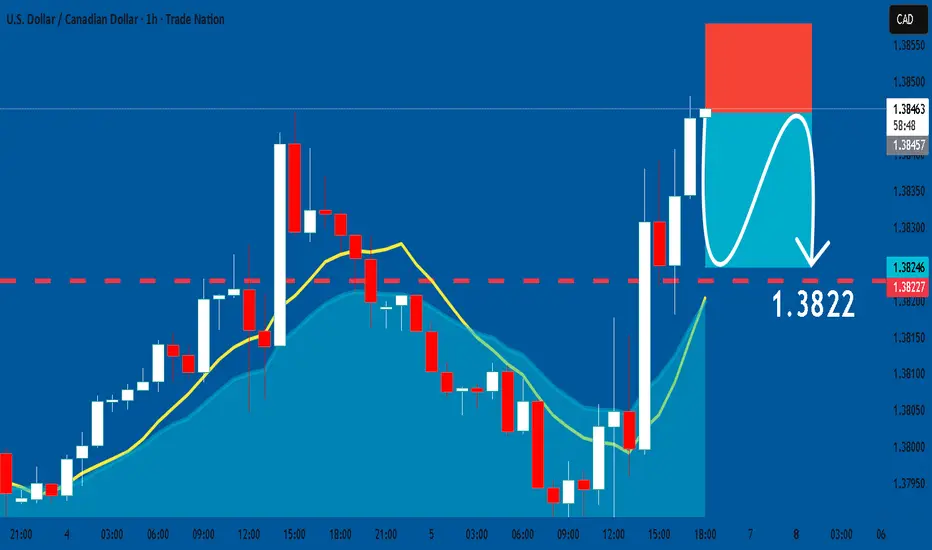
USDCAD: Short Trading Opportunity
USDCAD
- Classic bearish formation
- Our team expects fall
SUGGESTED TRADE:
Swing Trade
Sell USDCAD
Entry Level - 1.3845
Sl - 1.3857
Tp - 1.3822
Our Risk - 1%
Start protection of your profits from lower levels
Disclosure: I am part of Trade Nation's Influencer program and receive a monthly fee for using their TradingView charts in my analysis.
❤️ Please, support our work with like & comment! ❤️
BTCUSD: Price Drop to Support line of WedgeHello everyone, here is my breakdown of the current Bitcoin setup.
Market Analysis
From a broader perspective, the price action for Bitcoin has been bearish since the rejection from the Resistance Zone near the 122000 level. This initiated a downtrend that has since evolved from a channel into the current Downward Wedge pattern, which has been guiding the price through a series of lower highs and lower lows.
Currently, the price is at a critical decision point. After a bounce from the lower part of the wedge, it has rallied correctly and is now directly testing the descending resistance line of the formation.
My Scenario & Strategy
My scenario is based on the expectation that this Downward Wedge is a continuation pattern and the dominant downtrend will resume. I'm looking for the price to be rejected from the wedge's resistance line. A confirmed failure to break higher would signal the start of the next impulsive move down. This move is expected to have enough momentum to break through the intermediate Support zone around the 109600 level.
A breakdown below the 109600 support zone would validate the scenario. The primary target for this move is 105700 points, which aligns perfectly with the lower support line of the wedge pattern.
That's the setup I'm tracking. Thank you for your attention, and always manage your risk.

EURUSD: Market Sentiment & Forecast
It is essential that we apply multitimeframe technical analysis and there is no better example of why that is the case than the current EURUSD chart which, if analyzed properly, clearly points in the downward direction.
Disclosure: I am part of Trade Nation's Influencer program and receive a monthly fee for using their TradingView charts in my analysis.
❤️ Please, support our work with like & comment! ❤️

NZDUSD: Short Trade Explained
NZDUSD
- Classic bearish formation
- Our team expects pullback
SUGGESTED TRADE:
Swing Trade
Short NZDUSD
Entry - 0.5911
Sl - 0.5924
Tp - 0.5884
Our Risk - 1%
Start protection of your profits from lower levels
Disclosure: I am part of Trade Nation's Influencer program and receive a monthly fee for using their TradingView charts in my analysis.
❤️ Please, support our work with like & comment! ❤️

GOLD What Next? SELL!
My dear subscribers,
GOLD looks like it will make a good move, and here are the details:
The market is trading on 3579.7 pivot level.
Bias - Bearish
My Stop Loss - 3586.7
Technical Indicators: Both Super Trend & Pivot HL indicate a highly probable Bearish continuation.
Target - 3568.5
About Used Indicators:
The average true range (ATR) plays an important role in 'Supertrend' as the indicator uses ATR to calculate its value. The ATR indicator signals the degree of price volatility.
Disclosure: I am part of Trade Nation's Influencer program and receive a monthly fee for using their TradingView charts in my analysis.
———————————
WISH YOU ALL LUCK

EURUSD Is Bearish! Sell!
Take a look at our analysis for EURUSD.
Time Frame: 4h
Current Trend: Bearish
Sentiment: Overbought (based on 7-period RSI)
Forecast: Bearish
The price is testing a key resistance 1.168.
Taking into consideration the current market trend & overbought RSI, chances will be high to see a bearish movement to the downside at least to 1.164 level.
P.S
The term oversold refers to a condition where an asset has traded lower in price and has the potential for a price bounce.
Overbought refers to market scenarios where the instrument is traded considerably higher than its fair value. Overvaluation is caused by market sentiments when there is positive news.
Disclosure: I am part of Trade Nation's Influencer program and receive a monthly fee for using their TradingView charts in my analysis.
Like and subscribe and comment my ideas if you enjoy them!

GBPCAD Will Go Lower! Short!
Please, check our technical outlook for GBPCAD.
Time Frame: 1D
Current Trend: Bearish
Sentiment: Overbought (based on 7-period RSI)
Forecast: Bearish
The market is trading around a solid horizontal structure 1.867.
The above observations make me that the market will inevitably achieve 1.853 level.
P.S
We determine oversold/overbought condition with RSI indicator.
When it drops below 30 - the market is considered to be oversold.
When it bounces above 70 - the market is considered to be overbought.
Disclosure: I am part of Trade Nation's Influencer program and receive a monthly fee for using their TradingView charts in my analysis.
Like and subscribe and comment my ideas if you enjoy them!

EUR/CAD BEST PLACE TO SELL FROM|SHORT
EUR/CAD SIGNAL
Trade Direction: short
Entry Level: 1.610
Target Level: 1.600
Stop Loss: 1.616
RISK PROFILE
Risk level: medium
Suggested risk: 1%
Timeframe: 9h
Disclosure: I am part of Trade Nation's Influencer program and receive a monthly fee for using their TradingView charts in my analysis.
✅LIKE AND COMMENT MY IDEAS✅

EUR/JPY BEARS ARE STRONG HERE|SHORT
Hello, Friends!
EUR/JPY pair is trading in a local downtrend which know by looking at the previous 1W candle which is red. On the 9H timeframe the pair is going up. The pair is overbought because the price is close to the upper band of the BB indicator. So we are looking to sell the pair with the upper BB line acting as resistance. The next target is 172.028 area.
Disclosure: I am part of Trade Nation's Influencer program and receive a monthly fee for using their TradingView charts in my analysis.
✅LIKE AND COMMENT MY IDEAS✅

EUR/GBP SHORT FROM RESISTANCE
Hello, Friends!
We are going short on the EUR/GBP with the target of 0.859 level, because the pair is overbought and will soon hit the resistance line above. We deduced the overbought condition from the price being near to the upper BB band. However, we should use low risk here because the 1W TF is green and gives us a counter-signal.
Disclosure: I am part of Trade Nation's Influencer program and receive a monthly fee for using their TradingView charts in my analysis.
✅LIKE AND COMMENT MY IDEAS✅
