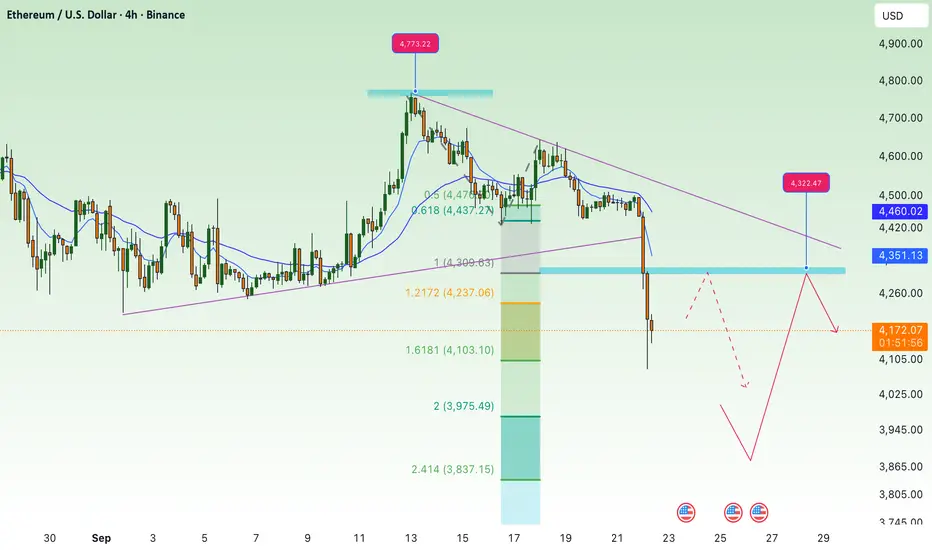
break support, continue to correct downETH 4H Chart Analysis
• Breakout Zone:
ETH has broken below the $4,360 – $4,330 zone (purple box), which previously served as strong support. This signals a shift in sentiment toward bearish momentum.
• Current Price Action:
After a sharp drop, ETH is consolidating around $4,170, hinting at a possible short-term rebound before continuing its downward structure.
• Resistance Levels:
• $4,360 – $4,330: Recently broken support, now acting as strong resistance.
• $4,505: Next resistance above, in line with prior range highs.
• Support Levels:
• $4,166: First Fib extension target, currently being tested.
• $3,880 – $3,900: Major support zone if price declines further (2.618 Fib extension + horizontal demand zone).
• Outlook:
ETH may retest the $4,330 – $4,360 resistance before continuing lower. If bearish pressure persists, the next downside target is around $3,880 – $3,900.
Shorteth
short term adjustment, accumulation for uptrend ETH💎 ETH WEEKEND PLAN UPDATE (August 22 , 2025 )
ETH is in a medium-term uptrend, having just completed wave (5) according to Elliott Wave, and is now undergoing a slight correction.
The current price zone around 4,200 – 4,300 USD is a key area to watch:
• If it holds, ETH may rebound higher.
• If it breaks down, it could retreat to deeper support levels.
Key Levels
Near Resistance:
• 4,500 – 4,600 USD: Strong resistance zone, aligning with wave (5) and Fibonacci 1.618.
• If this level is broken, the next target is 6,000 USD (Fibo 2.618).
Near Support:
• 3,800 – 3,900 USD: Confluence with EMA34 and an intermediate support zone.
• 3,200 – 3,250 USD: Strong support, intersecting EMA200 and key Fibonacci cluster.
• 2,500 – 2,600 USD: Final support, a solid base before the last strong rally.
Trend Outlook
• Short-term: ETH may continue correcting towards support to accumulate before forming a new rally.
• Medium-term: The main trend remains bullish as long as ETH holds above 3,200 USD.
• Long-term: If ETH breaks above 4,600 USD, it is highly likely to target 6,000 USD.
👉 Summary:
ETH is in a consolidation phase after a strong rally. Investors should watch the 3,800 – 3,900 USD zone closely. If it holds, the chance of retesting 4,600 USD and potentially 6,000 USD remains strong.

Is $1,600 the Sky Limit for Ethereum (ETH)?Is it the time to say goodbye to green bars????
(surely the uncertainty is the main characteristic of the market and unsustainability is the one for us...)
will be enjoyable if the market march in the same way as we conjured in our mind... :)))

ETHBTC 1D Descending Triangle Until Feb '23ETHBTC appears to be caught in a mid-term descending triangle for the next couple of months. There'll be plenty of movements in and around this area, but we'd expect a net total of about -5% over the course of the next 2 months.
Crypto Tipster v2 is currently showing a Sell signal although the market has been a tad choppy recently, and with a potential squeeze on the cards you'd need to keep your eyes on this one.

ETH ETH weakening in the range, orderbook is sell heavy. Friday losing bull steam with a pretty clear short target.

Short on ethereumShort on ETH, few reasons why eth will go down in the following days are: rsi goes down as price goes up,vector candle(liquidity down below) , bearish price pattern. I think it will reach the psychological high soon

ETH Lower PricesI can see a market structure shift on ETHUSD which I will be eyeing out the green fvg to offer selling to target lower sellside liquidity.

short short short short Please be careful with your capital
Bitcoin is at the ceiling of the channel, and according to the world conditions, it does not break 90% of the ceiling of the channel, and the fall starts, if it breaks the ceiling, the range of 27 to 29 will not allow it to rise.
Please send my analysis to your friends so that they don't lose their capital

ETH MehhhhETH still on that rising wedge, we all know wut happens at the end of rising wedges right? U do right? :D

🛑ETH Short SetupEntry
1906
Target
1815
1750
1673
1580
Sl
1960
Share your opinion in the comments and support the idea with Like.
Follow me on tradingView, if you don't want to miss my next analysis or signals.
Thanks for your support!

🛑 ETH SELL▶️ETHUSDT
❇️SELL 1710
📈Targets📈
🎯TP1 : 1670
🎯TP2 : 1600
🎯TP3 : 1570
🎯TP4 : 1515
🛑 STOP LOSSE 🛑
🛑1822
Share your opinion in the comments and support the idea with Like.
Follow me on tradingView, if you don't want to miss my next analysis or signals.
Thanks for your support!

ETHUSD short to 364Short from 1000
SL:1175
target: 364
i suspect it to go lower afterword's but for now 364 is the target

ETHUSDTDO NOT rush. looks like shit.
open short only if the price drops to 2485
open: 2845
first target: 1910
second target: 1597
Stoploss!!!!!: 2593
////////////////////////////////////////////////
open long with narrow stop loss when the second target reached
open long : 1600
Stoploss: 1513
first target 2080
second target 2150

ETH Short SetupThis setup valid if only daily candle closed below 2834.08
ETH Short Setup
- Sell momentum
- Bad news tapering
Entry:
Sell market
Sell limit 2874-2927
Target:
TP1 2877.92 (If trigger sell limit)
TP2 2733.62
TP3 2500.13
Note:
Always do your research!

4H Bearish ETH This is a late idea call, ETH brokeout short @ 3188.34 and is now retesting the breakout. Stoploss @ 3295.00 Take profit @ 3045.


ETH Entries . . . Short?Possible entries for Long & Short
Low Vol. Looking more short!
What do you think?

Make some Monet! Painting ETH on a 3x Short....These handy little coins, available in many exchanges help you to "short" a major coin without having to go through the complications of leveraging and borrowing. For example, this coin, available in the Kucoin exchange moves three times the percentage of ethereum in the opposite direction. So, go long on short..... If that makes any sense. This is similar to shorting the actual coin with 3x leverage.
Right now you don't need to draw any fancy lines... or do some sophisticated analysis - as the market direction is pretty clear at the moment....

ETHEREUM - ETH - Correction ahead! See targets in my analysis!Hello traders,
Here is a brand new analysis of Ethereum.
It has been exactly 18 hours since I wrote that the target of 4000 usd would be met within a few days but it has already happened!
Congratulations with Ethereum and the 4000 reached level!
What is next now?
We are seeing now many divergences on multiple time frames among others in the MACD, RSI, STOCHASTIC.
We are also forming a DOJI on a daily basis but the daily candle has not yet closed so it is not confirmed.
You can see also a bearflag. These factors and the 4000 level which make me expect a correction.
To be more precise, I expect a pullback now to the levels 3500 usd, 3200 usd and 3000 usd. 3000 usd seems to me the ultimate buying moment but probably everyone is too negative and thinks it will go even deeper. I will wait with patience anyway because my style is buy low (with a discount) and sell high with nice profits!
Right now I am short Ethereum with a stop at 4060 and first target at 3500 usd. Is my stop hit than I had a very small loss but a very good Risk reward!
I will turn bullish again if we break all time high and come back with a RE-TEST of that level.
My buy order is already placed at 3050 USD with a stop at 2790 USD and a target of 4000 USD.
This is my own personal view on Ethereum and not investment advice. Always use your money management and stops when trading.
Have fun and trade safely!
See also the related posts from Ethereum because they are very useful!
If you guys appreciate my posts it would be great to follow and like me! It motivates me to continue with these analyses!

Short ETHSorry but after a 3.618 extension to break all time highs (USD), then get rejected at such a round/even number like $2000, I'm not cool with a small correction. This bad boy needs a nice drop. I'm still looking for a cup and handle on ETH, and a giant explosion this year. Just, not yet.
Follow this chart, follow me, hit the like button and tell me your thoughts! Thanks!

Now no One talk? Ahahah I see a lot of trash talk. Eth Will reach 1500 before.
U noob. Quit TA. Some bad thing when i was not disturb no One.
Precision and strategy that lead to win, not talk trash without reason.
So now where are u haters? 😂🙏😉


Where Is volume? 😂😂Ok, trying to update signal fast due to lot of appreciate and attention i received 🙏🙏💘
Like i told seems to create a lot of fake out to make people fomo another time.
I repeat that if trend line Is not broken with huge volume we can assume a false break. After that It Will show the bearish pressure cause big buyers than didnt let price go down Will be the First to sell 😉
If break and retest of before HH we can valutate to take long with stop at open.
Hope u enjoy and comment and Like 🔥🔥
Follow me cause if i reach 100 follower i Will start making more accurate explication of signal :)
