Shortgold

According to my simple analysis of the gold market,According to my simple analysis of the gold market, we expect a continuous decline.
Since july 2019 the "the precious metal" respected the support zone .... this week unfortunately we went down with brutality on daily close . gold is supposed to make a pull-back move and go down on next weeks ... bullish move depends on good federal news + china / russia decisions .

Lifetime Opportunity Short on XAU/USDGold just broke a major key level it's been holding for the last 2 and a half years. With such a strong piece of structure broken and failed to reclaim from the retest, clear signs that Gold has a strong chance of heading to it's next 2 major levels below.

XAU/USD SHORTxauusd it seems like wh are going to get a short trade on 5m-15m timeframe. as wee see in this channel we draw there is tauch on upside with bearsh market with some of triangle channel to break it over as wee have on macd in 5m so there we are looking to get short trade after breakout triangle to down till the aim at 1676 or 1680 maximum.....

Revisit 16xx Area Again For Gold?Sudden spike of gold yesterday just didn’t impress the bullish party(at least I am one of them who didn’t impress). So in my opinion this time gold has good chance to break below 1700 area again or at least test 1711 price. I prefer to put pending order to sell around the area I have defined s selling zone. My personal target profit zone is somewhere around 1677-1685. And overall trend is being showed by ichimoku is bearish.
Trade well and wisely.

GOLD SILVER RATIO as a guide for TRADING DECISIONSCenturies ago when the gold and silver standards existed the Gold to Silver ratio was
fixed at 15. Decades ago the ratio was 55. The US dropped the gold standard in 1971
( Thanks Richard Nixon ?) In floating since then, the ratio in modern times has been 75/
It can be said that below 75 gold is undervalued in comparison with silver while
over 75 it is overvalued in comparison.
At present since April 15th ( IRS demand tax returns and payments) the ratio has
consistently risen.
Trading Ideas from this:
Traditionally, an investor would now sell gold and buy silver at a ratio of 75 to 1
meaning sell quantity of gold for instance 5 ounces and then buy 375 ounces of silver
with the proceeds.
Using the XAUUSD and ZAGUSD, a swing trader would short sell spot gold
and go long on spot silver.
An options trader would buy a put contracts in a gold junior miner stock and
then hedge with call contracts of equal value in a silver junior miner stock
The above, are basic examples of how to use the gold to silver ratio as a basis
in trading decisions. The link below is a more detailed explanation of this.

Gold short!!The market bounced on a key level, and on the smma 201, with a pattern of counter trend.

XAGUSD SWING SHORTSpot Silver has been in a general downtrend albeit it with a short rally.
On the weekly chart the context of the rise in the stochastic RSI to over 60
and the MACD approaching a K and D line touch as well as the print
of a weekly candle as a red Doji after the recent federal minutes release
and another federal calendar event on 8/22 I will take a short on spot silver.
The stop loss will above the POC of the high volume area on the profile
or $20.2 for a $0.4 less while the target will be just above the recent
market low on July 11th at $18.15 ( green horizontal) for a profit of
$1.65 per . This makes for a reward to risk of about 4.

IMPORTANT GOLD Update: +180 Pips Congratulation To Who Entered This Is An Educational + Analytic Content That Will Teach Why And How To Enter A Trade
Make Sure You Watch The Price Action Closely In Each Analysis As This Is A Very Important Part Of Our Method
Disclaimer : This Analysis Can Change At Anytime Without Notice And It Is Only For The Purpose Of Assisting Traders To Make Independent Investments Decisions.

GOLD SHORT SETUP ?OANDA:XAUUSD
From the 1000R char, I am thinking about taking a short trade
with a stop loss of $1808.25 above the high on 8/10
and a target just above the volume profile POC at
$ 1788. Given an entry price of $1802
risk of $ 6 for a reward of $ 14 ( 2X).
Please comment offering me your opinion. Thanks!

I Am Going To Wait For This To Sell GoldI am going to wait for gold to breakout from the lower trend line to sell gold. H4 macd also supports the short position I am planning to take. If the break out happens with bearish engulfing this would provide momentum for gold to go downside...

SELL GOLD @ 1794Price has reached a very strong Resistance Zone .
A Pin Bar rejection into that zone on the One Hour (1H) Timeframe has already occurred.
On the 15 minutes (M15) Timeframe, it is a bearish engulfing .
SELL GOLD NOW
Stop Loss = 1804
Take Profit = 1780
PEACE

SELL GOLD @ 1794Price has reached a very strong Resistance Zone.
A Pin Bar rejection into that zone on the One Hour (1H) Timeframe has already occurred.
On the 15 minutes (M15) Timeframe, it is a bearish engulfing.
SELL GOLD NOW
Stop Loss = 1804
Take Profit = 1780
PEACE

Gold weekly chart broke down and headed lower.Gold weekly...The huge bull pennant has been
broken now...it seems it will head down to the
red consolidation box and the RSI should reset
and begin to make the next move up. The MACD
is still not bottoming out either. Price targets
and support lines are still intact.

shortreally bad news for gold!! really sad.. so i am expecting 1700-1600 for gold, hedge against inflation , i dont think so!!!

What Is Next for GOLD: Could We See It Rallying Again ? 📈1- Market Overview:
As it is clear from the screenshot above the market is moving upward where the price managed to break a series of highs month after month. The rally started in December 2021 and then a huge drop was left on March 22nd to the 1900 USD mark. From this zone, Gold failed to break the previous high around the 2000 USD mark and posted a lower high showing weakness from the buyer’s side.
2- Long Scenario:
The long scenario is our most likely scenario for this analysis since the market is traded to the upside, the odds of a long trading idea is much more likely to occur. The market as we can see is respecting the bullish trendline and it’s held by the buyers around the 1915 USD support zone. So, what most probably will occur is a move to the upside to test the previous high near the 2000 USD mark and then if the buyers are strong enough, we could see GOLD reaching the previous swing high around the 2071 USD level. However, we must highlight that the price posted a lower high after reaching the 2071 USD mark, which is an indication that the sellers might take control of the market in the coming days. Let’s move to discuss the short scenario where the reversal might occur, and we could see a huge drop in price of GOLD.
3- Short Scenario:
The least likely scenario for this analysis is to see the GOLD reversing and move lower. As we mentioned in the previous paragraph, the yellow commodity posted a lower high which is a weak indication for the buyers. But this doesn’t mean that the market will reverse anytime soon before seeing a certain price action that we are going to discuss now. To see this particular reversal and a move to the downside, we should wait until the market breaks the support level around the 1915 USD mark and close below it. As well, another breakout we wanted to see is a breach of the bullish trendline to the downside. If these two movements occur this will lead to a huge move of the GOLD to the downside all the way to the 1800 USD mark.
Financial Disclaimer:
Please do you own research before investing/trading any asset. This article is for educational purpose. It might help you to have a different view of the market and learn from the way an expert see the market. But at the end you should know which trading ideas fit your personal analysis.
Have a happy trading day. 🙂

GOLDThe gold has just made a change of character. Not possible future increase. But before he has to go get his request area where I put the tp for a second confirmation.

GOLD Bearish reversal on horizon?Price hasn't managed to break resistance area around 1960 and bounced back down. Yesterday, we saw price has broke down the rising flag pattern. For me, price is heading back to below 1900 once again. Lets see

Daily resistance is broken. . Head And Shoulders on the 1-Hour?Hi Traders,
Hope you have all had a great week.
We’re just having a look at gold to try and see if there is a potential setup forming for next week.
We have broken through the daily resistance at 1879. We have seen very strong bullish volume which helped push us through that zone.
Since then, we have had no retest down to that price point so it technically has not been flipped to support yet, as such. Does it need to? Not necessarily.
If we look at the 1-hour time frame, we might be setting up for a potential head and shoulders that could send us back down to retest that 1879 area and perhaps even go through it again.
We see here that volume is also decreasing indicating a potential move soon.
I don’t like taking any setups around strong Support and resistance zones. Things can be volatile. I would prefer to wait this out as it is a Friday as well, and then see what next week brings. There’s no rush jumping into a trade just because.
If you want to look for a short position, this could be something that could be interesting to you.
So let us see what the day brings and as always, if there is anything that starts to form, I will surely be posting it. Hope you all have an awesome weekend.
Vortex

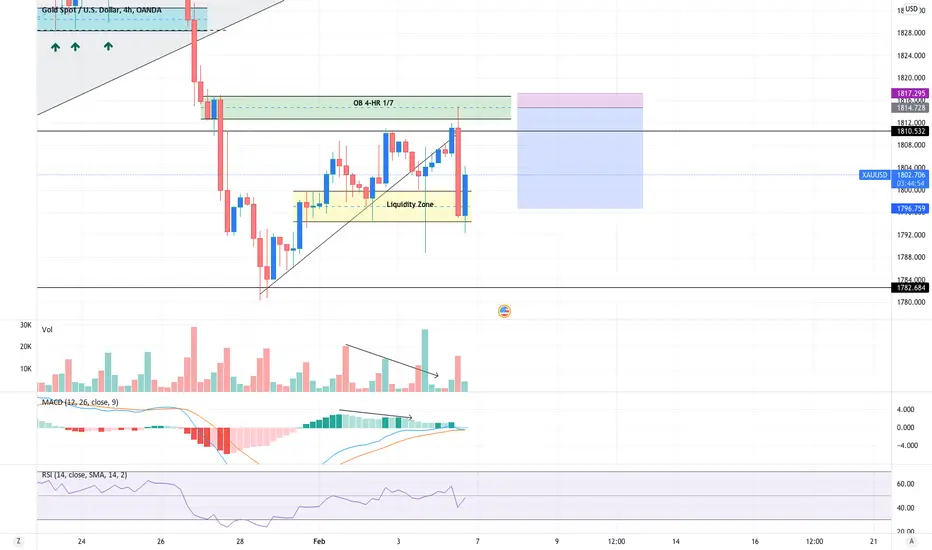
4-Hour Order Block Madness On Gold!It’s NFP Friday today.
You know what that means—volatility Volatility Volatility.
I always avoid staying out of the markets on NFP day but let’s still look at what gold did today.
We are on the 4-hour chart.
I have marked up an order block, as you can see on the chart. An order block is an area of interest that market makers use to access extra liquidity, which they can then use to push the price higher or lower. I’m the case of going short; I would always use the most recent bullish candle before an impulse lower. As we can price came right into the order block before dropping lower.
This is what sniping is.
I don’t usually trade order blocks on the 4-hour. However, this one was too good not to show.
If you were looking to short Gold ( XAU ), You would have opened a short position in the middle of the OB. This is always a safe play. Put your slightly above the OB High, and your target would be the liquidity zone. This would have given a nice 1/7 RR.
Order block sniping requires much backtesting and creating your own set of rules – just like any other strategy.
This is a textbook example of how price returns into the OB zone to collect liquidity before moving lower.
Interesting? Yes,
Would I trade this on NFP day? No
Let’s keep watching and see if gold can present us with any setups next week.
Have a good weekend, traders.
SELL XAUUSDSell gold, further drop expected today. Equal drop as experienced this week. Use proper money management.

XAUUSD 3 DAY CHART I think we are in the b wave , soon we will see some harder crash in gold xauusd , we need to reject from 1830dollars level and should close below 1800 for 2days for confirmation of this trade

short goldexpecting wave c of 4 to move to at least 38.2 of wave 3. hence after the forming of wave c of 4, we are going to short gold
