Shorting ARKMUSDTShorting from 0.44 with initial Target 0.4 then will update rest of 75% . SL is last 0.5
Happy Selling
Shortsell

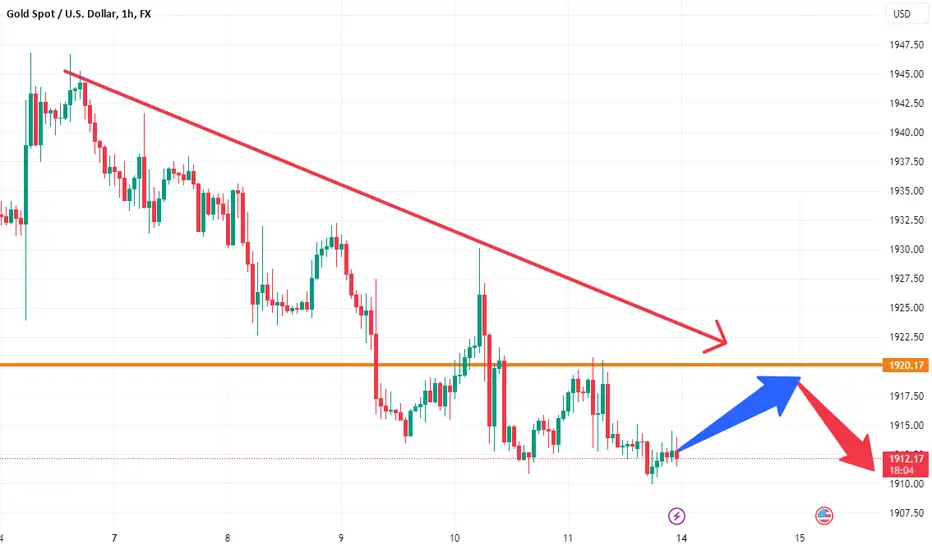
Gold 19-20 short; continue to short unchanged
Gold fluctuated slightly on Friday, with no intention of breaking through. After four consecutive days of decline, this move was unexpected. We had expected a new round of decline on Friday, but after all, it did not It can come true. Fortunately, since this wave of decline, the possibility of a later breakout is very high, and the sideways fluctuations in the small area are also brewing for the next wave of market prices. The transformation of space will further strengthen the later actions, and the current pressure on gold is maintained at the 20-line. On the one hand, this position is the top-to-bottom transition in the previous period, and it is also the high point on Friday, and it is also the suppression of the daily short-term moving average. At the mouth, it is difficult to break through this position when the short position is established. However, in the near future, during the continuous downward process of gold, it will be gradual and at the same time, it will still accelerate when the energy is exhausted in the later stage, then the first target below If it breaks below 1900, you can continue to look at the position around 1870-1850. Next Monday, we will short around 19-20 for gold, and the target is around 10-05
AUDJPY Enjoy big downtrendHi everyone,
Get ready,
Identify market strategy. Place order. Goal profit for smart investment.
Market downtrend best time to earn good profit.

Minefield ⛏️💥The VanEck Junior Gold Miners ETF (ticker: GDXJ) has entered a certain minefield here. Our short-trade target zone has already been dealt with and the corresponding high of the turquoise wave (ii) was placed accordingly within said zone. We are now anticipating further impulsive sell-action in accordance with the general bearish trend. If the bulls want to start another comeback though, they should’nt be able to increase the price beyond our still active second sell zone (between $39.33 and $41.67).

Doji, Hammer, Pinbar and 7 Divergences ; Right after anotherSeems like there is a short-term dump incoming;
Weekly timeframe RSI divergence made exactly
under the '"May 2022"' resistance and the 0.5% Fib level ,
And there is 3 confirmative candles. Pinbar candle had made last week ,
a Hammer and a Doji candle had made 2 and 3 weeks ago.
If we make a daily candle closed under 30K ,
28K would be the next major support for BTC ,Even 25K after that . (my opinion)
Also all of the 3day ,daily ,12H ,8h ,6H ,even 4H had made RSI divergence.
I'm Bearish on BTC

EURCHF - BEARISH - 1H EURCHF - BEARISH - 1H
TRADE PLAN
Entry Price (Sell Stop) : 0.973360
Stop Loss : 0.975910
TP1 (1:1) : 0.9708
TP2 (1:2) : 0.9683

XLM STELLAR SHORT SETUP 2hXLMUSDT (#STELLAR) seems is prepared for correction along with BTC. So, I think we can short it after a small recovery. DYOR. NFA. Lets see what happens.

GOLD 19/6 @ Downtrend prevailsThe price of gold (XAU/USD) is currently being affected by negative market sentiment towards China and concerns about the Federal Reserve (Fed). It is currently trading near its lowest point of the day, around $1,955 in early Monday trading in Europe.
Recent news about several banks lowering their growth forecasts for China has dampened investor appetite for risk and put downward pressure on the price of gold. Additionally, comments from Fed policymakers that lean towards a more hawkish stance, along with the latest report from the US central bank to Congress, have also influenced the XAU/USD price.
It is also because of pressure from bad news from the world. Gold price has not been able to break through the Break out area of $1968, it is still trending down this week, June 19, 2023
Entry Short $1968 -$1970 , Buy zone $1943 - 1940
Use the technical analysis indicator strong resistance point at $1968 combined with the moving averages MA34 and MA89 , for a nice entry point .

BOO Short Sell (Circa 7-8%)BOO Short Sell based on equilateral triangle pattern within levels of resistance. Breakout will favour bearish. TP 37.45 based on previous resistance levels.

I see GBPAUD retracing before it shootsI'm seeing that on the weekly GA broke WR and now I'm waiting for price to retrace back and then on Daily I already have a bearish candle which makes me scale down to 4h and I'm seeing a possible BoS happened price failed to break previous HH and now waiting for a Break and retest of the range for a SHORT TERM sell and then find the major buy when price fully retrace and BoS on the H4

GE Short? Someone tell me what's up with GE! Would love to see some opinions. Looks like a short to me.

DOTUSDT-1H-TREND REVERSALDOTUSDT is breaking trend here just broke rising wedge, there is also diversion on RSI index this might be the sign of bearish trend now own ward

Btc shortBtc try to create wedge 👍
in D1 we have Rsi Divergence and Btc was Rejected by weekly supply zone

XAUUSD (Gold spot) BEAR Power in 1845GOLD bear entry is strong in the 1845
with a short term Target 1835 / 1830

Gold: Anticipate temporary correctionA notable impulsive movement has been observed in the gold market, with the price surging from 1808 to 1831.
My technical analysis suggests that the price has entered a profit-taking zone, which could prompt buyers to offload some of their positions before resuming their purchases. Consequently, there is a possibility that the price could experience a temporary decline to the 1824-1820 range, or possibly lower, before the bullish trend continues.

NAS100 Short~Looking for a drop after a retest of the previous support lvl that was broken. noting looking back u can see it being a resistance lvl that was turned into a support lvl Im only looking to short till the nearest support area which would be on the 11,900 mark but this is a practice test of my own strategy or trade style I'm trying to build. so (DEMO Trade)

UJ Looking for bearish movement to the downside 02/23/23$USDJPY -Looking for bearish movement to the downside after top down analysis.
Looking for a retest at my POI lead to this bias.
Good luck!
The information and publications are not meant to be, and do not constitute, financial, investment, trading, or other types of advice or recommendations supplied or endorsed by TradingView.

USDJPY is in Bearish modeUSDJPY is at HL now and going to make LL
Sell at 133.990
TP 133.634
SL 134.250

Going Short on GBPAUDPound continues to lose its ground against Aussie as the bearish rally in the pair continues. Sellers should aim for buying on dips strategy as strong rejection from previous higher low, and a bearish divergence shows bears are still in control.

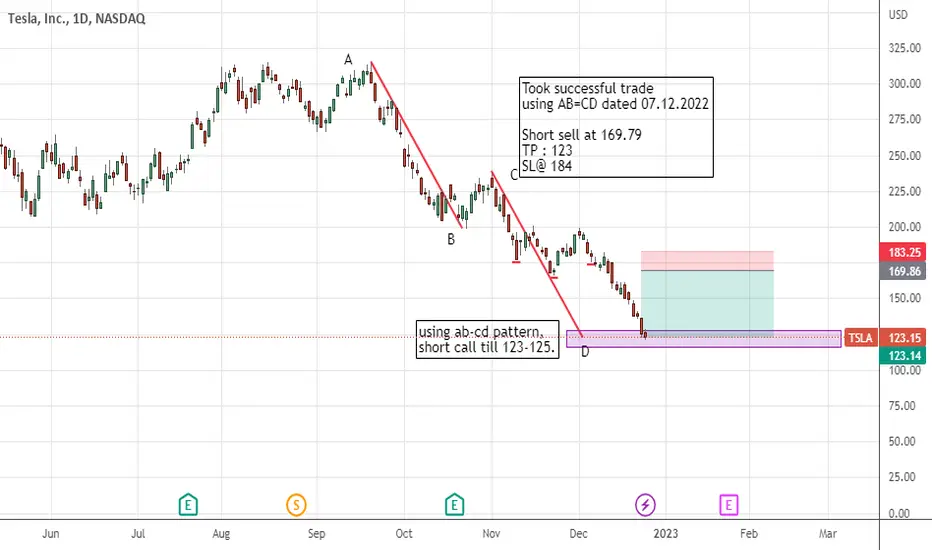
TESLA DAILY CHART Tesla Short Sell
Using AB=CD dated 07.12.2022
Short sell at 169.79
TP : 123
SL@ 184
Will need further confirmation for confirmation
Eth - intraday trading If the upward trend continue, we should consider possible sclap trades.
Short entry: 1231,56
Stop loss: 1234
Tp1: 1226,68
Risk reward: 1:2


EURGBP - Trade SetupHello Dear Fellows , how are you , hows going your trading , in todays Trading Session i am not much expecting from any pair , or you can say i am not feeling confident as Currency Pairs are not align yet properly , I chose EURGBP pair for todays trading session as it has room to move further downside and it has good Risk Reward too ,
Anyways , Trade with Strict Risk Management do not excited ever !
Best Of Luck !
( i Keep Updating Trade idea whether its going good or not , so keep your eyes on updates if you are following this idea )
