Gold prices recover - consolidating below 5180⭐️GOLDEN INFORMATION:
Gold price (XAU/USD) attracts some sellers near $5,035 during the early Asian session on Tuesday. The precious metal edges lower amid improved risk sentiment and some profit-taking. Traders brace for key US economic data later this week, including delayed employment and inflation reports.
The yellow metal retreats after rising over the previous two days, as traders returned to equities on improved risk sentiment. The S&P 500 extends the rally to near its all-time highs following a volatile week. Additionally, hopes for the United States (US)-Iran negotiations could undermine a traditional asset such as Gold. Iran’s President Masoud Pezeshkian described the Friday nuclear talks with the US as “a step forward,” even as he pushed back against any attempts at intimidation
⭐️Personal comments NOVA:
Gold prices are stable, trading sideways around 5000, consolidating below resistance levels of 5080 and 5182.
⭐️SET UP GOLD PRICE
🔥SELL GOLD zone: 5180 - 5182 SL 5187
TP1: $5160
TP2: $5140
TP3: $5120
🔥BUY GOLD zone: 4903- 4901 SL 4896
TP1: $4920
TP2: $4940
TP3: $4955
⭐️Technical analysis:
Based on technical indicators EMA 34, EMA89 and support resistance areas to set up a reasonable SELL order.
⭐️NOTE:
Note: Nova wishes traders to manage their capital well
- take the number of lots that match your capital
- Takeprofit equal to 4-6% of capital account
- Stoplose equal to 2-3% of capital account
Shortsetup

BTC Zoomed In - Flash Crash Short OpportunityFor those who have followed my bitcoin analysis you likely have conviction now that I wasn’t predicting this out or my butt.
Here is a more local opportunity to short a flash crash - incoming on Bitcoin
For this trade to be valid - we would not rise much higher than the second entry level of 73,280
Hence the short has two entries
Entry 1 - 69,400
Entry 2 (DCA) - 73,200
Stop Loss - 75,300
Targets:
1) 57,200
2) 47,500
3) 34,800 (Close 50% here)
4) 19,400
5) 7,300 (likely bottom one)
6) 4,000 (likely bottom two)
Personally I’ll close 100% at 10,000 and look to buy in between target 5 and 6
Don’t miss this opportunity - you’ll be disappointed if you weren’t prepared.
- DD

Gold prices recover - wave A around 4900Related Information:!!! ( XAU / USD )
Gold (XAU/USD) maintains a modest intraday upward momentum during the early part of Friday’s European trading session, although it continues to trade below the $4,900 level amid conflicting market signals. A shift in global risk appetite has prompted investors to seek safe-haven assets, providing support for gold ahead of the upcoming US-Iran nuclear negotiations. In addition, expectations of further interest rate reductions by the US Federal Reserve in 2026—strengthened by indications of softness in the US labor market—also contribute to underpinning demand for the non-interest-bearing precious metal.
personal opinion:!!!
!!!!!! Gold prices recovered in a wave A, continuing to consolidate and trade sideways around 4900-4800.
Important price zone to consider : !!!
Resistance zone point: 4901 , 4942 zone

BTC | The Calm Before the Dump... or Pump?Bitcoin is reacting from a key higher-timeframe point of interest (POI). Price has reached a high-probability FVG that broke structure to the downside with strong displacement — now forming a potential short-term ceiling.
Below, a notable sell-side liquidity pool sits near $74,558, offering a possible downside target if price continues to respect this daily FVG. Should that level give way, the next POI would be the marked bearish order block, with extended liquidity zones reaching toward the $52K region.
If both sell-side areas are taken out with strong momentum, it could confirm a deeper re-price phase before the next bullish leg.
Overall, we’re watching for how price responds within these key levels — structure will tell the story.
Disclaimer:
This analysis is for educational purposes only and does not constitute financial advice. Always do your own research (DYOR) before making any trading decisions.

EURGBP - Bearish Channel Suggest Price Is In A DowntrendPrice was in a rising channel (bullish phase), then broke down and formed a falling channel, repeatedly rejecting the same resistance zone.
That resistance area and the bearish channel now suggest EUR/GBP is in a downtrend, so the chart is signaling to look for short entries near that highlighted resistance zone.

Selling pressure on gold is following the trend line.⭐️GOLDEN INFORMATION:
Gold price (XAU/USD) tumbles to around $4,680 during the early Asian session on Friday. The precious metal extends the decline as traders cover losses from equities and adjust positions. The preliminary reading of the Michigan Consumer Sentiment Index report for February is due later on Friday.
The Chicago Mercantile Exchange Group (CME), the world's leading derivatives marketplace, has raised initial margin requirements for Gold and Silver futures contracts again, increasing the amount of collateral traders must post to open and maintain positions. Additionally, falling technology stocks have forced some traders to liquidate gold positions to meet margin requirements, exerting some selling pressure on the yellow metal.
⭐️Personal comments NOVA:
Gold prices are consolidating and moving downwards along a trend line, below 5000. Gold prices are consolidating and moving downwards along a trend line, below 5000.
⭐️SET UP GOLD PRICE
🔥SELL GOLD zone: 4940 - 4942 SL 4947
TP1: $4925
TP2: $4910
TP3: $4880
🔥BUY GOLD zone: 4653- 4655 SL 4648
TP1: $4670
TP2: $4690
TP3: $4715
⭐️Technical analysis:
Based on technical indicators EMA 34, EMA89 and support resistance areas to set up a reasonable SELL order.
⭐️NOTE:
Note: Nova wishes traders to manage their capital well
- take the number of lots that match your capital
- Takeprofit equal to 4-6% of capital account
- Stoplose equal to 2-3% of capital account

2026 THE YEAR OF THE BEAR Some people say the 4 year cycle is over...
I disagree
As you can see my 4 year cycle is right on target with PRICE rising shortly after YEAR 1 begins
And PRICE dropping shortly after YEAR 4 begins
As you can see YEAR 4 is marked RED due to the fact that this is the BEAR market year
Now this is a LONG term chart as you can see the TIMEFRAME is WEEKLY
Sorry BULLS but if you have not taken PROFIT yet I highly advise you too
I have applied my FIB from previous cycle LOW to this recent cycle HIGH
With an 80% correction that would put us around 38.8k approximately
Lets check back towards the END of the year and see where PRICE is :)

Pull Back is RequiredAMZN Sell Setup - GETTEX:AMZ
Bearish Momentum on Daily Chart
Instrument: AMZN
Timeframe: Daily
Direction: Sell
Confidence: 75%
Setup Overview:
AMZN is showing bearish signals after a recent pullback. MACD has a bearish crossover, and RSI is overbought at 61.25, indicating potential for a downward move. VIX is rising, and 10-year yields are increasing, adding to market pressure. Social sentiment on X is mixed, but news sentiment leans bearish.
Trade Details:
Entry Price: $198.82
Profit Target: $182.23 (~5% downside)
Stop Loss: $205.61 (2:1 risk-reward ratio)
Position Size: 4% of portfolio
Expected Move: -5%
Key Indicators:
MACD: Bearish crossover
RSI: Overbought at 61.25
Market Context: Rising VIX, increasing 10-year yields
Follow for Best AI Signals on the market

BTC On The Big PictureFrom a technical perspective, Bitcoin suggests that a deeper pullback may occur. This is because it has recently formed three higher highs, and historically BTC often retraces 50% or more after this type of pattern. However, the fundamentals remain very strong, so we may need additional confirmation on the daily time frame.
This is not financial advice.

AMZN Wait For The Crack!This is a complete structure with 4 points, 3 waves, and a hook revealing a rising wedge.
The first mini-crack has already taken place.
The structure is all set up, valid, and ready to crack! All you have to do is wait.
🚨CAUTION! To all the bulls!
If you enjoy the work:
👉 Boost
👉 Follow
👉 Drop a solid comment
Let’s push it to 6,000 and keep building a community grounded in truth, not hype.

USDJPY - Short Trade (Swing)USDJPY - Short Trade (Swing)
1. Bearish Divergence
2. Short at break of previous Higher Low
Entry Point: 156.296
SL: 157.433
TP: 155.315
Account Size ~ 10,000
Lot Size ~ 0.3
Amount on Trade - USD 100 (1%)
Profit / Loss - 1:1

BTCUSDT: Bear Flag in Play – Sellers Remain in ControlHello everyone,
what’s your view on BINANCE:BTCUSDT ?
BTCUSDT is losing bullish momentum and entering a high-risk phase, with both macro fundamentals and technical structure leaning toward a bearish scenario.
On the fundamental side, the crypto market is facing dual pressure. First, a stronger U.S. dollar and elevated U.S. Treasury yields are pulling short-term capital away from risk assets like Bitcoin. Second, expectations that the Federal Reserve will not rush into monetary easing continue to create an unfavorable backdrop for crypto. In addition, market caution is rising as large funds slow deployment and prioritize cash amid ongoing uncertainty.
From a technical perspective, BTCUSDT experienced a sharp sell-off, followed by a weak recovery that has formed a Bear Flag pattern on higher timeframes. This is a classic bearish continuation structure. As long as price continues to be rejected at the upper boundary of the flag, sellers remain in control, opening the door for further downside toward deeper liquidity zones.
👉 My personal view:
I expect BTCUSDT to continue moving lower.
What’s your take on the market? Share your perspective in the comments.

Potential 7X on USDJPYUpon a confirmed structural shift to the down side, price is retracing into a supply level that should be sufficient to drive the market lower and fill the imbalance at 148.37.
With this in view, I am looking to short from 157.30, with an invalidation level around 159.23, targeting 148.00.
This setup presents a potential 7R reward if executed with confirmation.
I will keep here updated
Trade Safe.
Patience is the Way! Ieios

Nifty Bank Index – Technical View: Bearish / Corrective Risk EmeThe Nifty Bank Index appears to be in the final stages of a five-wave advance, suggesting potential exhaustion at higher levels. The latest session has formed an Open–High candle, indicating strong supply pressure and the development of a near-term resistance zone around current prices.
From an Elliott Wave standpoint, the completion of the fifth wave raises the probability of a corrective or impulsive decline unfolding from the recent highs. With momentum showing signs of fatigue, downside risk is now increasing.
On the downside, immediate support is seen near 57,700, followed by 54,700. A deeper corrective phase could extend towards 53,050, which aligns with prior swing structures and broader price projections.
The bearish view stands negated on a sustained move above 61,765, which would invalidate the current wave count and reopen upside potential.

Muthoot Finance Ltd. – Technical View: Bearish BiasThe stock has completed a five-wave advance, following which price witnessed a sharp corrective decline, indicating exhaustion at higher levels. The subsequent rebound retraced up to the 50% Fibonacci retracement, where price faced selling pressure near the Open–High zone, forming a strong supply area and reinforcing resistance around current levels.
From an Elliott Wave perspective, the initial decline can be interpreted either as Wave A or Wave 1. The retracement that followed fits the structure of Wave B or Wave 2, and price action now suggests the beginning of a fresh impulsive leg lower, identified as Wave 3 or Wave C. Confirmation will evolve with price development, but the structure currently favours downside continuation.
Based on price equality projections, the downside objective for the ongoing leg is placed near ₹3120. In case of truncated Wave C, target comes at ₹3350
The bearish view remains valid as long as price stays below ₹3800 on a closing basis, which acts as the negation level for this setup.

Accumulation around 5000 - gold price⭐️GOLDEN INFORMATION:
Gold price (XAU/USD) jumps to around $5,005 during the early Asian session on Thursday. The precious metal rebounds following a period of intense volatility. Traders weigh the next round of US economic signals and the broader demand for safe-haven assets.
The rally of the yellow metal is bolstered by a safe-haven demand after the US military shot down an Iranian drone that "aggressively" approached the USS Abraham Lincoln aircraft carrier in the Arabian Sea, sparking fears of US-Iran escalation. Iranian and US officials confirmed on Wednesday that talks between their countries would be held in Oman on Friday. Traders will closely monitor the developments surrounding the negotiation.
⭐️Personal comments NOVA:
Gold prices are consolidating around the key 5000 mark, with the market stabilizing after a recent sharp rise and significant profit-taking.
⭐️SET UP GOLD PRICE
🔥SELL GOLD zone: 5281 - 5283 SL 5288
TP1: $5260
TP2: $5240
TP3: $5220
🔥BUY GOLD zone: 4745- 4747 SL 4740
TP1: $4760
TP2: $4785
TP3: $4806
⭐️Technical analysis:
Based on technical indicators EMA 34, EMA89 and support resistance areas to set up a reasonable SELL order.
⭐️NOTE:
Note: Nova wishes traders to manage their capital well
- take the number of lots that match your capital
- Takeprofit equal to 4-6% of capital account
- Stoplose equal to 2-3% of capital account

AUDCHF - Price In A Clear Long‑Term DowntrendThe chart shows AUDCHF in a clear long‑term downtrend inside a bearish descending channel on the weekly timeframe.
Price is now rallying back into a marked supply zone that aligns with the channel’s upper trendline, so the idea is to watch this area for rejection and then look for short setups in line with the prevailing bearish trend.

EURJPY - Market is at Overbought Zone, Expecting Correction..!The image provided is a forex trading chart for the EUR/JPY currency pair, illustrating a technical analysis strategy.
The analysis identifies a "daily resistance" level where traders are advised to "look for shorts" (sell positions), anticipating a price decline.
Technical Analysis Overview 📊
Currency Pair: Euro / Japanese Yen (EUR/JPY). 💴
Strategy: The chart highlights a resistance level (the upper horizontal line around 185.5 JPY per Euro) where selling pressure has historically increased.
Actionable Insight: The text "LOOK FOR SHORTS" suggests implementing a trading strategy to profit from an expected downward price movement, often used when a market is considered overbought. ⬇️
Market Context: As of recent data (January 2026), the EUR/JPY pair has been trading near record highs, with some analyses noting potential bearish divergence in technical indicators, which could support the short-selling idea. ⬇️

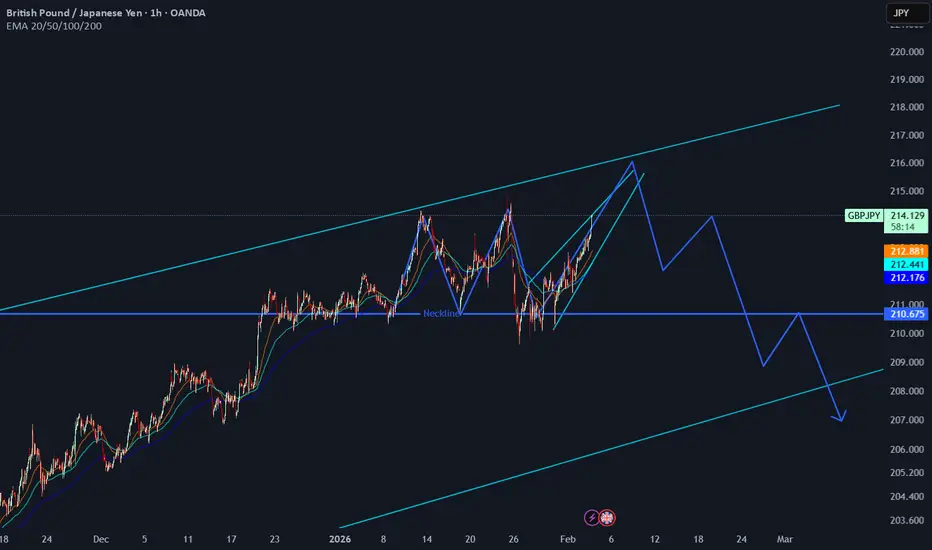
RegimeWorks Context Note (GBPJPY • 1H) — Scenario MapPrice printed a clear double-top structure, broke the neckline (~210.675), and then retested that level. The key detail: after the retest, bear follow-through failed — price did not sustain acceptance below the neckline. Instead, it rotated back up and is now squeezing higher inside the broader rising channel, pressing toward the upper band.
What I’m watching next (permission-first)
Context: Rising channel remains intact; price is compressing into the upper boundary (higher-risk area for late longs).
Trigger: I want to see rejection at/near the upper channel band (momentum stall + bearish reaction).
Confirmation: A clean rejection sequence (e.g., bearish displacement / breakdown from the squeeze structure), then a retest that fails.
Execution idea: Only after confirmation I’ll consider a short position, targeting a mean rotation back toward the channel interior (and potentially the lower band if momentum expands).
Invalidation
If price accepts above the upper band and holds, the short idea is invalid — that’s continuation, not rejection.
This is not advice and not a prediction — it’s a RegimeWorks-style scenario map based on current structure and location.
BTC Short Running with 1:3RRBTC Short Running with 1:3RR
Loving this BTC Short so far. Actual target is around 74-75K.

Gold prices recover above 5100.⭐️GOLDEN INFORMATION:
Gold price (XAU/USD) trades in positive territory near $4,985 during the early Asian session on Wednesday. The precious metal extends the rebound after a historic and volatile sell-off last week. Traders weigh the next round of US economic signals and the broader demand for safe-haven assets.
CNBC reported on Tuesday that the US military shot down an Iranian drone that "aggressively" approached the USS Abraham Lincoln aircraft carrier in the Arabian Sea. The incident occurred as tensions in the Middle East are high, with US President Donald Trump weighing potential military strikes against the Islamic Republic.
⭐️Personal comments NOVA:
Gold prices recover - buying pressure returns. The market is gradually stabilizing and consolidating more around 5000.
⭐️SET UP GOLD PRICE
🔥SELL GOLD zone: 5253 - 5255 SL 5260
TP1: $5230
TP2: $5210
TP3: $5185
Note the minor resistance zone around 5133-5138.
⭐️Technical analysis:
Based on technical indicators EMA 34, EMA89 and support resistance areas to set up a reasonable SELL order.
⭐️NOTE:
Note: Nova wishes traders to manage their capital well
- take the number of lots that match your capital
- Takeprofit equal to 4-6% of capital account
- Stoplose equal to 2-3% of capital account

Infosys Ltd. (INFY) – Technical View: SELLInfosys is currently trading at CMP ₹1656. The recent up move appears corrective in nature, as the price advance has unfolded in three waves without a clear impulsive structure. This supports the view that the rally is part of a counter-trend move rather than the start of a fresh uptrend.
From a Fibonacci perspective, the price retraced up to the 61.8% retracement zone near ₹1728, which coincided with descending trendline resistance and the Open–High area, creating a strong confluence resistance zone. The broader wave structure suggests that an ABC corrective pattern (zig-zag) has completed, increasing the probability of trend resumption on the downside.
Additionally, price equality projection stands near ₹1120, which aligns as a potential medium-term downside objective if the decline resumes. From a Fibonacci perspective, minimum target of ₹1300 is expected which is 61.8% of Wave A. Given the corrective nature of the prior rise, a similar magnitude down-move is now expected.
View remains negative below ₹1,730, which serves as a negation level for the bearish setup.

Godaddy's Weak Macro Market Structure lead DowntrendThis is an analysis of the Macro structure of Godaddy on 1 Month timeframe.
The current move is as clear as day. It is highly probable that we retrace back to the breakout of the consolidation range (Rectangle pattern).
Price action Bearish momentum is strongly indicated by January Large Bodied bearish candle.
With how weak the market structure is with no clear support levels above the Consolidation breakout level of around $87.00. It is likely we test Support here.
And that is why an important sign to consider is that of confirmation and test of support at breakout point. Sometimes even stall for a bit before continuing breakout. This is good characteristic of strong market structure created from health supply/ demand interactions.
The Uptrend to Godaddy's High of roughly $215.00 was a powerful move but an extreme one when considering market structure.
With the long consolidation or range bound movement of price action for around 5 years between $55.00 and $87.00. It really allowed for momentum to build up.
BUT sharp moves up without healthy pullbacks/ range bound movements/ signs of testing support along the way up in terms of market structure in the long run creates weak market structure.
Steady moves up with pull backs and less sharpness or vertically of the move, the better it is for the long term of the structure created by price action. You can think of support tests/ specific areas where price stalls or pull backs as safety nets. If price action (candles) don't linger or pull back safety net will not be created.
This is WHY we are seeing the same sharp Downtrend move as we did during Uptrend.
