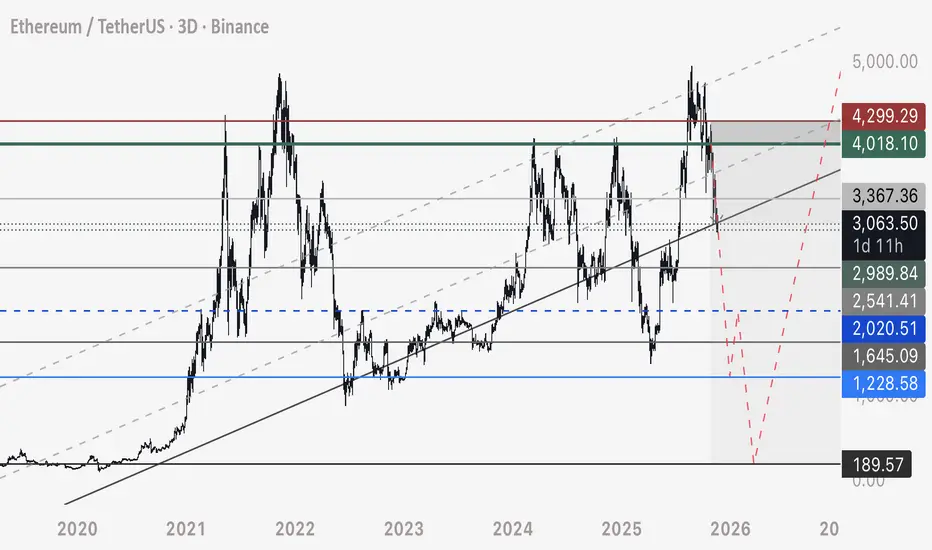
ETH - Short Update - Next Expected Moves ETH has been playing out this short beautifully since the high entry at 4,018.
Here are the next expected movements to complete this short, shown with solid blue lines and the red corrective path.
SHORT - 3,070 to target of 1,250
LONG - 1,225 to 1,250 entry - target of 2,000
SHORT - 2,000 to 2,020 entry - target of 200
BUY - 200-300
Expect this move to happen very quickly, and best to plan ahead.
Happy trading,
- DD
Shortsetup
BTCUSDT -- Is 98K a key level??BTCUSDT -- Is 98K a key level and we see another ATH or we already hit the top of this cycle?
I would like some insights from expert and experienced traders here.

BTC Short Running with 1:3RRBTC Short Running with 1:3RR
Loving this BTC Short so far. Actual target is around 74-75K.

continue to accumulate and wait for NF this week⭐️GOLDEN INFORMATION:
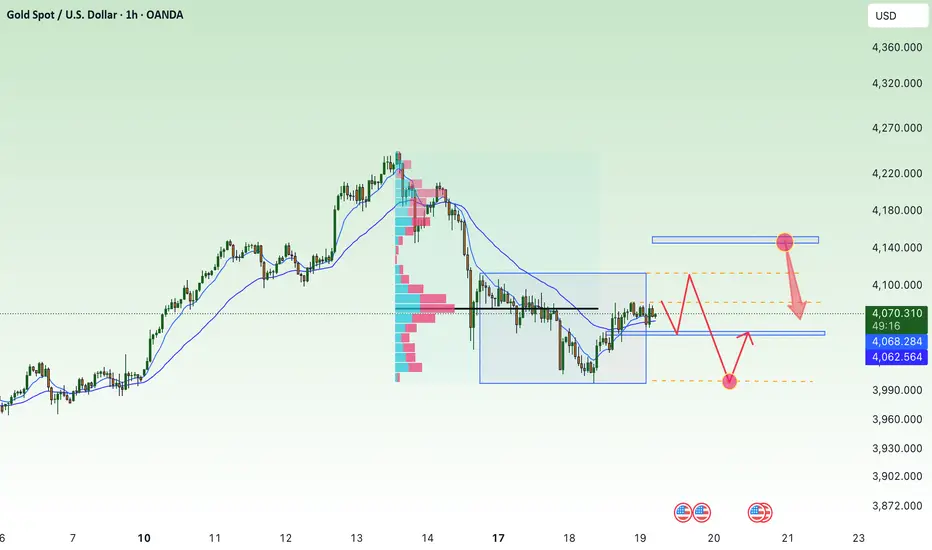
Gold (XAU/USD) climbs toward $4,070 in early Asian trading on Wednesday, ending a three-day losing streak as risk-off sentiment lifts demand ahead of the long-awaited return of US economic data. Traders now focus on the FOMC Minutes later today, followed by Thursday’s US September NFP report.
The September and October 2025 NFP releases were delayed by the US government shutdown, complicating the Fed’s rate outlook heading into its December meeting. This uncertainty could continue to support safe-haven assets like gold
⭐️Personal comments NOVA:
Gold price after returning to the liquidity zone of 4000, continue to accumulate below 4115 and wait for NF news this week
⭐️SET UP GOLD PRICE:
🔥SELL GOLD zone: 4112 - 4114 SL 4119
TP1: $4100
TP2: $4090
TP3: $4080
🔥BUY GOLD zone: 4000 - 3998 SL 3993
TP1: $4010
TP2: $4025
TP3: $4040
⭐️Technical analysis:
Based on technical indicators EMA 34, EMA89 and support resistance areas to set up a reasonable SELL order.
⭐️NOTE:
Note: Nova wishes traders to manage their capital well
- take the number of lots that match your capital
- Takeprofit equal to 4-6% of capital account
- Stoplose equal to 2-3% of capital account
Scalp SHORT – LIGHT🐻 Scalp SHORT – LIGHT
RSI on the 15m timeframe is extremely overbought and has formed a clear bearish divergence, signaling exhaustion in the current uptrend. Weakening volume confirms fading buying pressure. Price action is showing topping behavior, reinforcing the likelihood of a short-term correction.
🎯 TP: 1.2086
🛑 SL: 2.4231
📊 RR: 1 : 3.21

Scalp SHORT – XAN🐻 Scalp SHORT – XAN
RSI is extremely overbought across the 15m, 1h, and 4h timeframes, while a strong bearish divergence has formed on the 15m chart — a clear sign that bullish momentum is fading. Volume has also shifted, with selling pressure consistently dominating, reinforcing the likelihood of a sharp correction.
🎯 Trade Setup:
TP: 0.02636
SL: 0.05914
RR: 1 : 5.12
A high-conviction short setup: bearish divergence, multi-TF overbought conditions, and a definitive volume reversal.

Toast - ShortPrice Rejected From Major Resistance
The stock is sitting right below a heavy resistance zone around $38–40, which has rejected price multiple times in the past.
Every time TOST comes near this zone, sellers step in → clear bearish supply area.
2. Below the 50-Day Moving Average
Price is trading under the 50 SMA (blue line).
In downtrending or weak stocks, the 50 SMA acts as dynamic resistance, pushing price lower.
3. Lower Highs Formation
The recent bounce failed to create a higher high.
Instead, TOST is forming lower highs, which is a classic bearish continuation signal.
4. Failed Breakout Attempt
TOST tried to break above the resistance but got instantly sold off.
This is a sign of weak buying demand and strong sellers.

KHC Short 5M Aggressive Trend DayTradeAggressive Trend Trade
- long impulse
- unvolumed T1
+ resistance zone
+ biggest volume 2Ut+
+ weak test
+ first bearish bar closed entry
Calculated affordable virtual stop loss
Bought puts
1 to 2 R/R take profit
1H Trend
"+ short impulse
+ BUI level
+ resistance zone
+ 1/2 correction
- strong approach"
1D Trend
"+ short impulse
+ BUI test / T2 level
+ resistance zone
+ volumed 2Ut+"
1M Trend
"+ short impulse
= neutral zone 2"
1Y
Trend
no context

Scalp SHORT – XAN🐻 Scalp SHORT – XAN
RSI is extremely overbought on both the 15m and 1h timeframes, with a strong bearish divergence forming on the 15m, signaling clear momentum exhaustion. The zone above aligns with major resistance on 15m and 1h, adding significant selling pressure and increasing the probability of a sharp correction.
Current price action confirms weakening buy-side momentum, making this a clean short setup.
🎯 Trade Setup:
TP: 0.02608
SL: 0.03503
RR: 1 : 2.96
A textbook short setup: clean, high-clarity signals, focused on momentum weakness and resistance reaction.

Gold price continues to fall back to 3933⭐️GOLDEN INFORMATION:
Gold (XAU/USD) extends its slide toward $4,030 in early Asian trading on Tuesday, pressured by fading expectations of a US rate cut next month. Markets now await Thursday’s US September Nonfarm Payrolls report for further direction.
Meanwhile, the US Dollar strengthens for a third straight day, making gold more expensive for foreign buyers. Traders continue to look for clarity on the Fed’s policy outlook after the record-long government shutdown delayed key economic data releases
⭐️Personal comments NOVA:
Continuously breaking support, gold price returns to 3933 below 4000. Selling pressure remains.
⭐️SET UP GOLD PRICE:
🔥SELL GOLD zone: 4108 - 4110 SL 4115
TP1: $4100
TP2: $4090
TP3: $4080
🔥BUY GOLD zone: 3933 - 3931 SL 3926
TP1: $3945
TP2: $3960
TP3: $3970
⭐️Technical analysis:
Based on technical indicators EMA 34, EMA89 and support resistance areas to set up a reasonable SELL order.
⭐️NOTE:
Note: Nova wishes traders to manage their capital well
- take the number of lots that match your capital
- Takeprofit equal to 4-6% of capital account
- Stoplose equal to 2-3% of capital account

SHORT – Puffer🐻 Scalp SHORT – Puffer
RSI on the 1H timeframe is extremely overbought and has formed a strong bearish divergence, signaling clear exhaustion in the bullish momentum. Weakening volume confirms that buying pressure is fading. Price action is showing distribution, suggesting a likely technical pullback.
🎯 TP: 0.09079
🛑 SL: 0.11527
📊 RR: 1 : 2.67

GBPUSD OUTLOOK 17 - 21 NOV 2025Last week we saw UK Claimant count come in higher than expected indicating a slowing down of the labor market. This Wednesday we have a forecast of 3.6% CPI which is lower than the previous 3.8%. If CPI comes in as expected that will be bearish on the the Pound and more so if it is lower than expected.
With lower CPI and higher unemployment the logical outcome should be for interest rates being reduced which is bearish for GBP.
On the dollar we have sticky inflation which came in at 3%. Lower than the expected 3.1% however higher than the previous reading of 2.9%. This week we have FOMC minutes on Wednesday and NFP on Thursday. NFP forecast is 58K which is much higher than the previous 28K. NFP coming in as expected or better yet higher would support my GBPUSD short idea as the FED should consider the risk to inflation more. Powell also said that a cut in December is not locked in and they will also be looking at the data for inflation and the labor market to make their final decision.
This analysis outlines everything I want to see for a high probability short on this pair both fundamentally and technically. For a bullish scenario all figures would be the opposite of what I want to see.
Trade safe and don't get margin called.

Scalp SHORT – Bananas31🐻 Scalp SHORT – Bananas31
RSI is extremely overbought across the 15m, 1h, and 4h timeframes, indicating clear exhaustion in upward momentum. The 15m chart shows a strong bearish divergence, confirming weakening strength. Current price action suggests distribution, setting up a high-probability short-term correction.
🎯 TP: 0.002418
🛑 SL: 0.005375
📊 RR: 1 : 4.74
A clean short setup: concise, technically driven, and focused on multi-timeframe exhaustion signals.

Nifty Trade set up1. Low risk and High reward
2. Price Can pull back to 50% discount zobe
3. Price Trading at supply zone
4. Probable double top

EUR/USD Breakout Setup Toward 1.16000EUR/USD is trading within an ascending channel, showing multiple breakouts and strong support bounces along the trend line. Price has recently touched the upper resistance and is now expected to pull back, with a potential downside target around 1.16000 if the trend-line break occurs.

Scalp Short – XEC📉 Scalp Short – XEC
RSI previously reached extreme overbought levels. Price attempted to retest the previous high but failed, showing weakening bullish momentum. Selling pressure is increasing, suggesting a likely correction ahead — a short setup worth testing.
🎯 Trade Setup:
Take Profit (TP): 0.00001346
Stop Loss (SL): 0.00001517
Risk/Reward Ratio (RR): 1 : 2.42
A precise short setup supported by failed retest behavior and rising selling momentum, signaling potential downside continuation.

Scalp Short – STRK📉 Scalp Short – STRK
A strong bearish divergence has formed on the 1-hour timeframe. Selling volume is increasing and starting to dominate. After an extended overbought phase, a transition toward oversold conditions is likely.
🎯 Trade Setup:
Take Profit (TP): 0.1046
Stop Loss (SL): 0.2117
Risk/Reward Ratio (RR): 1 : 3.81
A high-risk, high-reward short setup driven by clear bearish divergence and rising selling momentum.

Bitcoin Downtrend Continues: Bearish Target at $93,500Bitcoin is trading in a clear downtrend channel, repeatedly rejecting the trendline after liquidity sweeps. Support zones above have already been broken and retested as resistance, signaling bearish momentum. Price is currently consolidating near the lower channel, with a potential drop toward the target zone around $93,500.

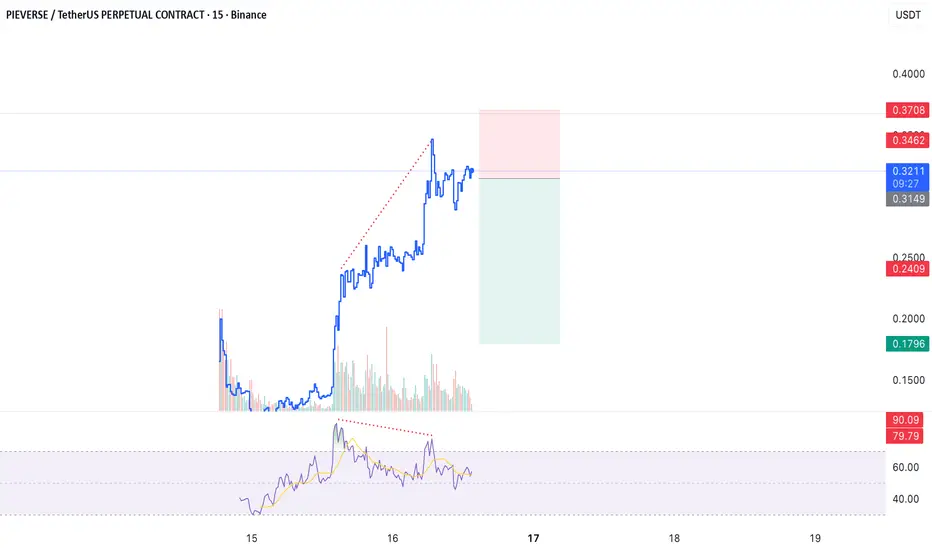
Scalp SHORT – PIEVERSE 🐻 Scalp SHORT – PIEVERSE
The 15m RSI is in extreme overbought conditions and has formed a strong bearish divergence, indicating momentum exhaustion. Price action shows an internal lower high with clear rejection wicks, confirming imminent corrective pressure. A short-term pullback is the high-probability scenario.
🎯 TP: 0.1796
🛑 SL: 0.3707
📊 RR: 1 : 2.42
Scalp Short – CROSS📉 Scalp Short – CROSS
RSI is showing extreme overbought conditions across all lower timeframes, especially on the 1h chart where RSI has reached 90, signaling buyer exhaustion and a high probability of a downside correction. On the 5-minute chart, a strong bearish divergence has formed — a clear indication of short-term reversal potential.
With momentum weakening and divergence confirmed, this setup offers a high RR short opportunity to capture the expected correction.
🎯 Trade Setup:
TP: 0.10056
SL: 0.1634
RR: 1 : 4.13
Concise, sharp, leveraging momentum exhaustion and price structure for a clean short entry.

Perellla - Short 1. Price Rejected from Key Resistance Zone
The highlighted orange zone around $19.20 – $20.00 has rejected price over and over again.
This is a strong supply zone where sellers consistently take control.
Price failed again to break above it → bearish signal.
2. Below the 50-Day Moving Average
Price is trading under the 50 SMA (blue line).
The 50 SMA is sloping downward, confirming downtrend structure.
Every touch of the 50 SMA has resulted in sell-offs → clear resistance.
3. Lower Highs + Weak Bounces
The recent bounce couldn’t break above previous highs.
This creates a series of lower highs, a classic sign of continuation to the downside.
4. Bearish Break & Retest Pattern
Price broke below support around $19.00, then came back to retest it from below.
Retest failed → now turning down again.
This is one of the strongest short patterns.
5. Volume Weakness on the Upside
Recent green candles show weak volume, while selling candles have stronger pressure.
Bears are in control.

PERFECT MSFT SHORTWe have a really strong timeframe alignment on NASDAQ:MSFT , presenting us with a great shorting opportunity.
Weekly
If we start top down from the weekly, MSFT had a strong and fast rally but has faced strong rejection on the upper side of its long term upward channel. Price may now look to retrace to its previous long-term swing high after this rejection. We also see volatility constriction through Bollinger Bands, indicating potential for large price moves and volume to occur soon.
Daily
On the daily chart we see a strong rejection of the daily 50 ema and resistive levels after a downside breakout.
Hourly
For the entry on the 1hr timeframe we are looking at a large head and shoulder formation, with a trend rejection and a strong rejection of the 1hr 100ema.
I am targeting the previous long-term swing high at 470 as my singular TP.
Goodluck-nfa.

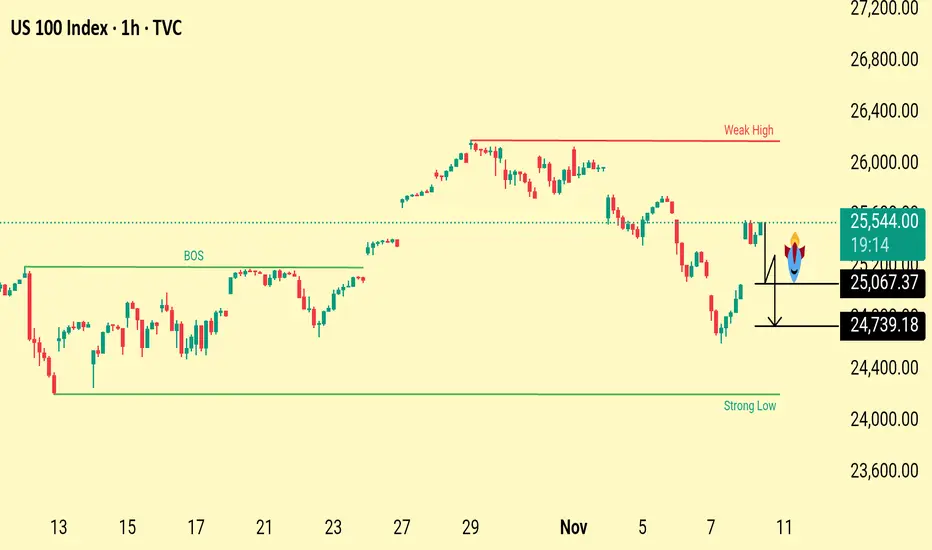
US100 Price Action Outlook Weak High Target&Liquidity SweepZonesThe chart highlights a weak high above current price action, suggesting potential upside liquidity targets. Below, key downside levels at 25,067 and 24,739 mark liquidity pools and possible retracement zones if price rejects current resistance. The structure shows a recent break of structure with both bullish and bearish scenarios in play.
Price is reacting near a resistance area after a recent bounce. The weak high above suggests liquidity may be targeted before any reversal. If price rejects this zone, the next downside levels to watch are 25,067 and 24,739, where liquidity sits and buyers may step in. Structure remains mixed, with both upward liquidity grabs and potential pullbacks likely