23 OCT 2025: MARKET OUTLOOK FOR THE DAYUpdate to 20 OCT 2025 Weekly Outlook
The devil is in the detail...
DISCLAIMER:
The owner of this page is an authorised Representative under supervision of TD MARKETS (PTY) LTD, an authorised Financial Services Provider (FSP No. 49128) licensed by the Financial Sector Conduct Authority (FSCA) under the Financial Advisory and Intermediary Services Act (FAIS).
The FSP is licensed to provide advice and intermediary services in respect of Category I financial products, including but not limited to derivative instruments, long-term deposits, and short-term deposits.
All investment ideas are provided in accordance with the scope of the FSP's license and applicable regulatory requirements. Derivative instruments is a leveraged products that carry high risks and could result in losing all of your capital, and past performance is not indicative of future results.
This idea and any attachments are informational/education and does not constitute a recommendation to buy/sell.
No guarantee is made regarding the accuracy or outcome of this trade idea.
If you choose to accept this idea, please do so at your own risk.
Shortsetup

Gold price tries to recover back to 4200⭐️GOLDEN INFORMATION:
Gold (XAU/USD) drops below $4,100 in Wednesday’s Asian session, extending its sharpest selloff in over a decade as traders lock in profits after a nine-week record-breaking rally. Easing US-China trade tensions ahead of the November 1 tariff deadline further dampen safe-haven demand.
⭐️Personal comments NOVA:
Gold price is accumulating, trying to recover back to 4163, 4200
⭐️SET UP GOLD PRICE:
🔥SELL GOLD zone: 4163 - 4165 SL 4170
TP1: $4150
TP2: $4135
TP3: $4120
🔥BUY GOLD zone: 4003 - 4001 SL 3996
TP1: $4020
TP2: $4035
TP3: $4050
⭐️Technical analysis:
Based on technical indicators EMA 34, EMA89 and support resistance areas to set up a reasonable SELL order.
⭐️NOTE:
Note: Nova wishes traders to manage their capital well
- take the number of lots that match your capital
- Takeprofit equal to 4-6% of capital account
- Stoplose equal to 2-3% of capital account

GBPUSD Short Confluence and stacking the oddsFPMARKETS:GBPUSD
Fundamental: Bearish (5/5).
Technical: Bearish (7/7) — Diamond Vault (7-Stack) candidate; SL=0.0121, TP distance=0.0314.
Weak UK inflation and growth; dollar steadies. Trend structure bearish across EMAs; momentum favors sellers while rebounds face supply overhead.

GBPUSD - SELL - Descending channel Market Context:
• Descending Channel in play
• Price testing upper boundary (dynamic resistance)
• Previous Supply Zone adds strong rejection potential
Trade Plan:
• Entry: 1.3400 – 1.3420
• Stop Loss: 1.3470 (above last swing high)
• Target 1: 1.3350 (channel midpoint)
• Target 2: 1.3220 (major demand zone)
• RR: ~1:3.6 to T2
Key Notes:
• Wait for bearish candlestick confirmation
• Take partial profit at T1, move SL to breakeven
• High-probability counter-trend trade within channel

Gold prices begin to recover, big fluctuations⭐️GOLDEN INFORMATION:
Gold (XAU/USD) drops below $4,100 in Wednesday’s Asian session, extending its sharpest selloff in over a decade as traders lock in profits after a nine-week record-breaking rally. Easing US-China trade tensions ahead of the November 1 tariff deadline further dampen safe-haven demand.
⭐️Personal comments NOVA:
Currently, the gold price fluctuates greatly and moves quickly. There are signs of recovery and retreat to the resistance zone around 4235.
⭐️SET UP GOLD PRICE:
🔥SELL GOLD zone: 4235 - 4237 SL 4242
TP1: $4222
TP2: $4200
TP3: $4170
⭐️Technical analysis:
Based on technical indicators EMA 34, EMA89 and support resistance areas to set up a reasonable SELL order.
⭐️NOTE:
Note: Nova wishes traders to manage their capital well
- take the number of lots that match your capital
- Takeprofit equal to 4-6% of capital account
- Stoplose equal to 2-3% of capital account

BTC - Prepare for Wick to 35,000Here I display the long stop loss orders contained in order blocks below price.
These leveraged sell orders only fulfill when price crosses over the level, leaving a chain reaction or sell orders in the chart already - ready to trigger off one into the next.
This mechanic within crypto is what created wicks. I’m showing you here that they can be predicted and traded.
Prepare for this to happen anytime now.
- DD

Rejected Hard from 112K | BTC Headed for 105K and Beyond!?
Hey all, just sharing my short-term bias and levels I’m watching for BTCUSD based on price action and RSI clues.
Price got a clean rejection from the 112k supply zone, and now it’s sliding down with momentum. That orange box acted as a solid wall — no surprise there.
After that drop, price is hovering around 107.5k, but I don’t expect this to hold for long without some bullish fuel (which I don’t see right now).
📉 My Plan:
I’m looking for two key levels to the downside:
🥇 Expect 1: 105025 – This is my first target. I think we’ll see a short bounce from here, maybe a fakeout or trap move before further fall.
🥈 Expect 2: 102286 – If price closes below 105k and fails to reclaim it quickly, then I’m confident this level will be tested next.
I might look to enter short again if we bounce to 108.5–109.5k zone and start showing weakness (wick rejections, lower highs, RSI divergence, etc.).

Short term correction - down below 4300⭐️GOLDEN INFORMATION:
Gold (XAU/USD) dips to around $4,245 in early Asian trading on Monday, pausing after its record-breaking rally. The pullback comes as physical demand eases following the festive surge, while traders await China’s Q3 GDP, Industrial Production, and Retail Sales data later in the day. Last week, the metal gained support from India’s festive demand and robust ETF inflows. However, with fundamentals largely priced in, a short-term correction or consolidation appears likely.
⭐️Personal comments NOVA:
Gold price started to accumulate, adjusted down below 4300 at the beginning of the week. Short-term downtrend
⭐️SET UP GOLD PRICE:
🔥SELL GOLD zone: 4320 - 4322 SL 4327
TP1: $4310
TP2: $4300
TP3: $4283
🔥BUY GOLD zone: $4222-$4224 SL $4217
TP1: $4235
TP2: $4250
TP3: $4270
⭐️Technical analysis:
Based on technical indicators EMA 34, EMA89 and support resistance areas to set up a reasonable SELL order.
⭐️NOTE:
Note: Nova wishes traders to manage their capital well
- take the number of lots that match your capital
- Takeprofit equal to 4-6% of capital account
- Stoplose equal to 2-3% of capital account
BTCUSDT: Short Setup Active Below $110,700Hello everyone, here is my breakdown of the current Bitcoin setup.
Market Analysis
On the 1H timeframe, Bitcoin continues to move inside a descending channel, maintaining a clear bearish structure.
After multiple tests and breakouts, the price is still unable to break through the Resistance Area around $110,700, which remains a strong supply zone.
Recently, we saw a fake breakout, followed by a return below the resistance area — confirming that buyers are losing strength. Currently, the price is forming a range near the Support Zone ($104,500–$105,000), which indicates a short-term consolidation phase before a possible next move.
My Scenario & Strategy
I expect that after the range is broken to the downside, BTC will continue its decline toward the Support Zone ($104,500). If this level fails to hold, the next potential target will be the lower boundary of the descending channel around $102,300.
However, a breakout and close above $110,700 would invalidate the bearish scenario and could indicate a shift in market structure.
That's the setup I'm tracking. Thank you for your attention, and always manage your risk.

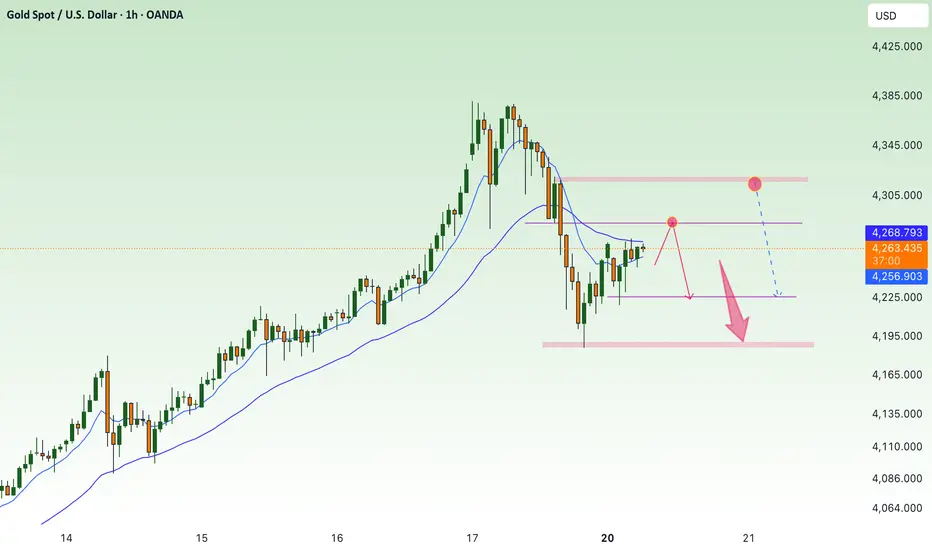
9 Weeks Bull Run Is Over, $4000 In Sight Gold has officially broken out of its 9-week bullish rally, marking a shift in market structure. The recent breakout below the ascending channel signals the end of the strong upward momentum.
Now, price is clearly respecting key support levels on its way down. Each level is acting as a temporary pause in the move, but momentum remains bearish.
If this structure continues to hold, we anticipate a continued correction toward the $4000 zone, which aligns with previous demand and technical confluence.
Bearish Outlook
Bullish channel broken
Price respecting lower support zones
Correction likely to extend to $4000
Note: A clean break below each support zone increases the probability of reaching the $4000 target.

BTC Short Update - Prepare for Wicks to these LevelsAn update on my ultimate swing short trade:
There’s a good possibility this swing will be the speed of a scalp trade, at least the first drop to 35,000
Prepare for wicks to the following lows:
Wick 1 - 34,700-35,000 bottom
Retrace Up to 77,500, reject at 77,500
Wick 2 - 7,250 to 9,000 range
Happy trading and thanks for following my ideas.
- DD

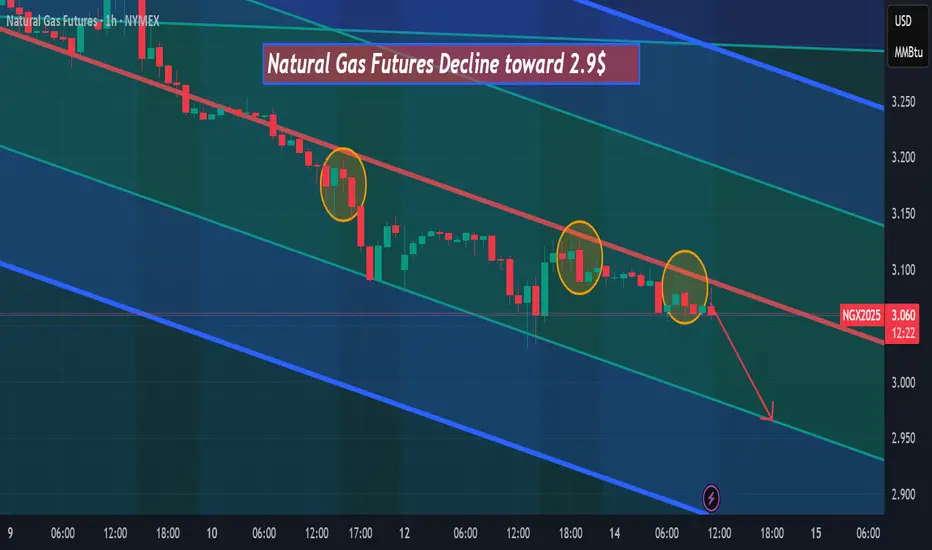
Natural gas futures are declining toward $2.90 Natural gas futures are declining toward $2.90 after three pullbacks on the bearish red trendline, according to my analysis on the 1-hour timeframe.
Sellers continue to dominate after the recent failure to hold above the bearish red trendline, increasing the probability of a move toward the $2.90 support zone
BEARFlAG Aussie Against the Pound Hey Guys,
The Aussie seems to have broken the Bear flag against the British pound providing a good short entry with a .90 stoploss and a over 10% take profit target great risk to reward. that stop loss is supported by the confluence of the trendline becoming resistance, the 100sma and the previous high. This is also a continuation of the larger decline against the pound that broke out December last year
see picture below
Do your own research

USD/AUD Short Term OutlookHey guys, This is a thesis I've had for quite some time but seems to be unfolding of late. With the talks and worries about the regional banks in America and the private credit companies loan books not looking good as the consumer is being squeezed from tariffs, higher interest rates, unemployment slowly ticking up and student debts having to be paid back again after credit growth soared after covid i feel we could see a recession hit the US sometime over the next year. I doubt it will be a collapse anything like 2008 or anything but even a slow down on growth and a pull back on spending could lead to big declines from these AI bubble fueled highs as P/E have risen way out of hand. Something like the 2000s seems more accurate to current conditions.
IF this thesis is right you will see marked declines in the AUD against the USD and i have laid out my first target of .60 as it fits the technical pattern and we have a confluence of support there. We have also recently rejected off the resistance lines, broken the rising wedge (RED Lines), slipped back under the 100SMA. This provides a great enter point with a tight stop loss and a clear take profit.
I will be posting my future outlook for the AUD so please check it out to get the bigger picture
Also do your own research

Diamond Vault Setup: 5 Fundamental + 7 Technical Stacks in Full OANDA:USDCHF USDCHF — Diamond Vault Setup: 5 Fundamental + 7 Technical Stacks in Full Alignment
The USDCHF setup stands out as a Diamond Vault trade — where both Fundamental and Technical confluence align with precision.
We are stacked with the Big 5 Fundamentals: softening US inflation, dovish Fed commentary, firm Swiss GDP resilience, stabilizing risk sentiment, and ongoing safe-haven flows into the Franc.
On the Technical side, all 7 stacks are in play — price trading below every EMA, RSI under 45, a clearly negative MACD, and an ADX above 25 with strong −DI dominance, confirming sustained bearish pressure.
This alignment represents a rare high-probability setup where macro and momentum are synchronized.
A break below 0.79 could open the door toward 0.7750 with confirmation from continued divergence across momentum oscillators.
⚠️ Reminder: Even with full confluence, proper money management is key.
Position sizing should respect your ATR-based risk model — Stop Loss = 1.52×ATR, Take Profit = 2.6×Risk minimum.
Protect capital first, profits second.
Bias: 🔻 Extremely Bearish
Classification: 🟩 Diamond Vault (5 Fundamentals + 7 Technicals)
ADX: 17.39 (rising) | −DI dominance: confirmed
suggest SL 0.8033 TP 0.7748

ETH - Ascending Channel Breakdown - Short the WickETH has broken down this large ascending parallel channel.
Expecting a wick down to the uber low levels coinciding with Bitcoin.
Short Entry - 4,000 to 4,020
Stop Loss - 4,300
Target 1 - 3,370
Target 2 - 2,540
Target 3 - 1,645
Target 4 - 200
- DD

BTC - Another Wick Down to 35,000Per this parallel ascending Channel breakdown - expect another large wick to the downside.
Short Entry - 111,200 to 112,500
Stop Loss - 112,700
Target 1 - 97,350
Target 2 - 64,700
Target 3 - 36,100
This is the first wick down of a 3 wave corrective movement.
I will break the trade down into smaller segments.
For the larger idea see related post “Ultimate Swing Short”
- DD

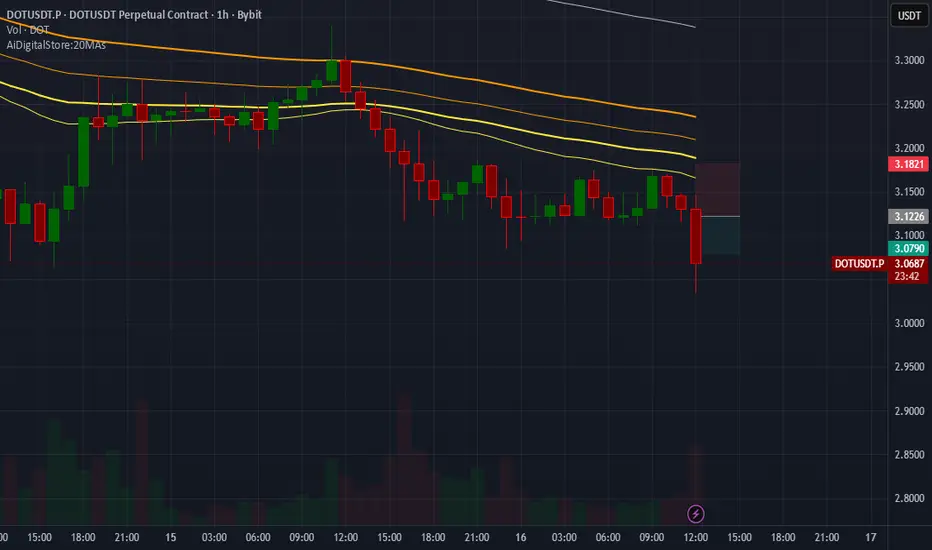
DOTUSDT.P SHORTDOTUSDT.P SHORT
The market has the potential for an downtrend
Price: 3.1226 $
Main target 3.0790 $
SL 3.1821 $
GBPUSD – Breakout Above Supply | Retest & Pullback ScenarioFX:GBPUSD
📈
Structure | Trend | Key Reaction Zones
Price has broken above the key supply zone (1.3360 – 1.3380) with strong bullish momentum.
Structure shows a potential retest scenario, where the market may revisit broken resistance for confirmation before further continuation.
The next major resistance lies near 1.3425 – 1.3460, while supports rest at 1.3380 and 1.3330.
Market Overview
GBPUSD has been consolidating under a descending trendline for several sessions. The clean breakout above the yellow supply zone signals renewed bullish strength.
However, liquidity above recent highs has been tapped, suggesting the market may temporarily correct before continuing its upward trend.
A confirmed retest around 1.3380 would offer fresh long opportunities toward the upper highs.
Key Scenarios
✅ Bullish Case 🚀 → 🎯 Target 1 1.3420 | 🎯 Target 2 1.3460 | 🎯 Target 3 1.3500
❌ Bearish Case 📉 → If price breaks below 1.3330, deeper correction toward 1.3280 (pink zone) is possible
Current Levels to Watch
Resistance 🔴 1.3420 – 1.3460
Support 🟢 1.3380 – 1.3330
⚠️ Disclaimer: This analysis is for educational purposes only. Not financial advice

SHORT ON USD/CADUSD/CAD is ready for a drop.
I will be selling USD/CAD to the next demand level looking to catch 100-150 pips

Short HYPEThis setup shorts the failure at the channel midline and 41–42 supply, aiming for a quick move back into the lower half of the daily channel with first take‑profit near 37.8 where prior demand and fib confluence sit.
Execution is simple: sell into a fresh rejection below 41–42, I use a hard stop around 43.1 just above the recent swing and channel cap, and let the trade work toward 37.8 with the option to trail if momentum accelerates lower. If price closes back above 43.1, the idea is invalid and the short is closed without debate

BTCUSDT.P SHORTBTCUSDT.P SHORT
The market has the potential for an downtrend
Price: 112383.0 $
Main target 110522.0 $
SL 114858.5 $

EURUSD Daily Re-Entry ZoneLooking for Sell at this area.
Reason: BMA Daily Re-entry Zone.
Risk to reward 1:2
20 pip SL to make 40 Pips
Disclaimer: This analysis is for educational purposes only and represents my personal opinion. It is not financial advice or an invitation to trade. Please do your own research before making any decisions.
