EURUSD Daily Re-Entry ZoneLooking for Sell at this area.
Reason: BMA Daily Re-entry Zone.
Risk to reward 1:2
20 pip SL to make 40 Pips
Disclaimer: This analysis is for educational purposes only and represents my personal opinion. It is not financial advice or an invitation to trade. Please do your own research before making any decisions.
Shortsetup

AUDUSD BBMA Daily Re-Entry ZoneI am looking for sell at this point, I will instantly enter small lot at this area and see the reaction to add more layers.
Reason: Daily re-entry Zone (BBMA) + SNRC1 (Bystra) aligned together
Risk to Reward: 1:2.7
40 pip SL to make 100 pips.
Disclaimer: This analysis is for educational purposes only and represents my personal opinion. It is not financial advice or an invitation to trade. Please do your own research before making any decisions.

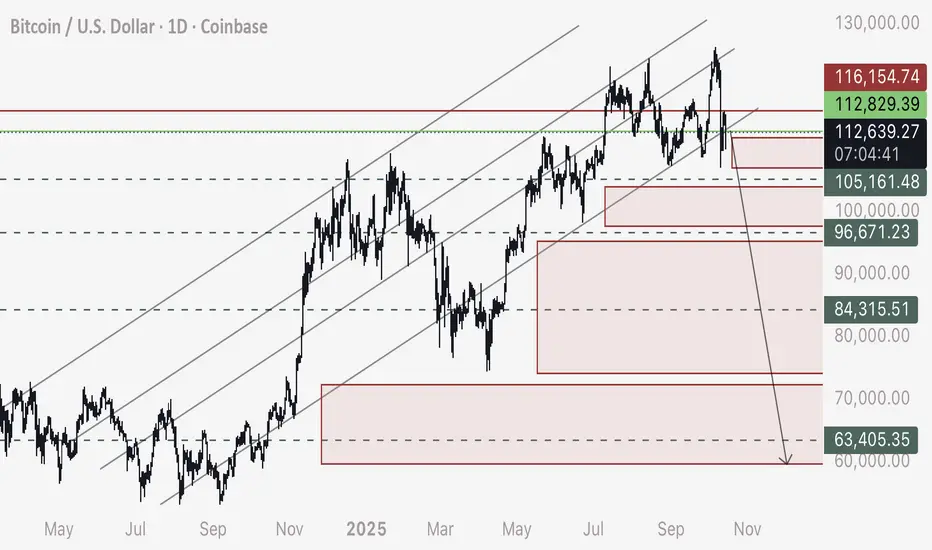
BTC - Short Using Order Block AnalysisThese order blocks are filled with long position stop loss orders / leveraged sell orders that fill only when price passes.
Short Details:
Entry - 112,800 to 113,000
Stop Loss - 116,100
Target 1 - 105,160
Target 2 - 96,670
Target 3 - 84,315
Target 4 - 63,405
Hope you are enjoying my trade ideas and good luck to all.
- DD
BTCUSD: 1R secured, looking for next short signal📊 BITSTAMP:BTCUSD Analysis – October 10, 2025
🔁 Current Position Update
The Sell position from October 8 remains active and profitable.
The trade is currently up around 1R.
Traders can move stop-loss to breakeven to secure profits and eliminate downside risk.
📈 Market Outlook & Trading Plan
Trend bias remains bearish.
The main plan for today: continue looking for short entries in line with the trend.
On the H2 timeframe:
Price has closed below the EMA, confirming ongoing bearish momentum.
Wait for DD (Double Doji) or SB (Second Breakout) setup as confirmation for the next Sell opportunity.
For traders already holding positions, consider DCA add-on entries to compound profits if the downtrend extends further.
⚙️ Position Managemen t
The current trade remains safe and in profit.
Monitor price reaction near the H2 EMA for possible re-entry setups.
Avoid impulsive entries – focus only on clear signals with a proper R:R structure.
🎯 Summary:
The active Sell trade has reached 1R – stop can be moved to breakeven.
Continue monitoring for DD/SB setups on H2 to scale in or add new short positions in line with the trend.
You can refer to my previous analysis here:
Please like and comment below to support our traders. Your reactions motivate us to do more analysis in the future 🙏✨
Daniel Miller @ ZuperView

Broken through the channel head down furtherStrong Dollar Surges Higher as other main currencies are dominated by bears for time being,
catch those down run

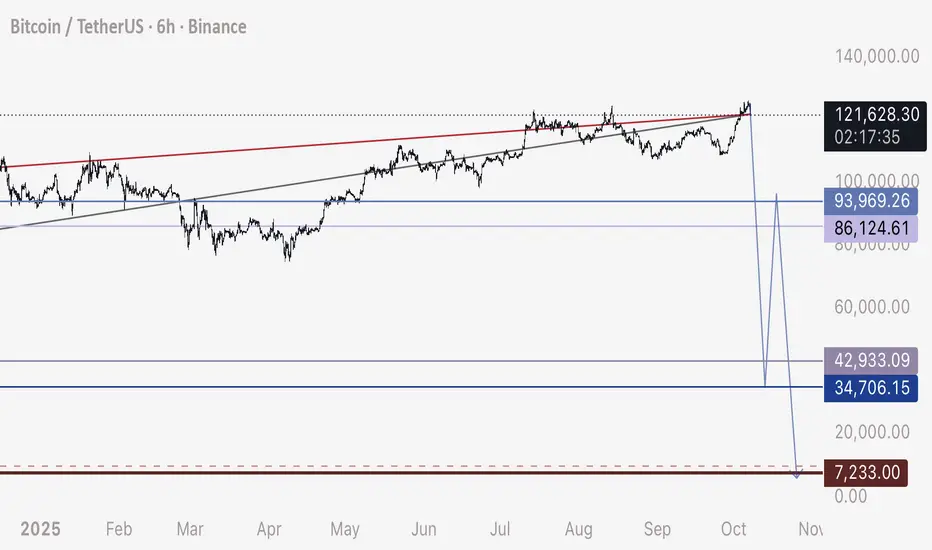
BTC - Short - 3 Wave Correction Bitcoin Short signal with a lower entry for those that didn’t catch the last top.
3 simple targets.
Entry - 111,900-112,000
Stop Loss - 116,400
Target 1 - 85,000
Target 2 - 36,000
Target 3 - 10,000
Buckle in.
- DD

Solana and Bitcoin Update ! Whats Next Quick update covering BTC and Solana .
I had done videos previously anticipating this move to the downside and wanted to cover the current price action and add a little clarity to the situation .
We have had a great reaction off of BTC so far and thus some alts have also followed suit .
Bitcoin holds the fate for the alts so we want to see btc hold the current range 113K .
Take it level by level and dont panic . This is a great opportunity but we want to see a sign of strength in SOL before taking positions .

BTC - Short Trade Update All is going to plan here. A good DCA entry for the short would be 116,800 zone
Expecting a drop straight to 35,000 from here.
This will definitely happen. At the risk of sounding insane, I have zero doubts about it.
Good luck to everyone.
- DD

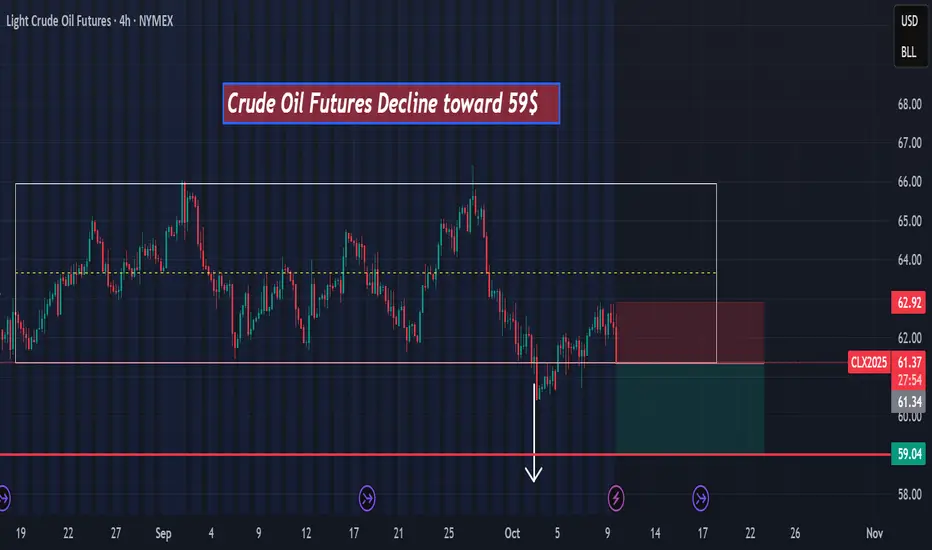
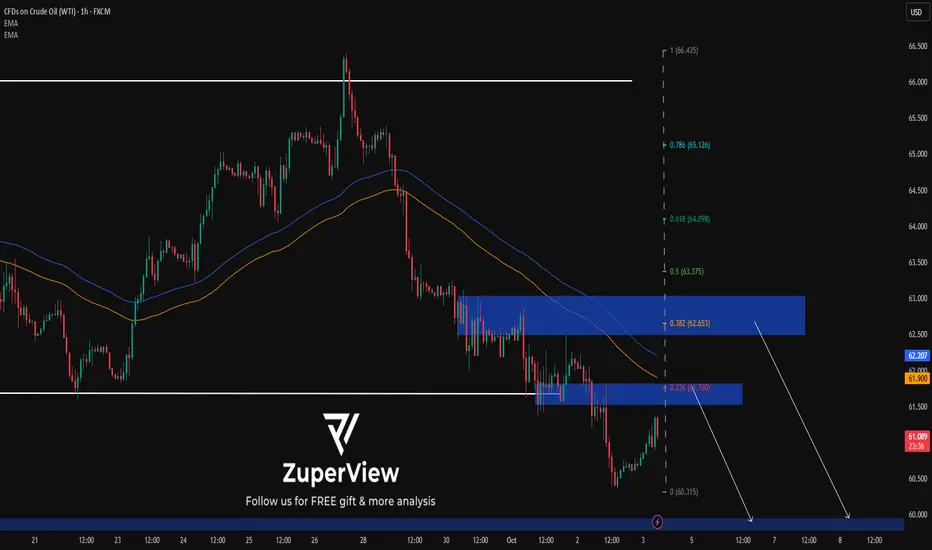
Crude oil decline toward 59$hello,
According to my technical analysis, there is a high probability of a decline toward $59 in the next few hours,
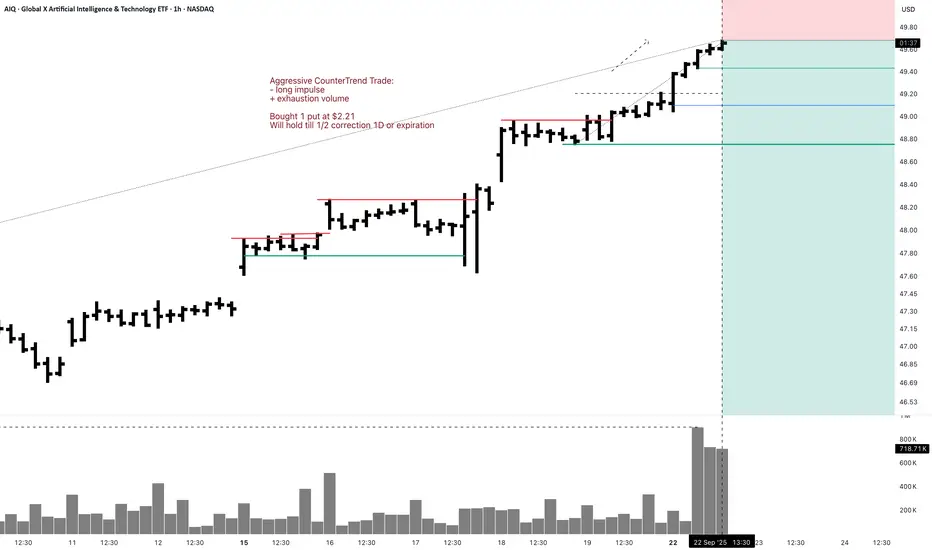
AIQ 1H Swing Aggressive CounterTrend TradeAggressive CounterTrend Trade:
- long impulse
+ exhaustion volume
Bought 1 put at $2.21
Will hold till 1/2 correction 1D or expiration
Daily CounterTrend
- long impulse
+ above expected range
+ exhaustion volume
Monthly CounterTrend:
- long impulse
+ SOS reaction bar
Yearly CounterTrend
"- long impulse
+ T1 level
+ resistance level
- far above T1"
USOIL: Price breaks out of sideways – sell on pullbackTo better understand my current outlook on USOIL, please refer to my previous higher-timeframe and fundamental analyses.
This could be a position trade in anticipation of a larger downtrend on the daily timeframe, but there's risk involved due to the upcoming Non-Farm Payrolls (NFP) report this Friday.
* Trend: assessed using at least three trend indicators, with market structure as the primary guide.
** Weak or Reversal Signals: Assessed based on one of our criteria for trend reversal signals.
*** Support/Resistance: Selected from multiple factors – static (Swing High, Swing Low, etc.), dynamic (EMA, MA, etc.), psychological (Fibonacci, RSI, etc.) – and determined based on the trader’s discretion.
**** Our advice takes into account all factors, including both fundamental and technical analysis. It is not intended as a profit target. We hope it can serve as a reference to help you trade more effectively. This advice is for informational purposes only and we assume no responsibility for any trading results based on it.
Please like and comment below to support our traders. Your reactions will motivate us to do more analysis in the future 🙏✨
George Vann @ ZuperView
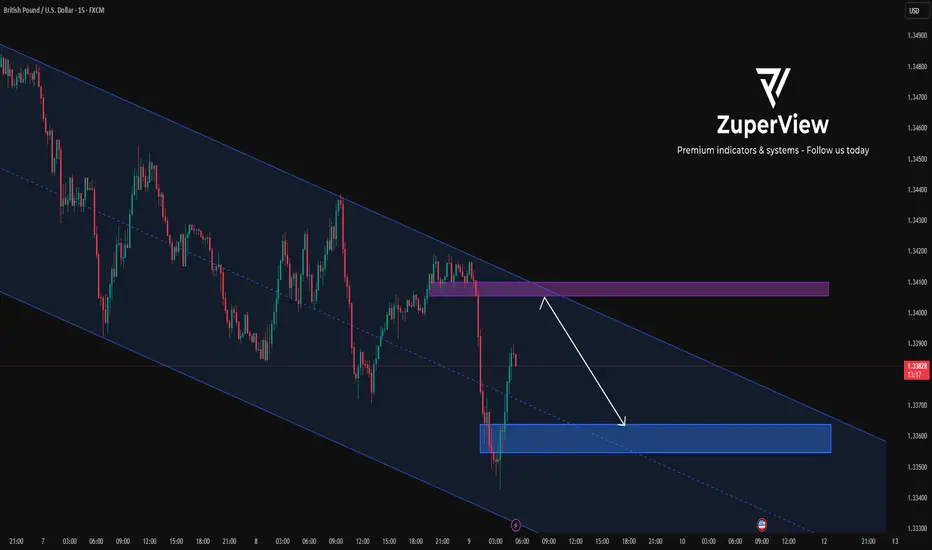
GBPUSD: testing bearish correction pressure from the higher time
* Trend: assessed using at least three trend indicators, with market structure as the primary guide.
** Weak or Reversal Signals: Assessed based on one of our criteria for trend reversal signals.
*** Support/Resistance: Selected from multiple factors – static (Swing High, Swing Low, etc.), dynamic (EMA, MA, etc.), psychological (Fibonacci, RSI, etc.) – and determined based on the trader’s discretion.
**** Our advice takes into account all factors, including both fundamental and technical analysis. It is not intended as a profit target. We hope it can serve as a reference to help you trade more effectively. This advice is for informational purposes only and we assume no responsibility for any trading results based on it.
Please like and comment below to support our traders. Your reactions will motivate us to do more analysis in the future 🙏✨
George Vann @ ZuperView
EURGBP possible shorti guess on NFP we will see the lower levels in EURGBP, the selldown of this week is yet not finished !
SL is 0.87100
TP is 0.86500

Gold price dropped sharply, adjusted around 3900⭐️GOLDEN INFORMATION:
Gold (XAU/USD) holds below the key $4,000 mark during the Asian session on Friday. While the metal remains under pressure after Thursday’s pullback from record highs, softer US Dollar momentum, expectations of further Fed rate cuts, and lingering US government shutdown concerns continue to lend support.
⭐️Personal comments NOVA:
Gold price started to have a large-scale correction, below 3400. Selling pressure continued around 3900.
⭐️SET UP GOLD PRICE:
🔥SELL GOLD zone: 4018 - 4020 SL 4025
TP1: $4005
TP2: $3980
TP3: $3965
🔥BUY GOLD zone: $3894-$3896 SL $3889
TP1: $3905
TP2: $3920
TP3: $3935
⭐️Technical analysis:
Based on technical indicators EMA 34, EMA89 and support resistance areas to set up a reasonable SELL order.
⭐️NOTE:
Note: Nova wishes traders to manage their capital well
- take the number of lots that match your capital
- Takeprofit equal to 4-6% of capital account
- Stoplose equal to 2-3% of capital account

XAUUSD - OB REJECTION SETUP
Price on XAUUSD is showing a potential retracement setup after a clear Break of Structure (BOS) on the lower timeframe. Following the Change of Character (CHoCH), the market formed a short-term bullish correction during the Tokyo session. Current price action suggests a possible pullback toward the identified Order Block (OB) zone.
The ideal entry area is marked around the OB, where a bearish reaction is expected. Once price taps into this supply zone, a rejection or confirmation candle could validate short positions. The projection indicates that after entry, price will continue to push downward toward the target zone, aligning with the overall bearish structure continuation.
This setup reflects a liquidity grab before the next impulsive leg to the downside.

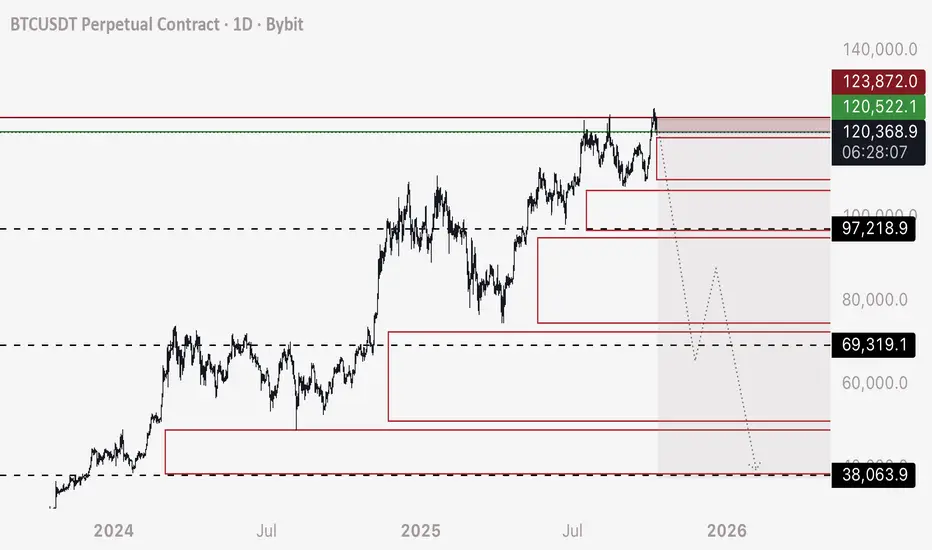
BTC - Short a Stop Hunt and Stay on the Right SideI’m breaking my larger idea down into multiple trades, now that others are opening up to the reality that it’s possible.
These order blocks shown are filled with long position stop losses, leveraged sell orders that only fill when price crosses over - and will set off like a chain reaction.
This will create a very fast drop IE Stop Hunt - and we can take advantage of it.
TRADE 1 - SHORT
Entry - 120,200 to 120,500
Stop Loss - 123,800 (although I don’t see Bitcoin rising back above 121,000 before this trade completes)
Target 1 - 97,250 (Close 25% of trade)
Target 2 - 69,400 (Close 50% of trade)
Target 3 - 38,100 (Close 40-90% of trade as it’s possible we continue to drop and don’t retrace from here to 90,000 appx)
I’ll be logging this trade.
All the best and buckle in.
- DD
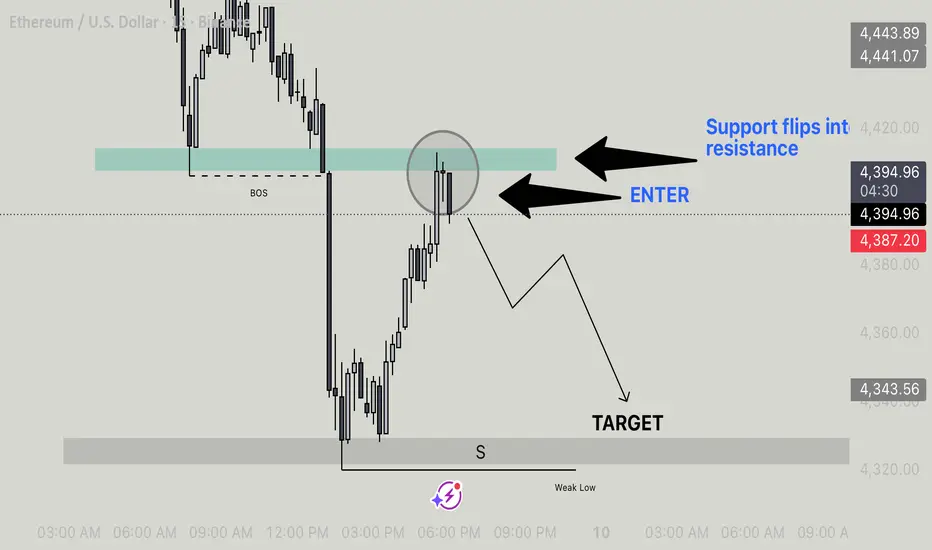
EthUsd - Break And Retest Short SetupKey Structure Areas:
Previous Support Zone (highlighted in green) is now acting as resistance.
Break of Structure (BOS) indicates a shift in market direction from bullish to bearish.
Target Zone marked near a prior weak low / support (S) zone.
Setup Explanation:
Break of Structure (BOS):
Price breaks below the previously strong support zone.
Signals bearish momentum and a potential trend reversal.
Retest of Support as Resistance:
After the BOS, price pulls back into the old support zone.
This zone now acts as resistance, confirming the change in polarity.
Entry Point:
The ideal entry is marked at the retest level within the resistance zone.
Candlestick reaction (e.g., rejections or wicks) confirms seller strength.
Target Area:
The target is the weak low marked with an “S” — a previous swing low that may now be liquidated or swept.
This gives a favorable risk-to-reward ratio for a short trade.
Key Trading Concepts Used:
Market Structure: BOS identifies trend change.
Support/Resistance Flip: A classic and reliable trading concept.
Liquidity Sweep Target: Going for the weak low assumes it will be tested or broken.
Potential Trade Summary:
Direction: Short / Sell
Entry: ~$4,397 (at retest of resistance zone)
Target: ~$4,343 or lower
Stop-loss: Above the resistance zone (around $4,420)
BTCUSDT.P SHORTBTCUSDT.P SHORT
The market has the potential for an downtrend
Price: 121264.0 $
Main target 119632.0 $
SL 124299.0

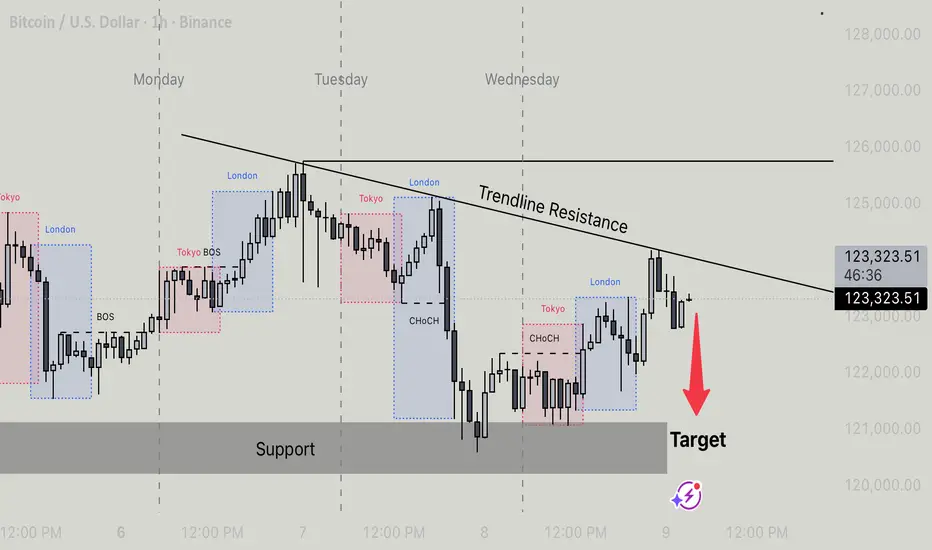
Btcusd- Rejection From Trendline Resistance Targeting Support BTCUSD on the 1-hour timeframe is currently respecting a descending trendline resistance, showing repeated rejections each time price approaches the upper boundary. After multiple changes of character (ChoCH) during the London and Tokyo sessions, the structure indicates a weakening bullish momentum and potential for a bearish continuation.
Price is now consolidating below the trendline, suggesting sellers may take control to drive the market back toward the major support zone. The target area aligns with previous liquidity resting below the support, where price may react for a possible short-term bounce or structure shift.
If bearish pressure continues, we can expect price to fill the imbalance and tap into the support level near the highlighted target area before any reversal signs appear.
Target: Support zone near 121,000
US100: Imbalance rejection – Bears back in control
🧠 SKILLING:US100 Technical Analysis
🧱 Resistance Zone (Imbalance)
• The 24,900 – 24,950 area acts as a strong resistance, overlapping with a supply/imbalance zone.
• Price has reacted bearish from this level, showing clear selling pressure.
• This is a potential area to look for short (Sell) setups.
________________________________________
📉 Current Market Structure
• After a sharp bullish retracement, price formed a rising channel 🔵.
• However, inside the highlighted circle, price has broken down from the channel — indicating weakening bullish momentum.
• This breakdown supports a short bias in the short term.
________________________________________
💡 Trade Plan
• Bias: Look for Sell setups near the resistance zone.
• Confirmation: Wait for a small pullback and a new lower high before entering short.
• Target (TP): Toward the Support zone 24,740 – 24,868 (previous bottom).
• Stop Loss (SL): Above resistance at around 24,950 – 25,000.
________________________________________
🟢 Support Zone
• The 24,740 – 24,780 area is the previous bottom, where price previously bounced strongly.
• This level might attract profit-taking from sellers or temporary buying interest.
________________________________________
⚠️ Risk Notes
• If price closes above 25,000 (H1 candle), the bearish scenario becomes invalid.
• Manage position sizing carefully and wait for clear confirmation before entering a trade.
________________________________________
🧭 Summary
• Short-term Trend: 🔻 Bearish correction
• Mid-term Trend: 🔄 Sideways – waiting for a breakout of either 24,740 or 25,000.
• Current Opportunity: Sell from resistance → Target support zone
Please like and comment below to support our traders. Your reactions will motivate us to do more analysis in the future 🙏✨
Harry Andrew @ ZuperView

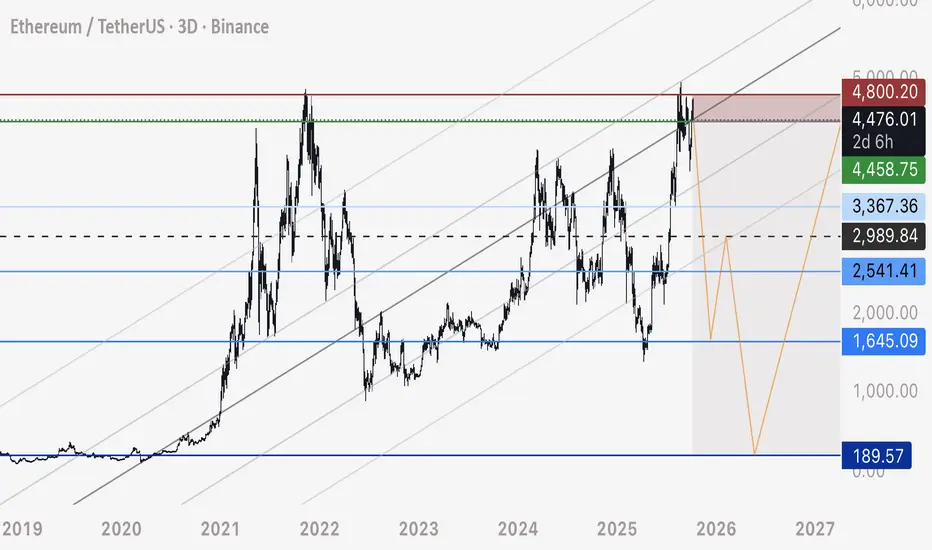
ETH UPDATE - Return to Entry Level, Short Trade InitiatedIn similar fashion to the Bitcoin trade today, here is details on my ETH Short Flash Crash idea.
For detailed information and explanation, please see my linked related posts made today.
Entry / Risk Management:
Entry - 4,460 to 4,480
Stop Loss - 4,800
Take Profits:
1) 3,400 - 20-50% Closure
2) 2,550 - 20% Closure
3) 1,650 - 40-60% Closure
4) 200 - 100% Closure
ETH may create a 3 wave corrective move - and I will be hedging with a long position from 1,600 to 3,000 - timed entry with Bitcoin hitting 35,000
I will buy SPOT ETH only at the range of 200-500
Yours truly,
- DD
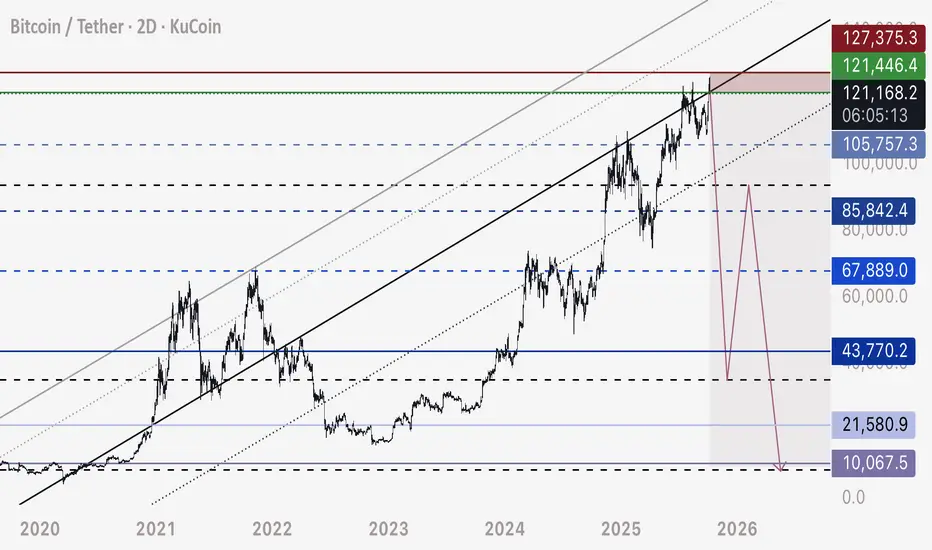
BTC - Trade Setup Today for my Flash Crash Plan Branching off my previous two posts today, which are linked below and give an in depth analysis and theory behind this idea and plan, here are the details of my short trade on Bitcoin.
Entry - 121,400 to 121,700
Stop Loss - Keep it Tight at 127,400 in case Bitcoin moves up to 126,800 to form the head of an inverse head and shoulders (unlikely but I keep two direction ideas in mind always)
Take Profits:
105,700 - 10% Closure
85,800 - 10% Closure
67,900 - 20% Closure
43,800 - 60% Closure
From here, if I see Bitcoin start to rise from 35,000 - I will open a hedge long position, fully close 80% of short, and DCA all profits back into my short at 92,000 to 93,000
21,600 - 60% Closure
10,000 - 100% Closure
From here, I will buy BTC on spot at 8,000 to 10,000
Any questions feel free to comment below.
For each laughing face I will add in more to my short, which I am logging for a future post.
Yours truly,
- DD
Bitcoin Crash Incoming - Watch for this 3 wave Move Here is a close up look at expected corrective path.
This move will be extraordinary fast, the fastest and largest drop we’ve seen in cryptos history.
Please see my linked related posts from today for a detailed overview of this theory, explanation, and helpful insights.
God speed and love to all.
- DD