ETH re-distribution patternHere we have a classic Wyckoff re-distribution pattern for a continuation to the downside. I'm looking for 4200 by Friday.
Shortsetup

UGLY! FNMA Collapse! We Are in a Recession!The recession began in earnest in late 2022.
Subsequently, in March 2023, Silicone Valley Bank was wiped out; the feds took over and now here we are on the other side of the expansionary cycle. As it currently stands, banks are still sitting on hundreds of billions in unrealized losses.
This can collapse faster than you can blink.
Dump 'em!

Is the Rate cut priced In | Potential Gold Correction
In this video I highlight the possibility that the highly anticipated rate cut decision is already priced in . If this is the case then we could be at the brink of a healthy correction .
I demonstrate what that could look like if we start to pull back and go into correction territory.
I support this idea with not only the psychological motive but additional confluences using the TPO chart .
Thanks for your support

EUR/NZD Creating H&S Pattern , Buy Setup Is Valid Now !Here is my 4H Chart On EUR/NZD , The price creating a very clear reversal pattern ( Reversed head and shoulders pattern ) and the price made a very good bullish price action now from a good support area above my neckline. so we can enter a buy trade now if you are an aggressive trader or u can wait for a 4H retest for My Neckline and then u can enter your buy trade. For this trade we can be targeting from 100 : 150 pips with a decent stop loss.

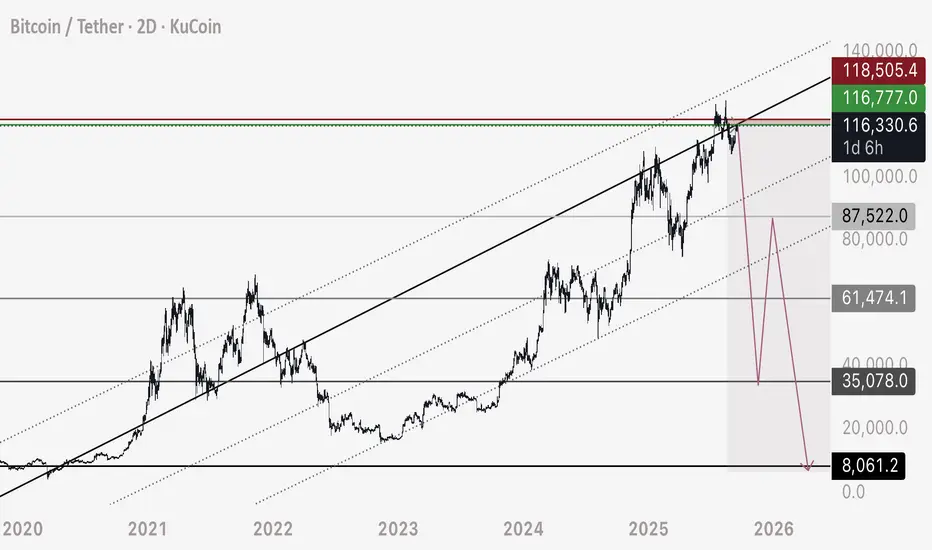
BTC Short Update - First Entry Point Hit Hi all, we have hit the first entry level on this trade idea again, and I will provide you with updated numbers.
First of all - to those asking “why” this would happen - please see my related idea on DXY as well as Blackrock.
For those asking “how” it’s possible, please see my tutorial on drawing heatmaps and understanding how bitcoin moves.
For those following my ideas, I explain order block analysis, my theory on how Bitcoin moves, and here we have a trading plan compiling it all together.
In theory, these drops should happen very quickly - as I explain the technicals of it in the order block tutorials.
Entry - 116,300 to 116,800
Stop Loss - (Can be lowered to 118,000)
Targets:
1) 90,000
2) 62,000
3) 38,000
After the third target we will likely rise to 86,000-88,000 area - however the short may be held all the way to 8,000.
88,000 is a major bearish trendline - I expect this will break, we will form a 3 wave corrective pattern and rise back up to retest this level.
4) 20,000 (Potential bottom 18,000)
5) 10,000
God speed and happy trading.

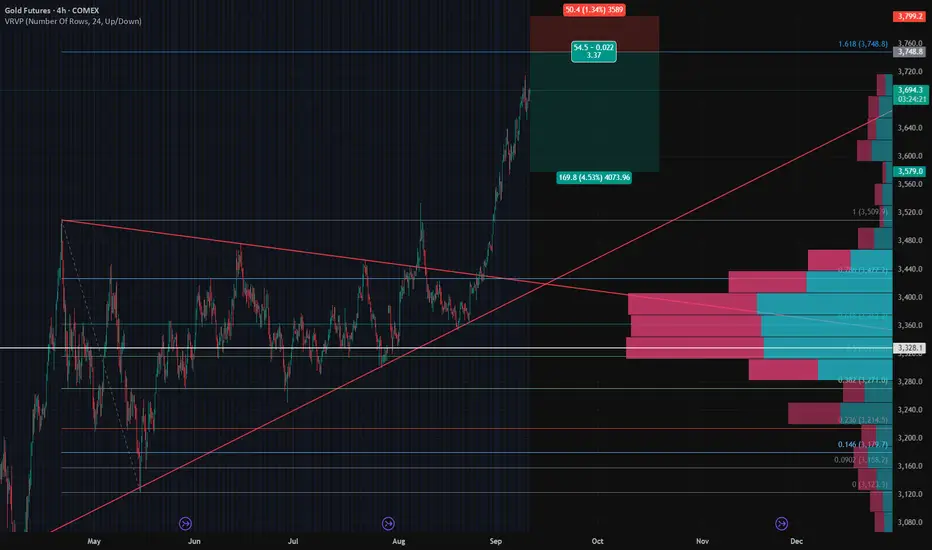
Gold Futures – Short Setup to Lock in Profits🟠 Gold Futures – Short Setup to Lock in Profits
Gold has had a strong breakout above the symmetrical triangle and has now pushed into an extended move near $3,700+. While the trend remains bullish on the higher timeframe, the current leg looks overextended, and I’m looking to hedge profits with a short setup.
🔑 Key Technicals
Pattern Breakout: Gold broke out of a long consolidation wedge and accelerated higher.
Resistance Zone: Price is testing the Fib 1.618 extension near $3,750, a potential exhaustion area.
Volume Profile: Strong demand zone sits between $3,300 – $3,360 where most volume is concentrated. A pullback could retest this area.
Risk-Reward: Setup gives ~1:3.4 RR with stop above recent highs and target into the HVN zone.
📉 Trade Idea – Protective Short
Entry: 3750
Stop Loss: 3800 (extension level).
Take Profit: $3580
⚖️ Strategy
This is not a reversal call – the larger trend is still bullish. The short setup is hedge/profit-protection only, aiming to capture a pullback after the parabolic leg.
I’ll be watching if buyers can defend $3,600 on the first dip; failure to hold could accelerate selling toward the high-volume zone.
📊 Bias
Short-term: Bearish (pullback expected)
Mid-term: Neutral to Bullish (trend intact above $3,300)
What do you think – do we see a healthy correction here, or is gold too strong to fade yet?
EURJPY Short, 15 SeptemberHTF Bullish, but 4H OB Reaction + 15m Bearish Shift
Setup aligns as a counter-trend short inside HTF bullish context, with clean intraday bearish structure confirmation.
📈 HTF Context:
✅ Price reacting from 4H OB
✅ Daily structure bullish but forming double top liquidity above
⚠️ Trade is against overall HTF bias → requires tighter risk
📉 LTF Confirmation:
💤 Asia range formed
📉 15m broke last relevant low → clear bearish structure shift
🔑 75% probability we create a new LH from current zone (HTF alignment)
🎯 Entry Plan:
⚡ 1m BOS confirmed inside 15m decisional OB
🔑 Entry refined at 5m OB
🛡️ Risk: 0.5% (conservative since against HTF trend)
🎯 TP: Target liquidity below recent 15m low / Asia low

Bitcoin Next Step Towards LiquidityI guessed a little wrong with the time. But the probability theory works as usual. Because the thoughts of the market maker cannot be guessed more accurately.

Is BTC affected by SELL the news?Analysis of BTC:
BTC is fluctuating around the 114k – 115k range, which is an important equilibrium zone. If buying pressure holds strong, the price could move toward the 118k resistance area – a key level that will determine the upcoming trend.
• Scenario 1: If BTC successfully breaks above 118k, the uptrend will be reinforced, with the next target at 123k – 124k.
• Scenario 2: If rejected at 118k, the price will likely retest 112k – 110k before recovering.
Summary: The overall trend still leans bullish, but 118k is the crucial resistance zone to watch closely in order to confirm the next direction.

The ray of hope doesn't last longI think in about 2 hours we will see a new downward movement.
Only the market maker knows of course.
But these are calculations using probability theory.
Always look at all the details when analyzing, don't look at the fact that the candle is green.
It lures you psychologically to buy. But it's still early.
There are few liquidations on the market. They are not being written about yet.
There are still strong token inflows to the exchanges

Ethereum Road Ahead of September 17thGood morning. As I wrote in my previous post, this is my first time here. If you like it, please subscribe and support the post.
Weekends are a good time for market makers, when the market is very weak. Before pushing the price up, they need to collect liquidity by hitting long stop-losses, so that no one stands in the way of growth after a possible rate cut.
All the major short positions above have already been closed. Now it’s time to move down. The extreme downside target is $4,200. Market makers don’t necessarily have to push it all the way there—they may stop earlier. It all depends on whether long traders panic and start closing their positions, or keep holding on until the “bitter end.”
The market should always be analyzed in real time, not by “fortune-telling on daisies.” Please don’t forget to subscribe and support my post. That will determine whether it makes sense for me to keep writing further.
Wishing you a great weekend and all the best!

SHORT ON GBP/CADGBP/CAD has a nice rising wedge at a major supply zone.
Price has failed to make a Higher High and is now starting to make Lower Highs.
Looking to catch 300-400 pips to the downside over the next week or so.

SPY's Final Wall: The Bearish ThesisRight now, SPY is facing the most significant confluence of resistance trend lines it has seen in years. Think of this as the ultimate ceiling—a multi-layered wall that the bulls have to smash through.
The market's parabolic move has pushed the price to this critical point. But here's the thesis: the combined strength of these converging trend lines is just too much. The buying power is exhausted.
We believe this is a classic rollover setup. Instead of a breakout to new highs, we expect a strong rejection from this level. The price will hit this solid wall of resistance and turn over, leading to a significant pullback.
The current price isn't a simple pause; it's a test of strength that the bulls are likely to fail.
Day Trade/Swing Trade Idea: Short at red arrow and cover at the green arrow

Gold (XAUUSD) – 11 Sep | H4 Pullback + M15 Supply Zone Setup🟡 Gold (XAUUSD) Analysis – 11 September
Market Overview
Gold remains in an H4 pullback phase after making a fresh all-time high at 3674.6 .
M15 has resumed its bearish structure, aligning with the H4 pullback.
Current Market Scenario
H4: Still in pullback phase.
M15: Bearish structure, currently testing key supply.
This alignment signals we are focusing on short opportunities today.
Key POI for Today
🔹 3647.5 – 3649.8 → M15 supply zone (current area of interest).
Price is inside this zone, and we are waiting for LTF confirmation before execution.
If respected, our next target will be a new lower low below 3620 .
Execution Plan
Monitor price action within 3647.5 – 3649.8 M15 supply zone .
Drop to M1 for micro ChoCh / BoS confirmation.
If confirmation aligns, execute a short setup.
Use fixed 40 pips SL and 120 pips TP (1:3 Risk-Reward).
If the zone fails, step aside and reassess.
No setup, no trade — discipline means knowing when to sit on your hands.
Important Note
Today’s CPI event is expected to cause high volatility.
Avoid trading during news spikes unless a very clear, high-probability setup forms.
Bias for Today
📉 Bearish only. Looking for short setups from supply zones.
📘 Shared by @ChartIsMirror

GBPUSD Bullish or Bearish?Hi Traders!
When analyzing this chart, price made a move to the downside making a low at 1.34000, came up to test 1.36000 to then revisit a daily OB at 1.32000 creating a bearish BOS. However, price didn't close below the previous daily OB low, and pushed back up to the resistance level at 1.36000. Price is now sitting in a range.
If a long presents itself, I would like to see a daily CHOCH happen, price closed above 1.36000 with strength (not just a wick), follow through with bullish confirmation, and 1.36000 retest/new support. Therefore, IMO, this move can still be viewed as a retracement within a bearish structure. For now, I'm waiting for price to show me a solid direction.
Good Luck to all!
*DISCLAIMER: I am not a financial advisor. The ideas and trades I take on my page are for educational and entertainment purposes only. I'm just showing you guys how I trade. Remember, trading of any kind involves risk. Your investments are solely your responsibility and not mine.*

BTC - The largest Trap we have seenThis whole upwards movement since 2023 has been a retest of a bearish breakdown.
The major trendline shown takes Bitcoin to 7,400-8,000 region.
Traders who discredit the possibility of this will certainly be baited and trapped.
Bitcoin will drop aggressively, triggering all of the long stop loss orders one after the next - leveraged sell limit orders that only fill when price passes. This will generate an insanely fast drop to these uber lows.
Traders will take their losses, or their gains - trying to catch the bottom, certain price won’t drop below 100,000 - the 80,000 - then 60,000.
They will not be able to fathom how a drop of such magnitude is possible - or where it’s going to, because they don’t take into consideration the power of stop loss orders and the sheer amount of leveraging in Bitcoins market cap.
Microstrategy - who leverages their assets to produce more of the asset - will likely be challenged with insolvency when the price shows this type of volatility.
The safety of exchange platforms will be called into question - the legalities of leveraging challenged by regulations.
Blackrock will secure their monopoly on Bitcoins buying and selling through their own ETF structure.
Open your eyes. Don’t get trapped or fooled.
This whole move has been a big, intentional set up and my posts explain in detail why, how, what, and when.

ETH - Don’t be fooled - Bearish Retest ETH (like Bitcoin) has risen only to retest a bearish breakdown on the HTF.
This whole upwards movement is one big set up - to trap liquidity in longs and absorb it all from the chart.
My initial call is marked here with original entry.
Second entry can be 4,420 region.
Short to my targets marked on chart.
Don’t be a sucker and get trapped by this.
Happy trading

Short or Trim $LYFT- Shorting/Trimming position on NASDAQ:LYFT offers better risk/return at these levels.
- I would consider buying back close to support $10-11 range.

NVDA Support and Resistance Lines Valid from July 1 to 31st 2025Overview:
These purple lines act as Support and resistance lines when the price moves into these lines from the bottom or the top direction. Based on the direction of the price movement, one can take long or short entries.
Trading Timeframes
I usually use 30min candlesticks to swing trade options by holding 2-3 days max. Anyone can also use 3hr or 4hrs to do 2 weeks max swing trades for massive up or down movements.
I post these 1st week of every month and they are valid till the end of the month.

Shorting $HYPE
Hyperliquid has been sending nonstop and CT is screaming ATH + $100 soon. That’s usually when late longs get trapped.
I’m eyeing a short if we get a blow-off move into the $60–65 zone and it fails. Need that rejection wick before pulling the trigger.
Plan:
Entry: 55 - 60 or a lil below if it rejects
Stop: above $70 (invalidate)
Targets: $52 / $48 / $42
If it blasts through $70 with volume, short idea is cooked and $80–100 opens up next. Simple as that.

BTCUSD📊 BTC/USDT Analysis
✅ Update: TP2 successfully hit as per plan. (As in Previously shared plan)
⚠️ Catch: BTC made a new 1H HH around 113,434, but failed to break the 4H resistance at 113,506±.
🔎 Key Observations:
4H structure remains bearish (Lower Highs intact).
1H still holding bullish structure with HLs along the trendline.
Price is currently retesting our buying trendline zone, showing respect to HLs.
🎯 Scenarios:
Long 📌 Plan:1
Aggressive traders:
1️⃣ Bullish Case (Buying Zone Active)-CMP
BTC is at the trendline support zone → early longs possible
Long 📌 Plan:2
Conservative traders: Enter long only if BTC breaks & holds above 113,500±.
Wait for a bullish 4H confirmation candle at the buying zone before entering long.
📌 Short Plan:
Bearish Case (4H Continuation)
If BTC breaks the trendline & last HL of 1H TF , then Short for 4H bearish pattern continuation.
This would invalidate the current buying zone and 1H Bullish Pattern.
📌
Trade with proper risk management.

$DUOL is a Falling KnifeNASDAQ:DUOL - Falling Knife
Got the sell alert and bearish willy and down we went.
Key support areas: $263 then $251
IF those don't hold you could see AVP - POC $201
Bulls need to breakout of downtrend
