VKTX Viking Therapeutics Exploding Higher TodayVKTX surges higher today after pulling back again near 200-day EMA. Not sure what the news is that's driving the big move higher. The news I did find talks about the following:
1) Viking Therapeutics completed a drug clinical trial stage earlier than expected last week
2) VKTX is on lists of hot stocks to buy for 2026 and could be a takeover, acquisition target
3) VKTX is recommended by 15 Wall Street Ranked analysis who give stock 12-month consensus average price target of $92
4) VKTX is on lists of stocks with high short interest (over 20% short interest) TO BUY because they are vulnerable to getting short-squeezed
Let's talk about the 4th item above. Just imagine VKTX continues to move higher on good news about clinical trials or possibly getting acquired by a larger company. This would push the stock even higher and will force traders who have big short positions on the stock to quickly cover, creating a snowball effect that frantically drives VKTX even higher and completely surges! This is reminiscent of what happened to Game Stop (GME) a few years back. I hope that this happens because I am long on several rather large call option positions on VKTX!
Whatever you all decide to do..... Good Luck!
Shortsqueeze

Going Short TESLA HereTrading Fam,
I'm taking my first ever short here since implementing my new indicator. It has been killing it on the long side. We've exited our last 17 trades, all for wins, with an average profit of 30% per trade and our portfolio is up over 86% on the year. Now, it's time to test the short signals. We received two here on TSLA. I've taken a small entry since this is my first short, representing around 9% of the portfolio total. I'm going to target $350 but will not take more than a 7% loss, thus my stops are set at $476 bring the rrr on this trade entry to 1:3. Let's see how this goes.
✌️Stew

Short PalantirTrading Fam,
This will be only the second short I have taken since implementing my new indicator. We are up 250%+ pending exits in just over a year; however, during that time, I have taken long entries only. Now, it's time to test accuracy on the short side.
On my NASDAQ:TSLA short (my first ever short entry), we are already comfortably in profits. More to come on that.
As far as NASDAQ:PLTR goes, my signal gave me a SELL at $195. As I have been in the habit of waiting for confirmation, I did not enter immediately. Yesterday and today, I believe I have been given the chance for a decent entry. I've entered short at a price of $190 and will shoot for that 200-day SMA at somewhere around $145 for a 2.37 rrr.
Let's see how this goes.
✌️Stew

Spy Bullish Daily CloseSpy closed the week out bullish as it closed green and up over 670 and is at 672 in after hours. If you look at the chart you will see that that wick on the daily trapped about 1% of the friday bears. Today was the highest volume candle of the week at over 100m.
Also,
There is about 50k in option put OI. Always remember to take a photo or screen shot of this on Friday and look at it again on Monday. We may get a morning squeeze to open up on Monday once these are closed. I do think we pull back more to retest this level before eventually going higher.
One trade could be shorting 684 back into 672. (stop 685.) These are all short term as the longer term thesis is bullish.
I believe we see 700 spy by EOD.
See you on the other side.

OPEN | This Will Rip MUCH Higher | LONGOpendoor Technologies, Inc. engages in the operation of buying, selling, and trading of residential properties online. The company was founded by Eric Wu on December 30, 2013, and is headquartered in Tempe, AZ.

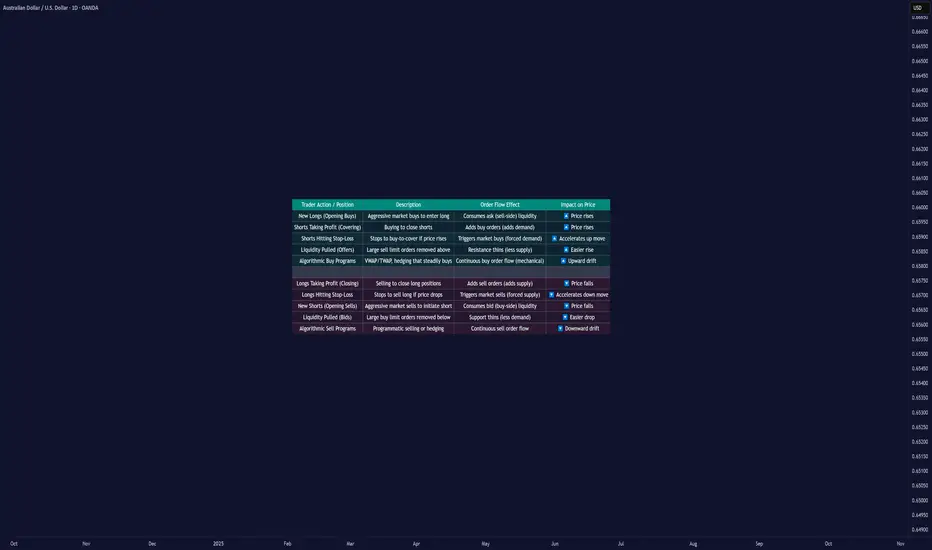
Why Prices Move Up or Down: Order Flow and Liquidity█ Why Prices Move Up or Down: Understanding Order Flow and Liquidity
Most traders are told that prices rise because “there are more buyers than sellers,” and that prices fall because “there are more sellers than buyers.” But that’s not how markets actually work. In every transaction, there’s always one buyer and one seller; what really matters is which side is more aggressive and how liquidity responds to that aggression.
Price movement is the result of order flow interacting with liquidity. When buyers use market orders and aggressively lift the available sell orders (the ask), the price moves up. When sellers hit the bid with market orders, the price moves down.
In short, price moves in the direction of the side that consumes liquidity.
█ The Engine Behind Price Movement
When buyers and sellers agree on price, the market ranges, there’s a balance. When one side becomes more aggressive, an imbalance occurs, and the price must adjust until new liquidity appears.
Imagine the market like a ladder made of buy and sell orders. Each rung shows where traders are waiting, buyers below the current price, and sellers above it. These waiting orders are what we call liquidity.
When a trader sends a market buy order, they’re not waiting; they want to buy immediately. That order takes the best available sell price (the ask). If more traders keep doing this — buying aggressively — those sell orders get used up faster than new ones appear. As a result, the next available sell price is higher, and the price moves up until new sellers fill the gap.
The same logic applies in reverse: when aggressive market sell orders hit the bids, they consume the buy-side liquidity. Once those bids are gone, the next available buyer is lower, and the price moves down.
This continuous back-and-forth, liquidity being consumed, replaced, or withdrawn, is the real engine of every price movement.
█ Why Prices Move Up
1. Aggressive Buying (New Longs)
When new participants enter with market buys, they lift the offers, consuming sell-side liquidity. If this continues, the price climbs until enough new sellers appear to absorb demand. This is the cleanest form of demand-driven uptrend, with new buyers initiating positions.
2. Short Covering
The price moves higher as short sellers buy back positions. This can happen when stops are triggered after a price rise or when shorts take profits after a decline. In both cases, their buying adds upward pressure. When many cover at once, the move can accelerate into a short squeeze — higher prices trigger stops, which trigger even more buy orders, creating a self-reinforcing rally.
Profit Taking Phase
Short Squeeze Phase
3. Stop-Loss Triggers
Clusters of stop-loss orders above previous highs act as “fuel.” When price breaks those levels, automatic buy orders fire off. These aren’t new investors; they’re forced buyers closing shorts. The result is a fast, often exaggerated upward burst.
4. Thin Liquidity and Pulled Offers
Sometimes, price surges not because of huge buying, but because there’s nobody selling. If the sell side of the order book is thin, or if large resting orders get canceled, even small buys can sweep multiple levels. This creates those “air pockets” where price jumps several ticks in seconds.
5. Algorithmic and Institutional Flows
Institutions use automated execution algorithms like VWAP or TWAP to buy steadily throughout the day. These constant flows absorb liquidity over time, creating a slow upward bias. Similarly, option dealers who are short gamma must buy as prices rise to stay hedged, adding even more mechanical buying pressure.
█ Why Prices Move Down
1. Aggressive Selling (New Shorts)
When traders use market sells, they consume buy-side liquidity. If this persists, the price naturally ticks lower as bids disappear, and the next buyer will be willing only at a cheaper level.
2. Long Profit-Taking
At some point, long traders sell to realize profits. These sales add supply, which can cap or reverse an uptrend. It’s not bearish conviction; it’s simply existing longs exiting their positions.
3. Long Stop-Loss Cascades
If prices fall to where many long traders placed stops, those automatic sell orders trigger, creating a chain reaction of forced selling. This is the mirror image of a short squeeze — a long liquidation cascade.
4. Thin Bid Liquidity or Pulled Bids
When buy orders disappear, the market has no floor. Even modest selling pressure can make the price fall through several levels until new bids emerge. This is how “flash drops” occur during low-liquidity periods.
5. Algorithmic and Mechanical Selling
Negative news or risk events can activate automated sell programs, from funds rebalancing to dealers hedging short options exposure. These trades can intensify selling, even without new bearish sentiment.
█ New Positions vs. Exits — The Hidden Difference
Not every up-move means new buyers are coming in, and not every down-move means new shorts.
Some moves happen because existing positions are being closed, not opened. and that distinction matters.
New Positions (Initiative Flow): Create real trends, since they bring new demand or supply.
Position Exits (Reactive Flow): Often short-lived, they relieve pressure rather than add it.
One way to tell the difference is through open interest (in futures or options):
Price up + Open Interest up → new longs entering (sustainable).
Price up + Open Interest down → short covering (temporary).
Price down + Open Interest down → long liquidation (often near exhaustion).
Price down + Open Interest up → new shorts entering (trend formation).
█ The Real Takeaway
Price doesn’t rise because “buyers beat sellers.” It rises because buyers were more aggressive, consuming available sell orders faster than they were replaced. It falls when sellers become more aggressive, taking out the bids.
Both entries and exits can push the price the same way:
New longs and shorts covering both create buy pressure.
New shorts and longs taking profit both create sell pressure.
To truly understand a move, traders must ask:
Who initiated it, new positions or forced exits?
Was liquidity added or withdrawn?
Did open interest confirm new participation or show a squeeze?
Once you start thinking in these terms, price becomes more than a random chart line; it becomes a story of liquidity and intent unfolding in real time.
█ Multiple Forces in Motion
While each example above highlights a single mechanism in isolation, the market rarely moves for one reason alone. In real trading, several of these forces often act simultaneously, new longs entering, shorts covering, stops triggering, algorithms executing, and liquidity thinning.
When multiple flows align in the same direction, the result is acceleration, price moves rapidly as liquidity vanishes, and reactions compound. When opposing forces meet, price can stall, consolidate, or violently whip as both sides compete for control.
In essence, market movement is the sum of overlapping liquidity events, not isolated causes. Understanding how these factors interact in real time is key to reading true intent behind every move.
█ In summary:
Markets move not because of “more buyers” or “more sellers,” but because one side becomes impatient, consumes liquidity, and forces repricing until balance returns.
Understanding who’s moving the market and why — new positioning, forced exits, or vanished liquidity — is the foundation of reading true market intent.
-----------------
Disclaimer
The content provided in my scripts, indicators, ideas, algorithms, and systems is for educational and informational purposes only. It does not constitute financial advice, investment recommendations, or a solicitation to buy or sell any financial instruments. I will not accept liability for any loss or damage, including without limitation any loss of profit, which may arise directly or indirectly from the use of or reliance on such information.
All investments involve risk, and the past performance of a security, industry, sector, market, financial product, trading strategy, backtest, or individual's trading does not guarantee future results or returns. Investors are fully responsible for any investment decisions they make. Such decisions should be based solely on an evaluation of their financial circumstances, investment objectives, risk tolerance, and liquidity needs.
$OPEN - OpenDoor Tech - $9.69 Retest - $10.87 PT🧠 Technical Overview
Ticker: NASDAQ:OPEN (Opendoor Technologies Inc.)
Timeframes: 15-min & 4-hour combo
Current Price: ~$9.30
Trend Summary:
Strong bounce from $8.10 base with two clean BOS (break of structure) signals.
Retested and held $9.19 intraday; momentum candle formed near close.
Channel projection (yellow) shows potential path toward $10.87 → $10.97 short-term.
Volume uptick confirms accumulation — buyers stepping back in.
Key supports: $8.43 / $8.10
Analysis Overview:
NASDAQ:OPEN (Opendoor) is back in motion!
After reclaiming $9.00 support and breaking its short-term structure, the chart shows a clean path toward $10.87–$11.00.
Volume confirms renewed buyer strength after weeks of consolidation near $8.
Watch $9.69 for breakout confirmation — trend remains bullish above $8.43.
#Opendoor #OPEN #NASDAQ #MomentumTrading #RealEstateTech #AIStocks #MyMIWallet

ENVX The Next Short Squeeze?Enovix is a battery technology company focused on developing advanced lithium-ion batteries with 3D architecture. Their innovations aim to deliver higher energy density and improved safety compared to traditional designs, making them a key player in the next-gen battery space—especially for wearables, mobile devices, and electric vehicles.
• Short Interest: 46.91 million shares
• Short Interest % of Float: 27.98%
• Short Interest Ratio (Days to Cover): 6.2 days
• Float Size: 167.66 million shares
• Outstanding Shares: 196.6 million shares
• Dollar Volume Sold Short: $451.27 million
This is a very speculative pre revenue company...momentum is looking strong.

Sugar SB Futures: Extreme COT Divergence – Short Squeeze Ahead?
ICEUS:SB1!
🔎 Market Situation
The latest COT report shows one of the most extreme positioning imbalances in 18 years for Sugar #11:
• Commercials: Net Long 128,130 contracts → 2nd highest since 2007 (only surpassed in Sep/Oct 2020 with ~160k).
• Non-Commercials (Funds): Net Short –125,628 contracts, almost a mirror image.
• COT Index: above 80% since July, peaking at 100% → continuous accumulation by Commercials.
• Open Interest: very high → massive market participation.
• On-Balance Volume (OBV): still negative → typical for final shakeouts before reversals.
📈 Historical Parallels
Looking back at the 5 biggest Commercial Long positions (2011, 2015, 2018, 2020, 2025):
2020: +55% rally within 3–6 months after record Commercial longs.
2015: +30% rally within 90 days.
Other cases: Average performance +10% (T+30), +21% (T+60), +31% (T+90).
👉 Every major COT extreme in Sugar was followed by a double-digit rally.
🟢 Trading Idea (Setup)
Bias: Bullish (expecting potential short squeeze / fund covering).
Entry Trigger: Breakout above key moving averages (e.g. 50-day SMA).
Stop: ATR-based or below recent swing lows.
🎯 Targets
TP1 = partial profit at +1.5R.
TP2 = trend-following → historically, rallies extended 20–30% within 2–3 months.
📅 Seasonality: Q4–Q1 tends to be bullish for Sugar (ethanol demand, Brazil harvest).
⚖️ Risk/Reward
Historical CRV of similar setups: 1:3 to 1:5.
Best rallies occurred when Commercials held positions >100k for several weeks while funds stayed heavily short.
📌 Conclusion
Sugar is showing one of the rarest COT setups of the past two decades.
Commercials are heavily long, funds massively short, and open interest is extreme.
The last time this happened (2020), Sugar rallied more than 50%.
📈 History suggests we could see another powerful move higher.
⚠️ Reminder: Next WASDE report → 09 Oct 2025

$OPEN touched 10$. Next Stops are 15 $ and 25$. Shorts be aware.When I wrote my first blog on NASDAQ:OPEN predicting it will reach 9 $, I got pushback on pumping a ‘meme’ stock with shallow technical analysis based on Fib levels. I wrote on July 19th that by end of summer we will touch 9 $.
NASDAQ:OPEN : Ongoing short squeeze. What are the Fib levels telling? for NASDAQ:OPEN by RabishankarBiswal — TradingView
The 9 $ target has been long achieved. But it was surprising for me to see that since my article on July 19th the short interest in NASDAQ:OPEN has increased to 23% from below 20%. The days to cover has decreased from 1.8 to 0.6. All of these can create violent short squeezes and high volatility. With less than 1 day to cover the shorts, the shorts sellers might get slaughtered if they overstay their welcome.
So, what does all the technical and short interest data tell us. The shorts have not learned their lesson. Wall Street Bets is holding onto this stock to make it its next best meme stock. Now with NASDAQ:OPEN over 10 $ the large institutional investors can buy and include it in their portfolio, especially those with a momentum tilt.
Again, going back to the simple tool in technical analysis and checking on our Fib levels I think the next price levels are 15$ which was a major support in 2021. Once 15$ level is achieved then the next level to watch is 25 $ where it can experience some resistance which was a previous local high.
Verdict: Short sellers should cover shorts and run for the hills. NASDAQ:OPEN can reach 15 $ and subsequently 25 $ with Fed reducing rates and volatility spikes.

XAUUSDXAUUSD Short Call/ Bearish Candel
From area Xau has rejected before let See how the analysis goes book partial profit SL to ENtry as per your risk n reward!

Sydney Sweeney Pumps American Eagle!Sydney Sweeny is apparently still hot on wall street and in the eyes of teenagers.
American Eagle posted a blockbuster earnings report popping the stock like its on Viagra.
Beating Revenue & EPS expectations.
Revenue came in at $1.28B
EPS came in at 0.45
A clear successful advertising campaign from AEO execs.
We issued $15 November 21st calls to members and this trade has blown my expectations with this pop.
This stock has triggered a bullish daily chart pattern which has completed the measured move. Now its a question of how much can wall street bets / reddit squeeze this name?

Is the market panicking over FOMC today?⭐️GOLDEN INFORMATION:
Gold (XAU/USD) fluctuates within a narrow range during the Asian session on Wednesday, showing only modest gains and losses as traders tread carefully ahead of the Federal Reserve’s policy announcement. The metal’s recent rebound from the $3,300 area faces hesitation, with investors awaiting clearer signals on the Fed’s rate-cut trajectory before committing to new positions. As such, attention remains firmly on the outcome of the two-day FOMC meeting, set to be released later today.
In the meantime, pre-Fed uncertainty is lending some support to the safe-haven appeal of gold. Additionally, a slight pullback in the U.S. Dollar—after hitting its highest level since June 23 on Tuesday—is providing a mild lift to the metal. However, expectations that the Fed will maintain elevated interest rates for an extended period are limiting the dollar’s decline and capping upside potential for the non-yielding yellow metal. Adding to the cautious mood, recent optimism on global trade also tempers bullish momentum in XAU/USD.
⭐️Personal comments NOVA:
slight recovery, not big before FOMC news. Gold price will still be under selling pressure when interest rate stays at 3300
⭐️SET UP GOLD PRICE:
🔥SELL GOLD zone: 3373- 3375 SL 3380
TP1: $3360
TP2: $3344
TP3: $3330
🔥BUY GOLD zone: $3283-$3281 SL $3276
TP1: $3295
TP2: $3307
TP3: $3320
⭐️Technical analysis:
Based on technical indicators EMA 34, EMA89 and support resistance areas to set up a reasonable SELL order.
⭐️NOTE:
Note: Nova wishes traders to manage their capital well
- take the number of lots that match your capital
- Takeprofit equal to 4-6% of capital account
- Stoplose equal to 2-3% of capital account

$AI they sleep, i eat. Quiet danger..Hello,
Name has been on my watch for a week or so now, finally just sitting back and getting to a multi analytical chart.
To begin: Yes, I see the head and shoulders pattern forming, scary, I know. Aside from that just zoom out, this name has traded in this range for 1,200 days... the range of $20 to $30 with some bumps in the $40's and low $20's with taps in the teens. This name is quiet, not a loud player like other AI tickers. Something smells fun here. I'm going to be gearing in some $40 calls for 2026. I may risk 20% of my port here. I feel confident in this one, I do. The name is holding good support in the low $20 range and there are a lot more green candles than red. I know other names are getting more attractive like BBAI, you still have SMCI, CRWV, NVDA and so forth, which is fine, means nothing. This was a meme name type of stock about a year ago. I believe this will go on a run towards $50. If you have patience, $50 calls for 2027 would be appropriate and at a fair price for a swing and a possible short squeeze. For those who want to play the shorter term volatility $40 calls for Jan. 2026.
Good luck.
WSL.

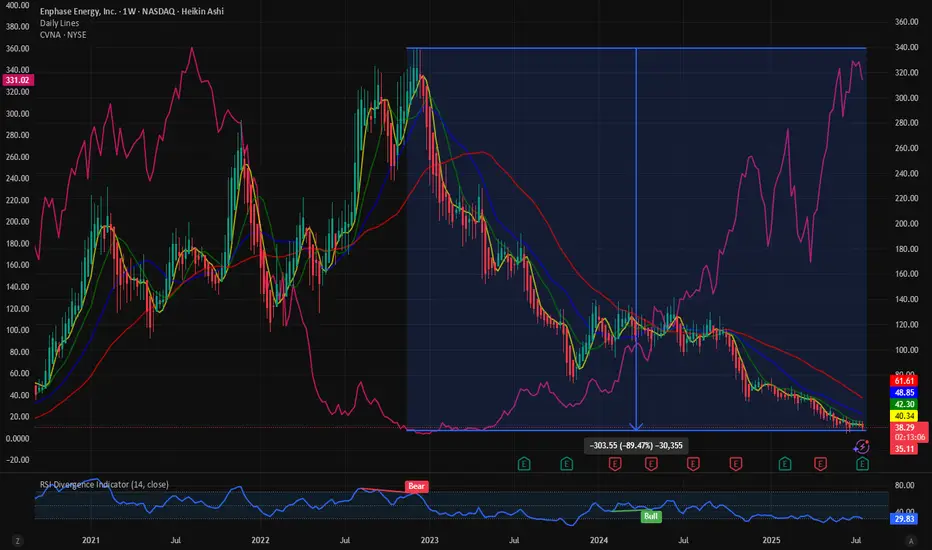
$ENPH:Clean energy stock and messy chart. Short squeeze incomingThe clean energy stocks are in a serious drawdown. NASDAQ:ENPH has a very messy stock. The stock has seen almost 88% of its value wiped out over the last 2 years. But is it the end of clean energy and stocks? With the new administration in place the clean energy stock has been in a bearish pattern.
In terms of the drawdown the stock looks the same as $CVNA. At its lowest NYSE:CVNA had 98% drawdown. NASDAQ:ENPH is down 90% and maybe it must go through a similar drawdown then the price must drop down to 10$.
Currently 21% of the NASDAQ:ENPH shares are sold short, and the short interest ratio is 3.77. These numbers indicate that there might be a danger of short squeeze with 21% of the shares sold short and it might take 4 days for the shorts to cover the positions. This is more than the current short squeeze candidate $OPEN. But is this a good time to buy?
In my opinion the price of NASDAQ:ENPH has some more room to downside. Out target is with price between 20$ - 10$ we can go long NASDAQ:ENPH
Verdict: More downside possible in $ENPH. Go long between 20$ -10 $. 21% Short interest.
Golden Cross on GME WeeklyGME Chart Breakdown, Déjà Vu or Destiny? Something big just lit up the weekly chart, the 50 MA has pierced through the 200 MA, forming that golden cross traders dream about. On the weekly timeframe. Not a drill.
Now, let’s rewind. The last time this pattern appeared? January 2021. The infamous squeeze. Back then, GME didn’t just nudge upward, it catapulted nearly 4000%, going from a $3 floor to $120 in a blink.
Fast forward to today, new golden cross, new setup, and a $23 floor. If history rhymes even remotely, we’re staring down a hypothetical $1000 per share move. Yes, one thousand.
Is lightning about to strike twice? Stay tuned to find out!

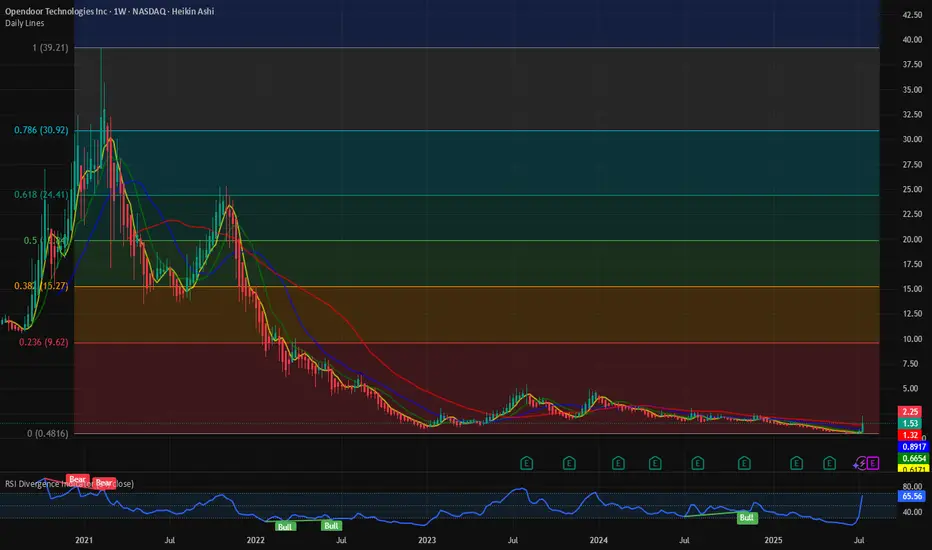
$OPEN: Ongoing short squeeze. What are the Fib levels telling? Are these the sign of a mature bull market? Drone cos, Space cos, SPACs, Biotech and Penny stocks are rallying. NASDAQ:OPEN is one such stock which hit the lowest of 0.5 $ last week before rallying more than 200% until July 18, 2025. NASDAQ:OPEN has a high short interest of almost 20% and short interest ratio is only 1.8 days to cover. Which means with 20% of the float short and the shorts needing 1.8 days to cover it might be ripe for a short squeeze if there is coordinated action by the bulls and a lot of call buying.
This might be a repeat of the meme stock rally scenario which we saw in 2021. But irrespective of the short situation from a technical standpoint what are the charts telling us. We go back to the tried and tested Fib Retracement levels to check the next price levels to watch for.
In my opinion the next price level to watch will be 9$ which might be a psychological level too. Many fund managers can only buy stocks if they are only above 10$. So, at that price we might see sellers offloading their gains. With next earnings call on Aug 5th and the Wallstreet bet crowd having a firm hold on the stock, we might see some explosive price action in the days and weeks to come before this settles The RSI is @ 60 which is not overbought, we can easily see 9 $ by end of summer if the social buzz continues.
Verdict: Buy NASDAQ:OPEN or Hold on to it if you have it. Offload some @ 9$.
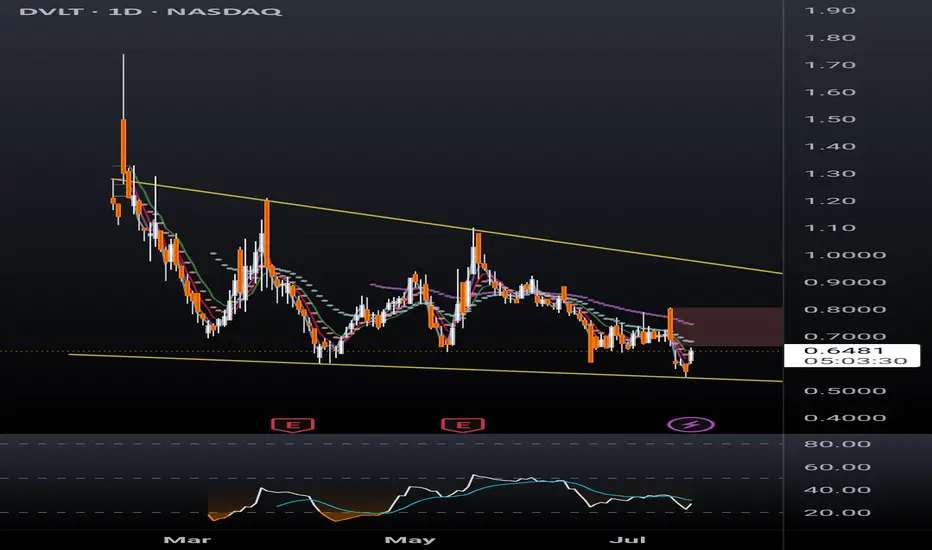
DVLT falling wedge, TP $1+DVLT a relatively new ticker is already drawing a lot of attention. Up 13% today after hitting new all time low yesterday, sure to catch a lot of eyes from retail investors. With recent news releases such as a licensing agreement with IBM, a lawsuit against naked short selling, and US patent allowances, target prices have been announced ranging from $3 to $11/share.
Disclaimer, this ticker is PRONE TO HEAVY DILUTION, however in order to remain listed on NASDAQ the SP will have to hit $1 and remain there. This being the case, the company must have something in the books to break upward out of this falling wedge and give shareholders a reason to stay with the company long term.
I'm just a cat not a financial advisor.
sideways in weekend downtrend⭐️GOLDEN INFORMATION:
Gold prices (XAU/USD) struggle to extend Thursday’s recovery from the $3,309 region—a one-week low—consolidating within a tight range during Friday’s Asian session. The US Dollar (USD) continues to retreat from its peak since June 23, pressured by dovish signals from Federal Reserve (Fed) Governor Christopher Waller.
Additionally, growing concerns over US President Donald Trump’s unpredictable trade policies and their potential consequences for global growth are keeping investors cautious, supporting demand for the safe-haven metal. These factors collectively help limit deeper losses in Gold, though the metal lacks clear bullish momentum for now.
⭐️Personal comments NOVA:
Gold price is moving sideways, accumulating in the downtrend line, not much fluctuation in weekend news
⭐️SET UP GOLD PRICE:
🔥SELL GOLD zone: 3381- 3379 SL 3386
TP1: $3370
TP2: $3360
TP3: $3350
🔥BUY GOLD zone: $3293-$3295 SL $3288
TP1: $3308
TP2: $3318
TP3: $3330
⭐️Technical analysis:
Based on technical indicators EMA 34, EMA89 and support resistance areas to set up a reasonable SELL order.
⭐️NOTE:
Note: Nova wishes traders to manage their capital well
- take the number of lots that match your capital
- Takeprofit equal to 4-6% of capital account
- Stoplose equal to 2-3% of capital account

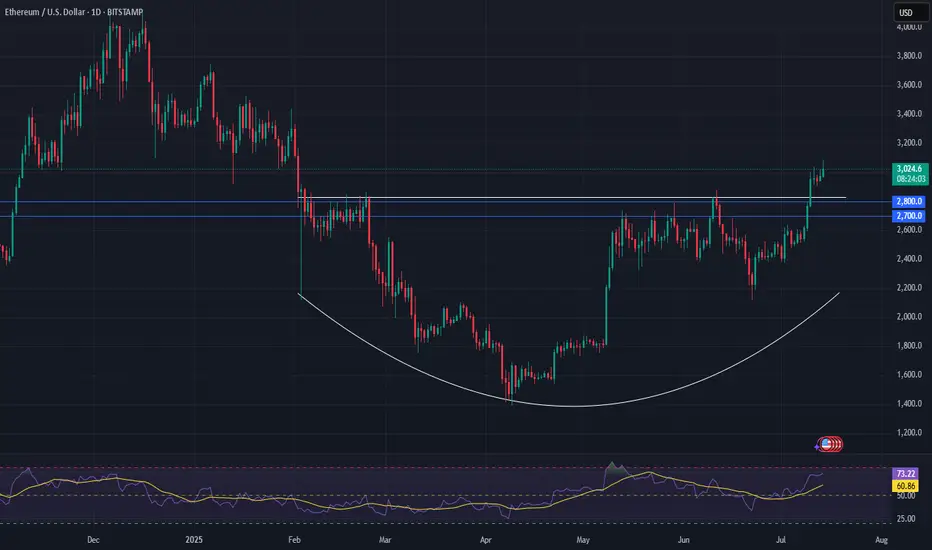
Ethereum Set for a Major Move — Watch $2,700–$2,800Epic Base Forming:
Ethereum is building a powerful base, and the fundamental dynamics have shifted significantly in recent weeks. With ETF fund flows hitting new highs, institutional interest is clearly growing.
Tight Setup for a Short Squeeze:
Meanwhile, the futures market shows a near-record short position, creating a high-potential setup for a massive short squeeze. Even without the chart, this kind of positioning mismatch is rare—and explosive.
Technical Watch Zone:
Ethereum is pressing into key resistance from a rounding bottom. The critical level to watch is $2,700–$2,800. A clean breakout here could ignite a sharp rally, with $4,000+ back on the table in short order.
This is a textbook setup—fundamentals, sentiment, and technicals are aligning.
#Ethereum #ETH #Crypto #TechnicalAnalysis #ShortSqueeze #ETFFlows #MarketSetup #Bullish #Altcoins #CryptoTrading #WatchList
Accumulated above 3300, market is sideways⭐️GOLDEN INFORMATION:
Gold prices posted modest gains on Wednesday, supported by a pullback in US Treasury yields, even as the US Dollar remained firm against major currencies. Market sentiment continued to be driven by trade developments, while the Federal Reserve’s latest meeting minutes revealed that policymakers are still leaning toward a rate cut in 2025. At the time of writing, XAU/USD is trading at $3,312, up 0.31%.
The FOMC minutes indicated that the majority of Fed officials believe a rate cut this year would be appropriate, with a few members open to the possibility of initiating a reduction as early as July—provided the economic data continues to align with expectations.
⭐️Personal comments NOVA:
Gold price recovered to 3320, mainly still accumulating, waiting psychology on current tariff situation of countries
⭐️SET UP GOLD PRICE:
🔥SELL GOLD zone: 3358- 3360 SL 3365
TP1: $3345
TP2: $3332
TP3: $3320
🔥BUY GOLD zone: $3245-$3247 SL $3240
TP1: $3256
TP2: $3269
TP3: $3280
⭐️Technical analysis:
Based on technical indicators EMA 34, EMA89 and support resistance areas to set up a reasonable BUY order.
⭐️NOTE:
Note: Nova wishes traders to manage their capital well
- take the number of lots that match your capital
- Takeprofit equal to 4-6% of capital account
- Stoplose equal to 2-3% of capital account

Cold shower for bitcoinAs I mentioned earlier — when gold cools down, Bitcoin tends to rise. And when gold climbs, Bitcoin usually takes a breather. Don’t forget this dynamic.

$OBLG #OBLG BUY ALERT FOAT IS LOCKED, $17.6+ then $60+ INCOMING!NASDAQ:OBLG #OBLG NASDAQ:OBLG My name is Landon Wogalter & this is the next NYSE:GME #GME NYSE:GME / NYSE:HKD #HKD NYSE:HKD type move, I am also the reason that NASDAQ:CHSN #CHSN NASDAQ:CHSN went to $44 that I called & locked the float from <1.80 & called for $30+, & even emailed the company in August 24’ stating that their stock would see $30+.
Oblong price targets are as follows:
17.6+ , 60+, 150+, 2900 past 404< #FLOAT IS #LOCKED THERE IS NO OTHER SET UPS LIKE THIS ON THE MARKET AND NEVER HAS BEEN. #ZERO #DEBT OBLG wants #parabolic (This is not promotion nor/or financial advice😘) I’m your daddy forever & ever.
