CRWV - Risk is clearly defined, making this a structured setup!CRWV - CURRENT PRICE : 79.32
CRWV is currently trading within a descending channel, indicating a medium-term corrective move after a prior uptrend. Importantly, price is now basing near the lower boundary of the channel, a zone where buyers previously showed interest.
Rather than breaking down aggressively, price action is stabilizing, suggesting selling pressure is starting to fade.
📈 Momentum Is Improving (Key Clue)
While price remains subdued, momentum indicators are telling a different story:
~ RSI (14):
RSI is recovering from lower levels and moving higher while price is still near the channel bottom. This signals improving momentum and early bullish divergence characteristics.
~ MACD:
MACD histogram is contracting, and the lines are starting to curl upward. This typically reflects weakening bearish momentum and the potential for a trend shift.
👉 When momentum improves while price holds support, it often precedes a technical rebound.
📌 This is a technical rebound setup — confirmation comes with continued momentum improvement and price holding support.
ENTRY PRICE : 77.00 - 79.32
FIRST TARGET : 96.00
SECOND TARGET : 110.00
SUPPORT : 63.80 (the low of BULLISH HARAMI pattern - 17 and 18 DECEMBER 2025 candle)
Shortterm


BTC break out ascending triangleBitcoin is completing an ascending triangle. It is possible a pull back to 93.400 area, hence we would be putting there our SL. Tentative target at 108.000 area.
This is for educational purposes and amusement only, not a recommendation or financial advice. The last thing you should do is follow the ideas of some random guy on the internet.

SOLUSDT 4hr – Trade idea Price is currently trading inside a range after a strong impulsive move down.
We are seeing multiple fair value gaps below and above, indicating unfinished business on both sides.
Context
Overall structure remains bearish
Price is consolidating near local support
Liquidity has been swept to the downside
Bullish idea
If price holds this support and reclaims the local fair value gap, a move towards the higher timeframe imbalance becomes likely.
Bearish idea
Failure to hold this area could lead to a continuation into the lower fair value gap, completing the downside move.
Are you expecting a range expansion up or further downside first?
MrC

IRCON May Deliver 30-40% in next 3-4 weeksIf I had to choose a good stock for next 3-4 weeks, I will choose NSE:IRCON
I will tell you WHY? 👇🏻
📚 First understand the catalyst, then the chart story.
Catalyst side:
Government infrastructure push
Railways, highways, tunnels, border infrastructure. Execution has picked up sharply across all these segments. IRCON is a pure execution play, not a policy-dependent story.
Order inflow momentum
Over the last few quarters, IRCON has reported continuous order wins. The market is now getting clear visibility that the next 2 to 3 years of revenue is largely locked in.
PSU re-rating phase
The market is shifting PSUs from the “low growth” bucket to the “capex growth” bucket. This is a PE expansion phase, not just an earnings story.
Rail budget and execution season.
January to February is usually an active period for railway-related stocks due to execution visibility and budget expectations.
📈Now the chart story, which is the most important part:
On the daily and weekly structure, a few things stand out clearly.
After a long consolidation, a strong base has formed.
Multiple shakeouts happened, and weak hands are already out.
Price is making higher lows, showing sellers are getting absorbed.
Recent candles are overlapping and the range has tightened, which means energy is building.
This is a typical pre-expansion structure.
The market is spending time here, but price is not falling. That is usually the biggest clue that a large move is pending.
Trade plan framework.
Entry should be above the consolidation high. No need to be aggressive inside the range.
Stop-loss should be below the last higher low.
Targets.
Target 1 can be around 18 to 22 percent for a fast move.
Target 2 can stretch to 35 to 50 percent if momentum continues.
Why a 30 to 40 percent move is possible in 2 to 3 weeks.
It is a small to midcap PSU.
Free float is limited.
When PSU momentum kicks in, moves are not linear, they turn vertical.
If the breakout comes with volume and pullbacks remain shallow, the rally usually extends.
Important mindset.
This is not a sure-shot trade.
This is a high-probability, high-momentum window.
Risk is defined. Upside is asymmetric. That is the real edge here.

READY TECH HOLDINGS LTDREADY TECH HOLDINGS LTD made double with divergence along MACD cross over and RSI UPTICK. We can go long with first target of $2.77 and Final target of $3.5 in short tern view.
We can seen minor support level at $2.9.
PLease make your own analysis before taking any trade. ASX:RDY

BTC 4H Chart Review1. Market Structure: Rising Channel (Upward Wedge / Rising Channel)
The chart clearly shows that BTC is moving within an ascending channel, with:
the upper boundary around USD 95,000–95,500,
the lower boundary currently reaching USD 86,500–87,000.
This is a potentially exhausting formation, and lower breakouts are often dynamic.
2. Current Situation: Rebound from the upper band and Stoch RSI overbought → decline
The price has stopped exactly at the upper resistance of the channel and has begun a correction.
This is typical behavior – the market usually returns to the middle or lower edge of the channel.
Stoch RSI on 4H – has made a strong reversal from the overbought zone
→ a signal for a short-term correction has already been generated.
3. Support Levels (most important):
🔴 USD 90,500–90,000
A very important zone – previous resistance ⇒ now support.
Breakout = increased risk of a deeper breakout.
🔴 USD 88,500–88,000
A strong demand level for the 4-hour period, also aligned with the MA and local lows.
🔴 USD 86,500–87,000
The lower band of the channel – the most likely place for buyers to become active.
4. Resistance Levels:
🟢 USD 94,800
Previous local high – a breakout will be bullish.
🟢 USD 98,000–98,900
Strong resistance on the chart, likely target after a breakout of the channel to the upside.
5. Scenarios for the coming hours:
📉 Correction scenario (more likely based on the Stoch RSI)
The price could fall to one of the following zones:
92,000 → test in progress
90,500–90,000 USD → main market decision level
If it loses 90,000 → a move to 88,500–88,000 is natural.
Deeper correction: test of the lower channel line – ~86,500 USD.
In this scenario, we remain in an uptrend unless the channel breaks below.
📈 Uptrend scenario
The current decline could only be:
a local correction,
a retest of the previous demand zone.
Uptrend condition:
➡️ 4-hour candlestick retracement and close above ~94,000 USD.
Then the target:
94,800
95,500
and after the channel breakout → $98,000–$99,000

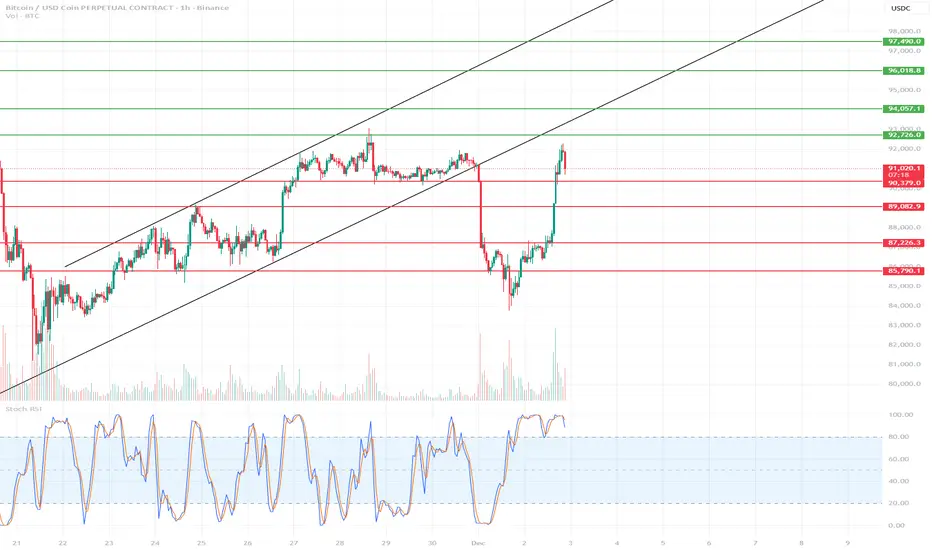
BTC Short-Term Chart 1H🔍 1. Current Market Situation
BTC has made a very strong rebound from around ~87,000 and reached the key resistance zone of 92,700–93,200, where the first signs of a slowdown are currently visible.
The Stoch RSI on the 1-hour timeframe is heavily overbought, which usually suggests a local correction or at least consolidation.
🔴 2. Key Resistance Levels (Short-Term)
92,726 → current resistance; the price has rebounded precisely from this zone.
94,057 → next strong resistance if BTC breaks above 92.7k.
96,018–96,866 → strong supply zone; only after breaking this zone will the uptrend resume in full force.
🟢 3. Major Supports (Short-Term)
90,379 – 90,990 → nearest intraday support zone
89,082 → strong support that halted the previous decline
87,726 → key to the upward structure
85,790 → critical level, a breakout opens the door to a deeper correction
📉 4. Short-Term Baseline Scenario
Most likely in the coming hours:
✔ Scenario A – correction from the current level (preferred)
Stoch RSI overbought
Price rejected from the 92.7k resistance
Large vertical move → market needs to cool down
Correction Targets:
90,900–90,300 → first TP/buy zone
89,100 → deeper correction but still healthy.
Long signal:
Return of h1 candle closes > 91.3k after a pullback.
✔ Scenario B – breakout of 92.7k and continued growth
If BTC breaks and holds above 93,200, upward momentum resumes.
Targets:
94,057
96,000–96,800 (strong supply zone – take profit area)
BTC Short-Term 15m Chart📉 BTC 15M — Short-Term Analysis
1. Key Levels from the Chart
Support
$90,400–$90,450 – strong, repeatedly tested (orange zone).
$90,178 – lower support (thin red line).
$89,460 – deeper daily support.
Resistance
$90,900–$91,000 – local resistance zone.
$91,214–$91,545 – SMA 72 / SMA 200 (yellow and blue) = strong dynamic resistance.
$91,800–$92,200 – higher structural resistance.
🧠 2. Market Structure
Short-term trend (15m)
Price remains below the SMA 200 and SMA 72 → bearish momentum.
Lower highs and lower lows are visible → bearish structure.
Narrower range: 90,400 – 90,900 → price compression / consolidation.
📊 3. Indicators
MACD – neutral / slightly bearish
Histogram hovers around zero → lack of strong momentum.
Recent downward crossover → downward pressure.
RSI – 48 (neutral)
Not oversold yet, but:
RSI is forming a bearish divergence from previous highs.
RSI often bounces from 50 in a downtrend → confirms bearish pressure.
🔎 4. What's happening now?
The price is retesting the $90,400 zone, a key defensive level for bulls.
The structure indicates:
supply pressure,
buyers exhausting themselves below the 200 SMA,
possible breakout below if 90,400 breaks.
🎯 5. Short-Term Scenarios (15m)
🔻 Bearish Scenario (more likely)
If 90,400 falls:
Target 1: 90,180
Target 2: 89,460
Target 3: 88,960
The structure strongly suggests this because:
Price below the 200 SMA
Weak momentum
No strong rebound from the lows
🔼 Bullish Scenario (only after breaking 90,900)
If the market rebounds from 90,400 and breaks 90,900:
Target 1: 91,200 (SMA 72 + 200)
Target 2: 91,550
Target 3: 91 800

Review and plan for 27th November 2025 Nifty future and banknifty future analysis and intraday plan.
This video is for information/education purpose only. you are 100% responsible for any actions you take by reading/viewing this post.
please consult your financial advisor before taking any action.
----Vinaykumar hiremath, CMT

BTC/USDT 1H Short-Term (maintaining support)📉 MARKET STRUCTURE
1. Trend
The chart shows a clear falling wedge, which statistically is a pro-growth pattern—breakouts most often occur upwards.
Upper wedge line: ~96,400 USDT
Lower wedge line: ~93,750 USDT
The price has just rebounded from the lower edge—this is a key demand level.
📊 SUPPORT AND RESISTANCE LEVELS
Support (demand):
93,750 – lower wedge line
93,300 – strong chart level
92,650 – lower support, strong volume reaction
Resistance (supply):
95,000 – 95,450 – local resistance (supply often returns here)
96,400 – resistance key + upper wedge line
📈 INDICATORS
Stoch RSI (1h)
We have rebounded from the oversold level.
The %K line is breaking the %D line upwards → a signal of a potential short-term rebound.
MACD
The histogram is decreasing, but the first signs of flattening are visible.
The MACD line is still below the signal line, but is approaching → momentum for a reversal is beginning.
Volume
Volume increased on bearish candles, but near the bottom, two demand candles with increased volume appeared → buyers reacted at support.
📌 CONCLUSIONS
✔️ Bullish short-term scenario (more likely at this point):
Bounce from 93,750 + rising indicators = local upward correction.
Targets:
94,800 – 95,000
95,450
96,400 (upper band of the wedge — an important decision point)
❌ Bearish scenario (if support breaks):
A drop below 93,750 on strong volume opens the door to:
93,300
92,650 (a large defensive level — aggressive demand could enter here)

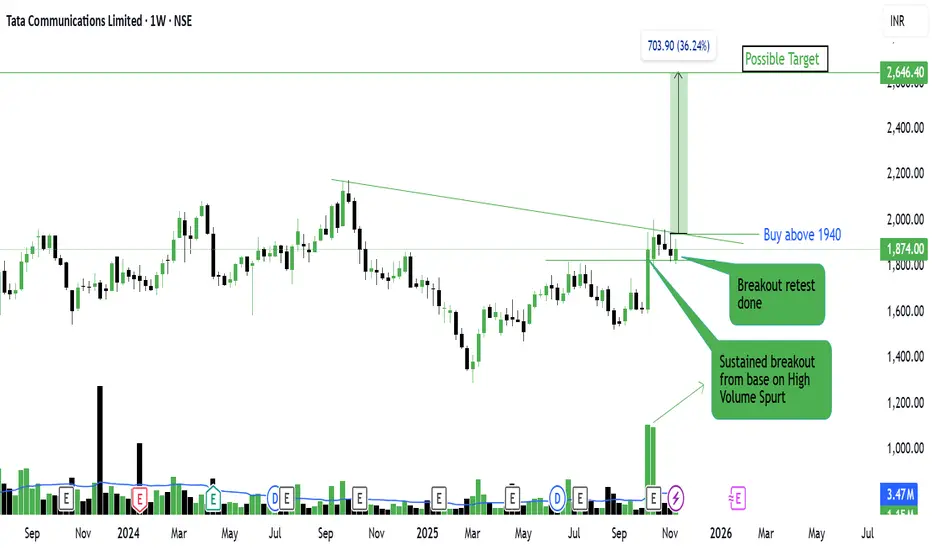
Tata Communications Ltd – Breakout Retest CompletedTata Communications Ltd – Breakout Retest Completed, Ready for Next Leg
NSE:TATACOMM
📈 Pattern & Setup:
Tata Communications has completed a clean **base breakout followed by a successful retest** on the weekly chart. The stock broke out from a long consolidation base with a strong volume spike, confirming genuine accumulation rather than a false move.
Post breakout, the price pulled back exactly to retest the previous resistance around 1750–1800, where it found strong buying support. The higher lows formation and sustained green candles now indicate that **buyers are regaining control**.
With the base structure holding firm and volumes picking up again, a move above 1940 could trigger the next rally phase toward 2600+.
📝 Trade Plan:
✍Entry: Above 1940 (sustained breakout confirmation)
🚩Stop-Loss: 1780 (below retest zone)
🎯Targets:
Target 1 → 2200
Target 2 → 2640 (around 36% potential upside)
💡 Pyramiding Strategy:
1. Enter 60% position once price breaks above 1940
2. Add remaining 40% above 2000 with strong volume
3. Trail stop-loss to 1860 once price sustains above 2100
🧠 Logic Behind the Setup:
This is a **base breakout with retest confirmation** — one of the most reliable continuation setups. The stock has shown strength by holding above its previous resistance zone even after a pullback, which now acts as fresh support.
The volume spurt on the breakout followed by low-volume retest further validates institutional participation and absorption of supply.
Keep Learning. Keep Earning.
Let’s grow together 📚🎯
🔴Disclaimer:
This analysis is for educational purposes only. Not a buy/sell recommendation. Please do your own research or consult your financial advisor before trading.
Tata Elxsi Ltd – Descending Trendline Breakout WatchTata Elxsi Ltd – Descending Trendline Breakout Watch
NSE:TATAELXSI
📈 Pattern & Setup:
Tata Elxsi has been in a **controlled downtrend** for the past few months, forming a clean descending trendline with multiple shakeouts along the way. Recently, the stock printed a cluster of shakeouts near the 5100–5200 zone — a sign of **absorption after supply exhaustion**.
The last few candles show strong buying pressure off the lows with improving volume, suggesting smart money re-entry. The structure now looks like a **base formation within a larger descending wedge**, where a breakout above 5450–5500 could trigger a trend reversal toward 6600+.
📝 Trade Plan:
✍Entry: Above 5500 (trendline breakout confirmation)
🚩Stop-Loss: 5200 (below recent swing low)
🎯Targets:
Target 1 → 6000
Target 2 → 6650 (around 21% potential upside)
💡 Pyramiding Strategy:
1. Enter 60% position above 5500 on breakout candle
2. Add remaining 40% above 5650 after volume confirmation
3. Trail stop-loss to 5350 once stock sustains above 5900
🧠 Logic Behind the Setup:
The stock’s repeated shakeouts show that weak hands have likely exited. The price is now coiling tighter beneath the trendline — a classic **VCP (volatility contraction pattern)** characteristic. This compression of price and volume often precedes a strong expansion move.
Keep Learning. Keep Earning.
Let’s grow together 📚🎯
🔴Disclaimer:
This analysis is for educational purposes only. Not a buy/sell recommendation. Please do your own research or consult your financial advisor before trading.

Welspun Enterprises Ltd – Ascending Triangle Breakout SetupWelspun Enterprises Ltd – Ascending Triangle Breakout Setup
NSE:WELENT
📈 Pattern & Setup:
Welspun Enterprises is forming a classic ascending triangle pattern — a strong continuation structure that often precedes sharp breakouts. The series of higher lows since mid-October clearly shows accumulation pressure building beneath resistance around 570.
Each shakeout in this structure has been quickly absorbed by buyers, a strong sign of institutional interest. The latest candle is again testing the resistance zone with volume picking up, indicating breakout momentum is brewing.
A confirmed close above 575 can open the gates for a 19% upside move toward the 680 zone.
📝 Trade Plan:
✍Entry: Above 575 (confirmation of breakout)
🚩Stop-Loss: 540 (below recent higher low)
🎯Targets:
Target 1 → 620
Target 2 → 680 (around 19% potential move)
💡 Pyramiding Strategy:
1. Enter 60% above 575 with a strong volume breakout
2. Add 40% above 590 after price sustains above resistance
3. Trail stop-loss to 555 once the stock trades above 600
🧠 Logic Behind the Setup:
The pattern combines multiple Wyckoff elements — repeated shakeouts, steady higher lows, and a clear horizontal supply zone at the top. This shows that sellers are being gradually overpowered while demand is increasing.
Volume contraction within the triangle and expansion near resistance further strengthen the probability of a sustained breakout.
Keep Learning. Keep Earning.
Let’s grow together 📚🎯
🔴Disclaimer:
This analysis is for educational purposes only. Not a buy/sell recommendation. Please do your own research or consult your financial advisor before trading.

BTC/USDT 1H Chart Short-Term📉 Descending Channel (black lines)
The price previously moved within a clear descending channel, which was broken upward.
A breakout from the channel signals a change in the short-term trend – from supply pressure to an attempted rebound.
From a technical perspective, a breakout from a descending channel often leads to an upward correction, the extent of which is at least the midpoint of the previous downward impulse.
🔷 Triangle Formation (blue lines)
After breaking out of the channel, the price formed a symmetrical triangle (consolidation) – a sign of market indecision.
Triangles of this type are often trend continuation patterns, but in this context – after a breakout from a descending channel – an upward breakout (i.e., a further upward rebound) is more likely.
The key resistance level to watch is $111,145 – a breakout with volume confirmation would open the way to $112,320 and then $113,921.
🧭 Key Technical Levels
Resistance:
$111,145 – local resistance (upper boundary of the consolidation/triangle).
$112,320 – another strong resistance level from the previous local high.
$113,921 – major medium-term resistance.
Support:
$110,442 – lower boundary of the triangle (short-term support).
$108,793 – support after the recent bounce.
$107,285 – next demand level.
$104,969 – bulls' defensive boundary in the broader context.
📊 Stoch RSI (bottom of the chart)
The Stoch RSI oscillator is currently in a rebound phase from the neutral level (~40–60).
If the lines (blue and orange) cross upwards and enter the zone above 80, this could confirm bullish momentum and a breakout from the triangle to the upside.
However, a rejection from 60 and a further drop below 20 would signal a false breakout and a possible retest of USD 108,800.
🔎 Scenario Summary
➡️ Upside Scenario (more likely):
Breakout from the triangle to the upside (confirmed by a 1-hour candle above USD 111,150).
Potential move to USD 112,300 → USD 113,900.
Momentum indicators support a rebound if the Stoch RSI maintains its upward trend.
⬇️ Downside scenario (alternative):
Unsuccessful breakout and return below $110,400.
A correction to $108,800 can then be expected, and if this level is broken, a further decline to $107,300.

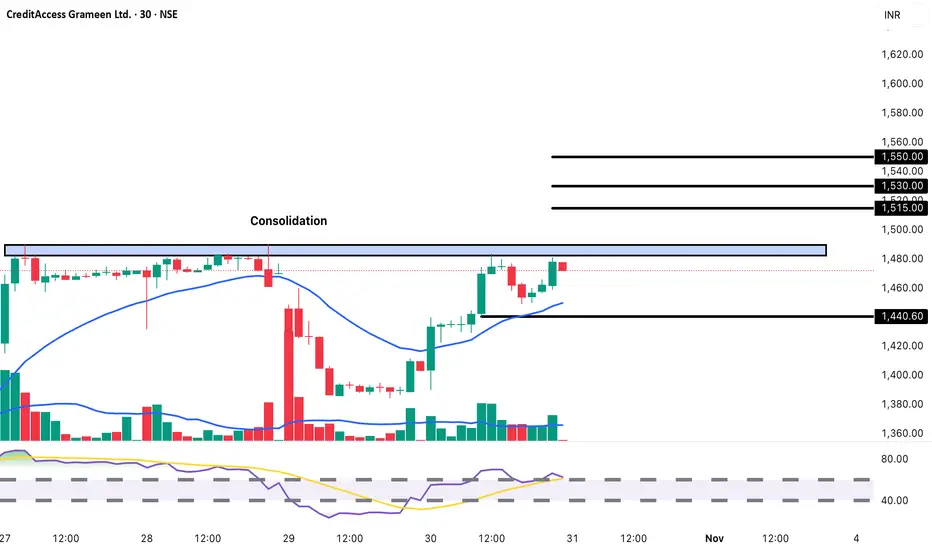
CreditAccess Grameen: Rectangle Breakout Setup BUY Setup 🏦
Entry: ₹1,472-1,478 (Current Level)
Target 1: ₹1,515-1,520
Target 2: ₹1,530-1,540
Target 3: ₹1,550-1,560 (Extended)
Stop Loss: ₹1,440
Technical Rationale:
Consolidating within tight range (1,440-1,495) on 30-min chart
Trading near support at 1,470 level - good risk-reward entry
Price holding above key support at 1,440 zone (black line)
RSI at 62.37 - neutral to bullish, room for upside
Volume showing accumulation pattern (89.09K)
Microfinance/NBFC sector showing resilience
Trading well above EMA (1,449.94) on larger timeframe
Rectangle consolidation pattern - breakout imminent
Multiple resistance levels clearly marked: 1,515, 1,530, 1,550
Support zone well-established at 1,440-1,450
Risk-Reward: Good 1:2.5+ ratio
Pattern: Rectangle consolidation on 30-min chart - typically precedes directional move
Strategy: Intraday to short-term swing - Book 40% at T1 (1,517), 30% at T2 (1,535), trail remaining with SL at 1,480 after T1
Key Levels:
Resistance Zone: 1,480-1,495 (upper rectangle)
Strong Resistance: 1,515, 1,530, 1,550
Critical Support: 1,440, 1,420
Timeframe: 30-minute chart for short-term traders/scalpers
Note: Currently showing minor weakness (-0.42%) but holding support well. Wait for break above 1,480 for confirmation or enter at current support levels with tight SL.
Disclaimer: For educational purposes only. Not SEBI registered.
20% long play UAMYI have noticed that healthy companies with bull runs tend to have major pullbacks of ~50-60% before short term reversal. I believe UAMY is probably topped out after the recent blow off bull run, but here we are at 56% down after the recent ATH, RSI at a local extreme low. I am buying here and TP around $11.4, unless there are indications for a greater upward move. SL at $8.7. If this fails $8.14 is next support.

BTC/USD 1h short-term🧭 General context
• Bitcoin price is ~$114,470.
• The short-term trend remains upwards, which is confirmed by the black trendline.
• The last upward impulse brought the price from ~ USD 111,000 to ~ USD 117,000.
• Currently, the price is testing the support zone after a short correction.
⸻
📊 Key technical levels
• Resistances (green):
• USD 117,815 – local peak, strong resistance (potential TP for longs).
• USD 116,545 – medium resistance, possible retest in the short term.
• $115,518 – lower resistance, bulls decision point.
• Support (red):
• USD 114,667 – currently tested level (important intraday support).
• USD 113,545 – another strong support (close to trendline).
• USD 111,915 – the limit after which the upward trend may reverse.
⸻
⚙️ Trendline
• The trend line runs from approximately USD 110,000 and connects subsequent lows.
• The price is currently close to the trendline, so:
• Rebound → continuation of the upward trend,
• Breakout → possible decline to 113,500 or lower (up to USD 111,900).
⸻
📈 Oscillator (Stochastic RSI)
• It is located close to the oversold zone (approx. 8 p.m.).
• This means that the market is close to a potential rebound - a bullish signal (if the %K and %D lines cross upwards).

BTC/USD 1H chart short-term📊 Market structure:
• Current price: ~$113,300
• Trend: A short-term uptrend - evidenced by rising lows and rising highs, as well as price remaining above the black trendline.
• The chart shows Bitcoin testing resistance at $114,089, following a strong breakout earlier.
⸻
🧭 Key Levels:
Resistances (green lines):
1. USD 114,089 – the closest resistance that the price is currently testing.
2. USD 116,057 – another strong resistance, potential target after breakout.
3. USD 118,681 – main resistance level from the higher time frame (H4/D1).
Support (red lines):
1. USD 112,156 – first local support (close to the trend line).
2. USD 109,567 – medium-term support, key to maintaining the growth structure.
3. $107,702 – Strong support where institutional buy orders are likely.
⸻
📈 Trendline:
The black upward trendline leads through the recent local lows.
➡️ As long as the price stays above it, the trend remains bullish.
➡️ Breaking this line down would be the first signal of a weakening trend and a correction towards USD 112,150-111,000.
⸻
⚙️ Stochastic RSI (bottom indicator):
• Currently starting to move down from overbought levels (above 80).
• This indicates a possible short-term downward correction or consolidation.
• If the indicator drops below 40 while keeping the price above the trendline, it may be a good opportunity to go long again.

BTC Easy Lond & 8 RR ProfitBTC Long Situation.
My Easy Plan, Trategy and Steps:
- New Daily Imbalances
- 4h Imbalance
- 15m Imbalance and second return to it
- 3m BOS & Imbalance
Result: is coming soon (already 6rr, you can take)

BNB/USDT 1H chart short-term📊 1. Trend structure
• We see an upward channel (black trend lines) - the price rebounds from the lower support line and gradually heads upwards.
• Currently, the rate oscillates in the middle zone of the channel - approx. 1,115 USDT.
• As long as the lower trend line (approx. USDT 1,090) holds, the bullish structure is intact.
⸻
🟩 2. Support and resistance zones
Support:
• 1,106 USDT → local intraday support (already tested several times).
• 1,090 USDT → stronger support + trend line.
• 1,056 USDT and 1,016 USDT → lower zones, in case of a stronger correction.
Resistance:
• 1,125 USDT → local resistance that is currently blocking the upward move.
• 1,148 USDT → another strong resistance, after breaking it, a test of 1,174 USDT (upper border of the channel) is possible.
⸻
📈 3. Indicator – Stochastic RSI
• Currently, the Stoch RSI lines are starting to bounce from bottom to top, after previously entering the oversold zone.
➡️ This is a short-term rebound signal, but not yet a strong buy signal - confirmation of the break through of the ~1,125 USDT level is needed.
⸻
⚙️ 4. Technical scenarios
Bullish:
• Maintaining 1,106–1,090 USDT and breaking above 1,125 USDT → target 1,148 → 1,174 USDT.
• The trend support at 1,090 USDT acts as a buying zone for swing traders.
Bearish:
• A break below 1,090 USDT will negate the channel structure → a possible drop to 1,056 USDT and then 1,016 USDT.
• The RSI will then likely enter a strong oversold zone.

EVAA / USDT – Bullish Setup (4H)📈 **EVAA / USDT – Bullish Setup (4H)**
Price has pulled back to the 0.618 Fibonacci retracement after a strong bullish impulse, and is now showing signs of continuation within the ascending channel.
If the price holds above **6.8 – 6.9**, we could see another push upward toward the upper channel resistance.
🎯 **Targets:**
1. 7.5
2. 8.0
3. 9.4
🛑 **Stop Loss:** clear close below **6.2**
I expect the price to continue its bullish movement based on market structure and Fibonacci confluence.
📘 *This analysis is based on personal market study – DYOR / Not financial advice.*

The Best DEX & Token PotentialAVNT #LONG
Potential for 130% growth .
You can go long on spot or with a small leverage.
Token from a DEX, the exchange is good , the drop was awesome , staking their token with a good interest rate is available, the team's cliff is long, so there is an incentive to push the price up .
