BNB/USDT 1H chart short-term📊 1. Trend structure
• We see an upward channel (black trend lines) - the price rebounds from the lower support line and gradually heads upwards.
• Currently, the rate oscillates in the middle zone of the channel - approx. 1,115 USDT.
• As long as the lower trend line (approx. USDT 1,090) holds, the bullish structure is intact.
⸻
🟩 2. Support and resistance zones
Support:
• 1,106 USDT → local intraday support (already tested several times).
• 1,090 USDT → stronger support + trend line.
• 1,056 USDT and 1,016 USDT → lower zones, in case of a stronger correction.
Resistance:
• 1,125 USDT → local resistance that is currently blocking the upward move.
• 1,148 USDT → another strong resistance, after breaking it, a test of 1,174 USDT (upper border of the channel) is possible.
⸻
📈 3. Indicator – Stochastic RSI
• Currently, the Stoch RSI lines are starting to bounce from bottom to top, after previously entering the oversold zone.
➡️ This is a short-term rebound signal, but not yet a strong buy signal - confirmation of the break through of the ~1,125 USDT level is needed.
⸻
⚙️ 4. Technical scenarios
Bullish:
• Maintaining 1,106–1,090 USDT and breaking above 1,125 USDT → target 1,148 → 1,174 USDT.
• The trend support at 1,090 USDT acts as a buying zone for swing traders.
Bearish:
• A break below 1,090 USDT will negate the channel structure → a possible drop to 1,056 USDT and then 1,016 USDT.
• The RSI will then likely enter a strong oversold zone.
Shortterm

EVAA / USDT – Bullish Setup (4H)📈 **EVAA / USDT – Bullish Setup (4H)**
Price has pulled back to the 0.618 Fibonacci retracement after a strong bullish impulse, and is now showing signs of continuation within the ascending channel.
If the price holds above **6.8 – 6.9**, we could see another push upward toward the upper channel resistance.
🎯 **Targets:**
1. 7.5
2. 8.0
3. 9.4
🛑 **Stop Loss:** clear close below **6.2**
I expect the price to continue its bullish movement based on market structure and Fibonacci confluence.
📘 *This analysis is based on personal market study – DYOR / Not financial advice.*

The Best DEX & Token PotentialAVNT #LONG
Potential for 130% growth .
You can go long on spot or with a small leverage.
Token from a DEX, the exchange is good , the drop was awesome , staking their token with a good interest rate is available, the team's cliff is long, so there is an incentive to push the price up .

ETH/USDT 4H CHART REVIEW🔍 Overall market structure
• Ethereum is moving in a descending triangle/converging channel (yellow trend lines).
• The upper trend line acts as strong resistance (~$4,000-$4,150).
• The lower trend line (rising) provides key support around ~$3,730-$3,750.
⸻
📊 Key levels
Resistances:
• $3,875 – local resistance, where the price rebounded several times.
• $3,990 – another resistance resulting from the yellow trend line.
• $4,143 – main resistance in the breakout zone of the formation (potential target after breaking the downtrend).
Support:
• $3,808 – short-term support.
• $3,733 – important level within the formation (lower yellow trendline).
• $3,637 – strong support that should not be broken while maintaining bullish sentiment.
⸻
📈 Indicators
MACD:
• MACD and signal lines are close to each other - no clear momentum.
• Histogram decreases → possible short-term weakness or consolidation.
RSI:
• RSI indicator around 45–50 → neutral, with no clear advantage of buyers or sellers.
• No divergence, but potential for a rebound if RSI drops to ~40 and rebounds.

BTC/USDT Short-Term 4H Review Chart🧩 Market Structure
After a strong decline, the price has rebounded, creating a local uptrend (marked with the orange trend line).
The price has currently broken through the uptrend from below, which is the first sign of bullish weakening.
The current candle is testing this line from below—a classic trendline retracement (potential pullback).
📉 Support and Resistance Levels
From the chart:
Resistance (green lines):
113.868 USDT — key high.
111.240 USDT — strong resistance (previous local high).
109.133 USDT — currently being tested from below (confluence with the trendline).
Support (red lines):
107.524 USDT — first support.
105.253 USDT — lower support, a boundary for maintaining the higher low structure.
103,582 USDT — key support, below which the upward structure will be negated.
🔍 Volume
Increasing volume is visible on the red candles — selling dominated the trend breakout.
The last green candle has a large lower wick and slightly higher volume — a signal of a possible defensive reaction from the bulls, but without confirmation of continuation.
📊 Stochastic RSI (oscillator)
Located in the oversold zone (around 20).
The %K line is starting to curve slightly upward — it could signal a short-term rebound, but until there's a crossover and confirmation, this is only an early signal.
📈 Scenarios
✅ Bullish:
If BTC rebounds and closes the candle above 109,100 USDT, it will be a false breakout of the trend and a possible upward move towards 111,200–113,800 USDT.
Support to be maintained: 107,500 USDT.
❌ Bearish:
If the price remains below the trendline and 109,000 USDT, and then breaks above 107,500 USDT, the path opens to:
105,200 USDT, and then
103,500 USDT (strong support and potential buy zone).
⚙️ Summary
Short-term trend: neutral → slightly downward (after the trendline breakout).
Key level to watch: 109,100 USDT (retest trendline).
Potential support: 107,500 → 105,200 → 103,500.
Momentum (Stoch RSI): A bullish rebound is possible, but confirmation is lacking.

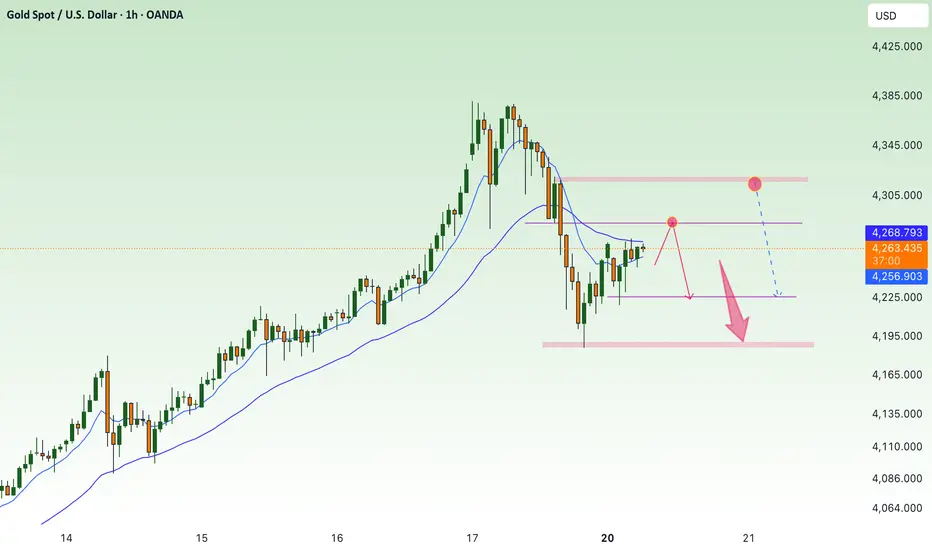
Short term correction - down below 4300⭐️GOLDEN INFORMATION:
Gold (XAU/USD) dips to around $4,245 in early Asian trading on Monday, pausing after its record-breaking rally. The pullback comes as physical demand eases following the festive surge, while traders await China’s Q3 GDP, Industrial Production, and Retail Sales data later in the day. Last week, the metal gained support from India’s festive demand and robust ETF inflows. However, with fundamentals largely priced in, a short-term correction or consolidation appears likely.
⭐️Personal comments NOVA:
Gold price started to accumulate, adjusted down below 4300 at the beginning of the week. Short-term downtrend
⭐️SET UP GOLD PRICE:
🔥SELL GOLD zone: 4320 - 4322 SL 4327
TP1: $4310
TP2: $4300
TP3: $4283
🔥BUY GOLD zone: $4222-$4224 SL $4217
TP1: $4235
TP2: $4250
TP3: $4270
⭐️Technical analysis:
Based on technical indicators EMA 34, EMA89 and support resistance areas to set up a reasonable SELL order.
⭐️NOTE:
Note: Nova wishes traders to manage their capital well
- take the number of lots that match your capital
- Takeprofit equal to 4-6% of capital account
- Stoplose equal to 2-3% of capital account
INFINIT Ready for a Bullish Breakout The price is currently holding above a strong support zone after a correction from the previous high.
If the price breaks and holds above the 0.171 – 0.173 resistance area, we can expect a bullish continuation toward the Fibonacci levels:
🎯 Targets:
0.178
0.184
0.192
🛑 Stop Loss: clear break below 0.151
I expect the price to reach these levels based on market structure and recent price behavior.
The overall bias remains bullish as long as the price stays above support and confirms the breakout.
📘 This analysis is based on personal market study – DYOR / Not financial advice.

The LINK/USDT will probably go lower📉 Trend and Structure
The price is currently trading within a descending channel (yellow lines), which has been in place since late August.
The price attempted to break out of the channel at the top around $23.40, but buyers lacked strength – it was rejected at resistance and fell back below the downtrend line.
Currently, the price is just below the upper edge of the channel and below the 50/200 EMA, confirming that the medium-term trend remains downward.
🔹 Key Technical Levels
Support:
$21.40 – local support, which is currently being tested.
$20.80 – strong support from previous price reactions.
$19.68 – lower boundary of the channel, a very important level for bulls.
Resistance:
$22.20–$22.70 – zone of the 50/200 EMA and previous rejections.
USD 23.40 – the last local high and the point of the false breakout.
USD 24.90 and USD 25.50 – key breakout levels from the channel, paving the way to USD 27–28.
⚙️ Technical Indicators
MACD:
The MACD line has crossed the upside signal → sell signal.
The histogram has turned slightly negative, indicating a loss of upward momentum.
RSI (14):
Currently around 51, with a slight downward slope.
Neutral, but with a strong upside – a drop to around 40 is possible before the bulls attempt a rebound.
🧭 Scenarios
🔻 Bearish Scenario (more likely)
If the price remains below $22 and the channel is not broken, a further decline to $20.80 is possible, or even a test of the lower band of the channel at $19.70.
Confirmation will be a close of the 4-hour candle below $21.40.
🔺 Bullish Scenario (less likely at this time)
If the bulls reclaim $22.70–$23.00 and close the 4-hour candle above it, a breakout from the channel could occur.
The targets will then be $23.40, $24.90, and $25.50, respectively.
Increased volume and confirmation on the MACD (bullish cross) are required.

BTC Short-Term 1H🔹 General Context
On the chart, we see that Bitcoin:
Has broken the local downtrend line (yellow line), suggesting an attempt to change the short-term trend.
It is currently consolidating just above the 50/200 EMA, which is a positive sign for bulls.
We also see a MACD crossover in the positive zone and an RSI rising, but not yet overloaded (around 52–60).
🔸 Key Technical Levels
Support:
122.460 USDT – strong local support, aligned with previous lows and the 200 EMA.
121.900 USDT – next support, also marked by the blue 200 EMA.
120.600 USDT – deeper support, recent significant low.
Resistance:
123,700 – 123,900 USDT – resistance zone where the price is currently stalling (there was a reaction after the trendline breakout).
124,700 USDT – next resistance level (local high).
125,700 USDT – strong resistance resulting from previous swing highs.
🔸 Technical Indicators
📈 EMA 50/200 (golden cross on 1 hour):
The 50 EMA is breaking below the 200 EMA – a classic bullish signal (Golden Cross).
Confirmation requires the price to stay above 122,800 USDT for several H1 candles.
📊 MACD:
The histogram has turned positive, the MACD line is breaking above the signal line – momentum is increasing.
There is no strong negative divergence yet, so the signal is clear.
💪 RSI:
Value ~52–60 – moderately bullish.
It is not overbought yet, so there is potential for further upward movement.
🔹 Scenarios
✅ Bullish Scenario:
Sustainability above 122,800 USDT.
A breakout and retest of the 123,700–123,900 USDT resistance could open the way to 124,700 USDT and then 125,700 USDT.
The MACD and RSI support this scenario.
❌ Bearish Scenario:
A reversal from the current level and a decline below 122,400 USDT.
A retest of 121,900 USDT and a possible deepening correction to 120,600 USDT is possible.

Privi Specialty Chemicals – Trendline Breakout in ActionPrivi Specialty Chemicals – Trendline Breakout in Action
NSE:PRIVISCL
📈Pattern & Setup:
Privi Specialty Chemicals is displaying a **descending trendline breakout** on the daily chart. After weeks of consolidation near the 2300–2500 range, the stock has now broken above its trendline resistance with strong bullish momentum and healthy volume — a solid technical confirmation of breakout strength.
This breakout follows a **rounding base formation**, where the stock first paused, built strength, and is now resuming its prior uptrend. The price structure indicates that supply is getting absorbed and fresh demand is pushing prices higher.
Once the stock sustains above 2520, it can extend its move toward 3000+ levels — marking a potential 20% upside.
📝 Trade Plan:
Entry: Above 2520 with strong volume confirmation.
🚩Stop-Loss: 2400 (below recent swing low).
🎯Targets:
Target 1 → 2750 (short-term move).
Target 2 → 3010 (measured move target, ~20.7% potential).
💡Pyramiding Strategy:
1. Enter 50% position on breakout above 2520.
2. Add remaining position above 2600 after retest confirmation.
3. Trail stop-loss to 2470 once price sustains above 2650.
🧠Logic Behind Selecting this Trade:
The breakout setup is clean — long consolidation, higher lows, volume support, and a decisive trendline breach. This kind of breakout generally attracts momentum traders and institutional flows, making it ideal for a swing trade setup.
Keep Learning. Keep Earning.
Let’s grow together 📚🎯
🔴Disclaimer:
This analysis is purely for educational purposes and not a buy/sell recommendation. Always consult your financial advisor or do your own research before investing.

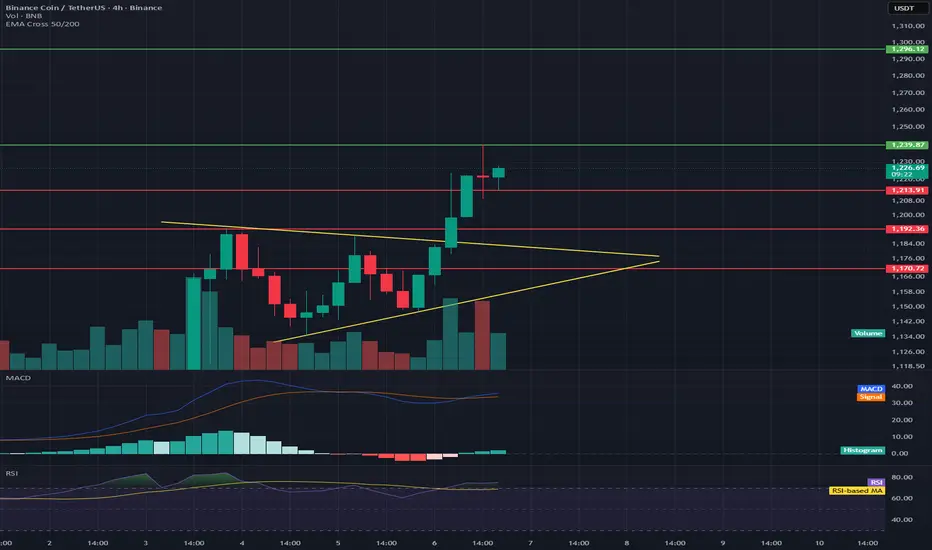
BNB/USDT 4H Chart Review📊 Market Structure
The chart shows a symmetrical triangle (yellow lines) from which a breakout occurred upwards—a classic signal of a continuing uptrend.
The price has broken above resistance at ~$1,210, which now acts as local support.
Current price: ~$1,226, following a dynamic breakout from the triangle.
📈 Key Levels
Support:
$1,210 — Retest after the breakout (important defensive level for bulls)
$1,193 — Previous local support in the triangle
$1,170 — Stronger support and lower boundary of the previous consolidation
Resistance:
$1,239 — Local resistance that has already been tested
$1,260–$1,265 — Next target upon breakout (equal movement or measuring the height of the triangle)
$1,300 — Psychological and technical resistance level
📊 Volume
The breakout was confirmed by a significant increase in volume, lending it credibility.
No sharp drop in volume after the breakout — the market remains in demand.
⚙️ MACD
The MACD is above the signal line and rising, confirming a bullish impulse.
The histogram is positive, but not excessively broad → momentum is healthy, but not overheated.
💪 RSI
RSI: ~75, which is slightly in the overbought zone.
It's worth watching for a short-term correction or retest of the $1,210 level before the uptrend becomes more established.
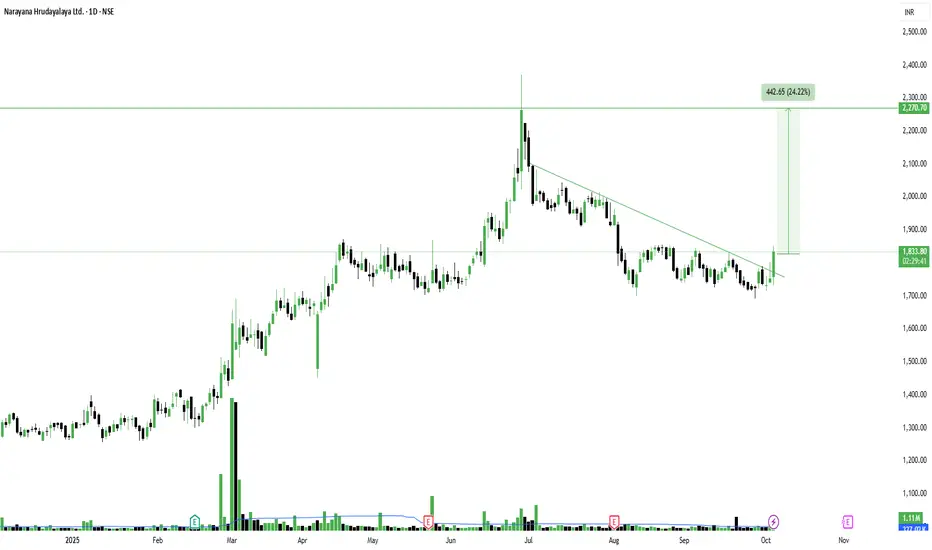
Narayana Hrudayalaya Trendline Breakout + ReversalBreakout from Downtrend Line with Volume Expansion in Narayana Hrudayalaya Ltd
#NH
📈Pattern & Setup:
Narayana Hrudayalaya has given a clean breakout above a descending trendline on the daily chart after a prolonged consolidation phase. The stock was trapped under a steady downtrend since July, but the recent breakout candle has decisively closed above resistance with rising volumes — a strong sign of institutional buying.
The overall price structure shows higher lows in the recent weeks, indicating accumulation before this breakout.
📝 Trade Plan:
Entry: Current levels between 1,820–1,835 look favorable for early entry.
🚩Stop-Loss: 1,720 (below the recent swing low).
🎯Targets:
Target 1 → 2,050 (intermediate resistance).
Target 2 → 2,270 (measured move target, nearly 24% upside potential).
💡Pyramiding Strategy:
1. Enter first lot around 1,820–1,835.
2. Add above 1,900 after continuation confirmation, trail SL to 1,770.
3. Add final lot above 2,050, trail SL to 1,900.
Ride the move till 2,270 as long as price sustains above 1,770.
🧠Logic Behind Selecting this Trade:
The setup shows a trendline breakout with expanding volume, indicating a shift from distribution to accumulation. The price action confirms renewed bullish momentum, backed by strong buying interest. After months of sideways movement, this breakout signals the potential beginning of a new rally phase.
Any dip near 1,780–1,800 can act as a retest entry zone for positional traders.
Keep Learning. Keep Earning.
Let's grow together 📚🎯
🔴Disclaimer:
This is not an investment advice. Always do your own due diligence before making any trading or investment decision.
LTC/USDT 1h short term 1. The inheritance channel (orange lines) - the course was in the downward trend, but just struck the mountain from the channel. This is a signal of short -term shift Momentum to upward.
2. Horizers of support/resistance (red and green lines):
• Support: 104.64, 103.15, 101.77 - you can see that the course reflected several times from these levels.
• Resistance: 106.05, 107.85, 109.32 - these levels are now key goals with further increases.
3. STOCHASTIC RSI (bottom of the chart) - is in the purchase zone (above 80). This suggests the possibility of short -term correction, but after struggling from the channel, the momentum can still pull the price higher before the stronger pullback occurs.
⸻
Scenarios:
✅ Taurus (continuation of stroke):
• If the price lasts above 106 USDT, subsequent goals are 107.85 and 109.32.
• Closing a few candles above 106.05 will confirm the burst and gives space for growth.
⚠️ Bear (false breakup):
• If the price does not last above 106 and returns to 104.64, the market may fall again to 103.15 and even 101.77.
⸻
Summary:
• The trend has changed to a short -term upward after having broken out of the downward channel.
• Keeping the level of 106 USDT is key - if it succeeds, there is a chance for an attack 107.85 → 109.32.
• RSI is high, so in a short time it is possible to lightly withdraw before we go higher.

BTCUSD 4h ShortTerm Chart1. Main Trend
The chart clearly shows a descending channel – the recent upward breakout failed to hold, and the price has returned to resistance.
The pattern of lower highs (LH) and lower lows (LL) continues, likely indicating a break to a lower low.
The recent high at ~$118.3k has been rejected, and the market is heading down.
2. Key Levels
Support (red lines):
$111.426 – currently being tested.
$109.408 – stronger support, previous local lows.
$108.100 and $107.356 – further potential targets if the decline deepens.
Resistance (green lines):
$115.775 – the nearest significant resistance.
$118.322 – the upper boundary of the channel and the previous LH.
USD 122,367 – a key breakout level that would reverse the trend.
3. EMA/SMA
The 50 and 200 EMAs (blue/yellow) show a bearish cross, with the price below the averages → a negative signal.
The 200 SMA (~USD 114,137) acts as strong resistance, currently unbroken.
4. Indicators
MACD: lines strongly below the line, histogram rising in the negative zone → a downtrend with a predominance of supply.
RSI: ~33, close to the oversold zone (<30), which could result in a short-term rebound, but there is no upside divergence yet.
5. Scenarios
🔴 Bearish (more likely)
Continuation of the downward move towards 109.4k → 108k → 107.3k.
A break below 107k opens the way to 103–105k (LL2 on the chart).
🟢 Bullish (less likely)
A defense of 111.4k and a return above 114.1–115.7k.
A break above 118.3k would negate the downtrend and open the way to 122k+.

BTCUSD 4H chart short-term1. Trendline breakthrough
• In the chart you have a drawn orange relegation line (downward trend).
• The current candle struck above this line, which is the first signal of a change of sentiment from short -term inheritance to more bullshit.
2. Horizers of support and resistance
• Support:
• USD 115,426
• 114,487 USD (below, strong support, where price reactions can be seen)
• Resistance:
• 116,826 USD (the price came there)
• 117,717 USD (next resistance - an important destination point, if the moment is maintained).
3. Volume
• The last candles have a growing volume when struck. This is healthy, confirms that breaking from Trendline is not "empty".
4. STOCHASTIC RSI (below)
• You can see a dynamic break from the level of sale (<20) in the direction of 60+.
• This is a signal of growth, but note: the indicator begins to enter the purchase zone. A correction may appear in the short term.
5.
• Long (aggressive): entry around the retestation around 116k as support, target ~ 117.7k, SL below 115.4k.
• Short (versus): If the price rejects 116.8-117K and returns below 116k, you can consider Shorta with Target 115.4k → 114.5k.

BNB/USDT Short-Term🔎 Current situation:
• Price: ~ 896.9 USDT.
• Trend: You can see an upward trend short -term, but now the price consolidates just below the resistance.
• Support:
• 892.8 (SMA - short -term).
• 885.5 (key horizontal support).
• resistance:
• 899.5 (local resistance, SMA #1).
• 907.9 (strong resistance - previous peak).
⸻
📊 Indicators:
• SMA: The price balances between the short (892.8) and the long average (green ~ 896). This gives a picture of the "balance point".
• MacD: The lines are close to each other, the histogram decreases → neutral signal, possible transition towards sales, if the signal line goes up above MacD.
• RSI: ~ 50–55 → neutral zone, nor purchase nor sales.
⸻
📈 short -term scenarios (1-6h):
1. Bull (more likely if it stays above 892.8):
• Breaking 899.5 → Attack on 907.9.
• If the volume increases, up to 912+ may occur.
2. Bear (if it goes below 892.8):
• decrease towards 885.5 (key level of support).
• Punction 885.5 → Movement down to 878–880.

SOL/USDT 4h chart 1. Trend:
• The price was bounced off from the yellow growth line, but it just pierced it down. This is the first signal of buyers' weakness.
2. Support (red lines):
• $ 200 - psychological level, just tested.
• 193.6 $ - stronger support if the current one cannot withstand.
• 187.4 $ - even lower, bull defense limit.
3. Resistance (green lines):
• $ 206.9 - the first greater resistance to come back up.
• 214.7 $ - stronger, where there were reflections before.
• $ 220.5 - main resistance, heavy to punctures.
4. Stoch RSI (downstairs):
• It is low → the market looks sold out, which means that there may be a chance to reflect, but there is no reversal signal yet.
⸻
👉:
Sol has lost his growth line and is now fighting to stay $ 200. If it falls lower, subsequent stops are $ 193 and $ 187. Only breaking over $ 207–214 will show the strength of buyers.

BTCUSD 4h short-term📊 Trend and structure
• You can see the price output from the downward channel (orange trend lines). This is a signal of a potential change of trend.
• The price currently oscillates around USD 112,200, i.e. above several key supports (109,000 - 111,000).
• The nearest strong resistance is around 113,450 - 114,955 USD (marked with green lines and average SMA).
⸻
📈 indicators
• MacD: MacD (blue) line pierces above the signal (orange) and the histogram grows in the plus → it is a growth signal.
• RSI: ~ 60, i.e. it grows, but is not yet entering the purchase zone (> 70). There is still room for increases.
• SMA:
• Price has pierced short -term medium (red and green lines, ~ 109–112k), which works as support.
• The next key test is SMA around $ 114,955 - a puncture could open the road to 116–118k.
⸻
🔑 key levels
• Support:
• 111.014
• 109.023
• 107.580
• resistance:
• 113,450
• 114,955
• 116,000+
⸻
📝 Summary
• short -term (4h) - signals are upward: breaking from the downward channel, positive MacD, RSI is growing healthy.
• Bull scenario: Breaking above 114,955 opens the way to 116–118k.
• Bear scenario: unsuccessful puncture 113,450/115K → possible retest support at 111K and 109k.

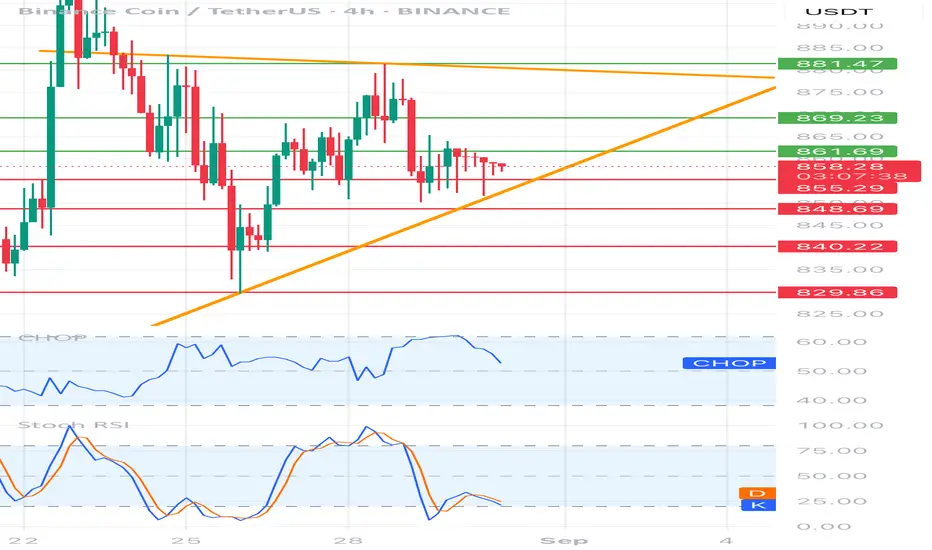
BNBUSDT 4H Chart 1. Price structure
• Current price: ~ 858 USDT
• The price moves in the clinic in a lowering (yellow lines). Upper inheritance trend (~ 881) + lower growth line (~ 848).
• We see consolidation - the market is "squeezed" between supports and resistance.
2. Horizers of support and resistance
• Support:
• 855 (local, this is where the price stopped)
• 848 (Important - lower wedge + demand level)
• 840 and 829 (key with a larger decline).
• resistance:
• 861 (first test, short -term)
• 869 (stronger resistance, earlier reflections)
• 881 (upper wedge line, strategic resistance).
3. Oscillators
• RSI (Chop) - around 50, i.e. neutral → no clear advantage of bulls/bears.
• STOCHASTIC RSI - is located at the bottom of the zone (approx. 20-25), which suggests the possibility of reflecting up (bull signal, but only after the candle confirmation).
4. Scenarios
Bullish (reflection up):
• If the price persists over 855–848 → possible reflection to 861 and 869.
• Breaking above 869 → opens the road to 881 (Test of the upper line of Klina).
• Only closure of the 4h candle above 881 → a signal of a kick from the wedge and a stronger upward movement.
Bearish (continuation of the inheritance):
• If the price drops below 848 and closes the candle at this level → strong inheritance signal, tarpapers: 840 and 829.
• 829 is key support - its bursting down can deepen the declines.
⸻
📊 Summary
BNB is now in the Departing Clinic, in the uncertainty zone:
• Maintenance 848–855 = chance of reflection.
• Punction down 848 = signal to a stronger decrease.
• Only breaking above 881 = signal of stronger growth movement.
BTC/USD 1H Short-term1. Main trend (short -term)
• The price is under the downward trend line (black line).
• Until this trend is broken up (approx.> 113,000–113,500 USD), the advantage remains on the Bear (inheritance) side.
2. Support and resistance
• The next support: 112.017 USD (if it falls → the next target is USD 111,232 and then 110.015 USD).
• The nearest resistance: USD 112,959, then USD 113,528 and a stronger level of USD 114.667.
3. Candle formation
• The last candle tests support at USD 112.017 and a defense attempt (lower wick) appears. This may suggest a short reflection, but still as part of the inheritance trend.
4. Oscillators (Stochastic RSI at the bottom of the chart)
• The indicator is in the sales zone (<20) and begins to turn up → a signal of a potential short -term reflection (SCALP LONG).
• However, if the reflection does not overcome the downward trend line, it will be just a correction rather than a change in the trend.
⸻
📊 short -term scenarios
• Bullish (reflection): If BTC maintains USD 112,000 and stochastic, he pulls up, possible traffic up to $ 112,950-13,500 (Trendline test and resistance).
• Bearish (continuation of declines): a breakdown of USD 112,000 opens the road to USD 111,200 and even USD 110,000.
⸻
📝 Application
• Trend for 1H: inheritance.
• Short -term signal: possible reflection from support (112K → 113.5k), but until the price boosts the downward trend line, the scenario of further declines dominates.
• Key level for observation: USD 112,000 (maintenance = reflection, breaking = further declines).

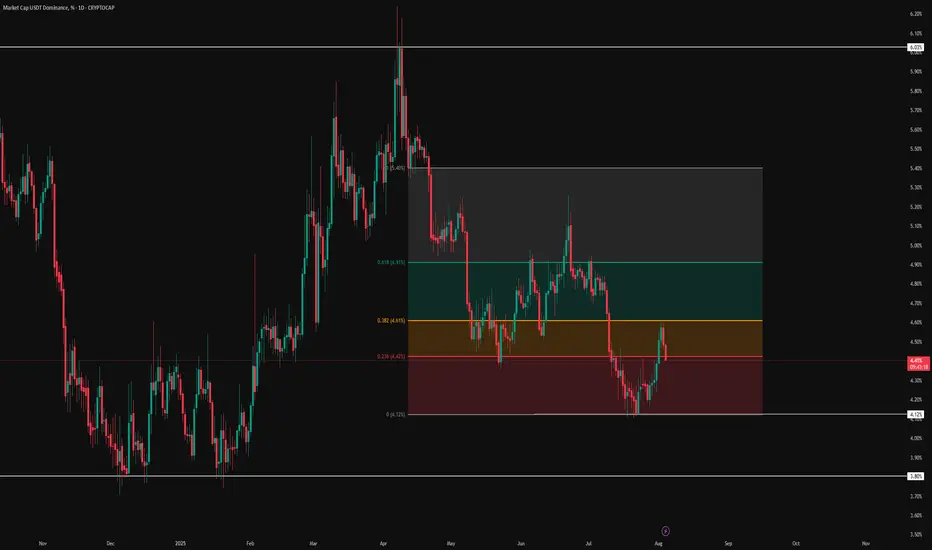
Will a Drop Below 4.12 Push BTC to New Highs ?👋 Hello, and welcome to Satoshi Frame .
📊 USDT Dominance , after a sharp move toward 6% , got rejected strongly from that level with a powerful candle .
🔻 Following that , it lost its key support and entered a deep corrective phase .
🚀 During this period, Bitcoin and altcoins experienced a strong upward trend , and 🟠 Bitcoin even recorded a new all-time high .
📉 The key support level for USDT Dominance is at 4.12% .
⚠️ If this level is broken, Bitcoin could potentially reach a new all-time high again .
📐 I’ve drawn my Fibonacci from the point where the support was lost , the structure broke , and the previous uptrend turned into a corrective or bearish trend .
🔽 The breakdown of that key support pushed USDT Dominance down to 4.12% , where we saw strong buying pressure in Bitcoin and altcoins, leading to a sharp upward movement.
🔄 Price then retraced to the 0.382 Fibonacci level (4.61%) , acting as a corrective pullback within the ongoing downtrend.
❌ However , this area triggered a rejection , and now we are witnessing another decline in USDT Dominance.
💡 Disclaimer : This analysis is for educational purposes only and should not be considered financial advice . Always do your own research and manage your risk before making any trading decisions .
BAJAJ HOUSING FINANCE LTD GOOD TIME TO PICK IT Bajaj Housing Finance Ltd. (BHFL) is a prominent non-banking financial company (NBFC) in India, specializing in housing-related finance. It's a subsidiary of Bajaj Finance Ltd., and has been classified as an Upper-Layer NBFC by the RBI under its Scale-Based Regulations.
📊 Latest Financial Highlights (Q1 FY26 Preview)
- Assets Under Management (AUM): 1.2 lakh crore, up 24% YoY and 5% QoQ
- Loan Assets: 1.05 lakh crore, up 24.2% YoY
- Disbursements: 14,640 crore, up 22% YoY
- Net Profit (PAT): Expected to rise 19–21% YoY to 574–584 crore
- Net Interest Income (NII): Estimated to grow 24–28% YoY to 827–851 crore
- Net Interest Margin (NIM): Projected at ~3.2%, slightly compressed due to rate cuts
The company is well-positioned to benefit from the rising demand for housing loans, as more people seek to buy homes. With a focus on technology and customer service, BHFL is likely to enhance its operational efficiency, attracting more clients and growing its market share. As a result, the stock price of BHFL could rise, with steady growth by its expanding loan portfolio and strong brand recognition. In 2026, its share price target would be 253, as per our analysis.
SHORT TERM VIEW
entry - 119.50-123
stop loss - 117.60
target - 135-140

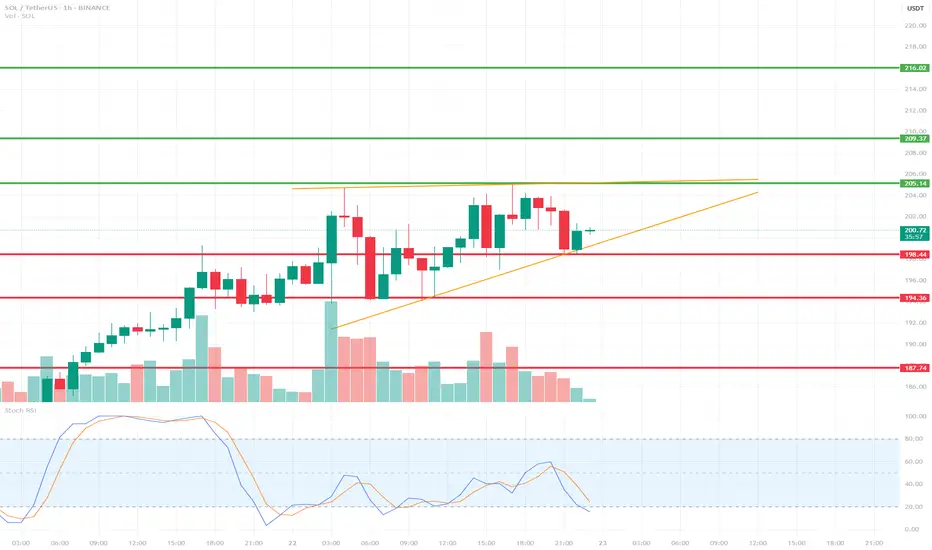
SOLUSDT 1H Short-Term🔍 Technical Structure:
Short-Term Trend:
SOL is currently in an uptrend, with local higher lows. This is evident from the orange uptrend line, which has been tested multiple times.
Local Resistance:
205.14 USDT – yellow line – a resistance level that the price has touched several times but failed to break (this could be a double-top formation).
Local Support:
198.48 USDT – the price is currently testing this level as support.
194.36 USDT – lower, more crucial support (stronger upon a trend breakout).
187.74 USDT – important support that would be tested in the event of a larger breakout.
📉 Oscillator – Stoch RSI:
The Stoch RSI is currently in oversold territory (below 20), suggesting the possibility of a local rebound.
However, there has been no upward crossover yet, so there is no strong buy signal.
🔊 Volume:
We are observing a decrease in volume during the current correction, suggesting that the declines are relatively weak – there is no strong supply impulse.
🧠 Short-term scenarios:
✅ Bullish scenario:
Price is rebounding from the trend line (orange) and the 198.48 USDT level.
A break of the 205.14 USDT resistance could open the way to:
209.37 USDT
216.02 USDT (next target)
❌ Bearish scenario:
A break of the trend line and the 198.48 USDT level with the 1-hour candle closing below.
Possible decline to:
194.36 USDT (first support)
and further to 187.74 USDT if selling pressure increases.