USDJPY❗ Sideways range📈At the moment, the price is in a sideways movement range, near the lower border. A false breakout with an exit to the top and a return to the sideways range is possible, but the scenario of a level retest with an exit to the top without a breakdown is more likely.
Have a nice trade!
Sideways

GBPUSD📈Side formation?😨today, the price has returned to the range of trading 1.373 - 1.361, further movement should form a sideways trend in this range with a further upward movement, but there is an alternative scenario - a retest of the support level with a sharp upward movement.
Have a nice trade!

BTCUSD ⚡False exit? 📉BTCUSD
At the time, bitcoin came out of the sideways and broke through the resistance level, there are no prerequisites for further growth, so the most obvious scenario is that what is happening now is a false exit from the sideways and further prospects are the strait of the lower border and back into the sideways range
Do you agree?)
Your Solldy.

NVDA: Doing the most resilient type of correction!Hello traders and investors! Let’s see how NVDA is doing today!
Technically speaking, the purple line at $ 224 is a key point for us , and if NVDA defeats this price level, it’ll turn bullish, at least for a short period of time, and we’ll seek the ATH.
Keep in mind that NVDA is in a congestion , moving sideways, and not doing anything meaningful. However, since we are near a support level, at the bottom of this congestion, the risk/reward ratio starts to get interesting again.
Let’s see the daily chart for more clues:
Yes, NVDA is quite close to another support, the 21 ema in the daily chart. As far as I know, NVDA is doing what I like to call a “ Time Correction ”. This happens when the stock goes up a lot, and it needs to rest a little. But since we are talking about such a good company, the price simply can’t drop – but it can’t go higher anymore. Then we see a sideways movement, while the 21 ema gets closer to the price: A Time Correction.
A Price Correction occurs when the price actually drops to the previous supports, like the 21 ema or the Fibonacci’s Retracements . So far, NVDA is quite resilient, and there’s nothing indicating that the bull trend will reverse.
We could seek the retracements again, yes, but we must see a stronger bearish structure in the 1h chart for that.
If you liked this analysis, remember to follow me to keep in touch with my daily updates. And please, support this idea before you go, if you really read this far!
Have a good day.

The market will not crash- Be realistic for once.Keeping it short as always- look at the touches and look at how previous trend resistance turns into support.
Moving sideways is the most realistic way of thinking of the market none of this Youtube or other analysts claiming
going back to the 1970s bs support will happen unless ultimate chaos breaks in even I will doubt it.

AXS trappedAXS has been trapped in this range last 7 days, bouncing up and down. If this rock-solid support zone is lost, we could see a solid move down, and if finally break this resistance above, we could expect a nice upside. SMA 20 and 200 are almost flattened on 30mins chart and this could be a nice base for catching the next move. Set alarms and don't miss this. Good luck traders

Dust Settles In A Trading Range (More Accumulation!)Hi all,
My last post was at the begining of the uptrend which is still in play however with a correction and sideways accumulation right under the sell wall.
That said, there's nothing concerning right now and i did not make any changes to my position.
However, since we are in a sideways trading range, we have an opportunity to take a short at the top and long at the bottom.
So, i will be looking for invalidation of an upswing at 49k before taking a short and vice versa for the downswing at 43k.
For risk management and hedging purposes, i'll not short 100% of my account, but instead between 15% - 50% and keep both positions open, unless one of them gets invalidated.
BTW, My 100k target has changed as we have continued accumulation. I'm now looking at $123k as the pnf horizontal count suggests and we keep on accumulating!
Normally i don't trade intraday charts, but this is a good opportunity i don't want to miss and besides, i'd like to practice some swing trade as i have lots of free time now :)
As always, trade safe!

BTCUSD ⚡ News for today 📈BTC broke through the $ 52,230 mark for the first time since May, breaking through the local sideways (marked on the chart with red). Further, I expect that we will reach $ 528.13, there will be a weekly pivot R2, after which we will go down to the support zone S3, S4. These are quite important levels, and if we break through them, the price will go lower - 48800, but if it pushes off, we will go up to $ 55000.
Do you agree?)
Your Solldy.

ACST.JK , trying to reverse from its down trendAfter trying to break out from its down tred, IDX:ACST now in rather sideways movement. Clearly price level 300 was being tested several times before the price plunged down to 220 on 23th August 2021.
The interesting thing is, after that date, price movement is going up; with several corrections along the way. As you can see each time the price was corrected, it was followed by weak volume. The candle was not trying to make lower low, but rather higher high.
Today, 6th September, with positive MACD, the price heading up, with also previous correction was followed by weak volume.
As per 6th September 2021:
Close price at 268
S1 264
S2 234
S3 208
R / Target 300. Would be nice if 300 can become support.

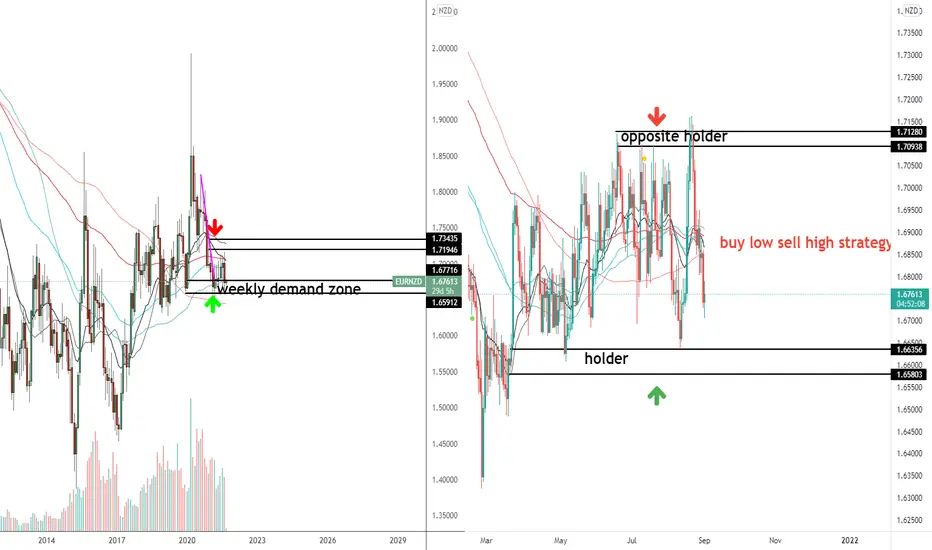
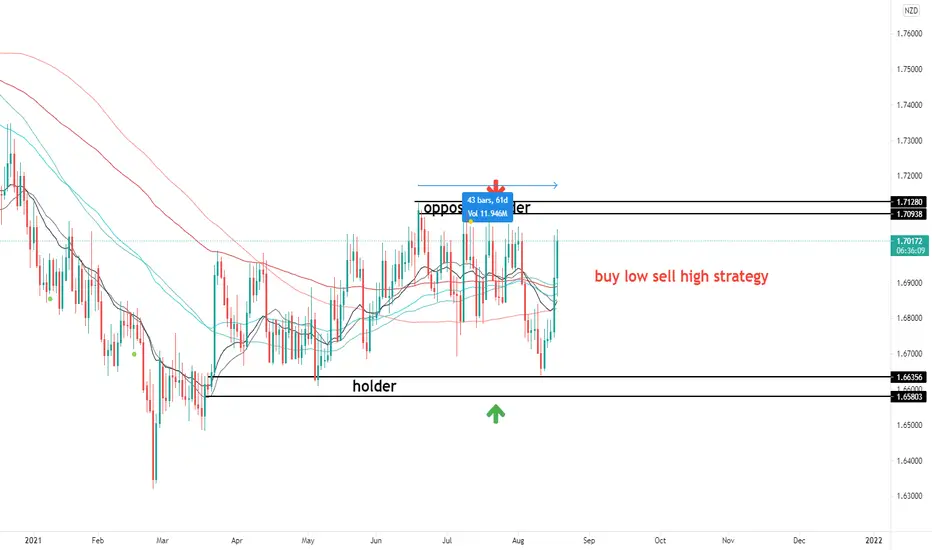
JICPT|EURNZD long setup on sideway structure!Hello everyone. On Aug 18th, I published an idea titled 'EURNZD short setup on sideways structure' . The pair had a false breakout of the upper zone before falling all the way back. Actually, there is a retest entry opportunity on the 60m. You can check the linked idea below.
Now, price has come closer to the bottom zone. We know the best trading strategy for sideways structure is buy low and sell high.
So, I set an alert for trigger.
What's your opinion? Give me a like if you're with me!
BTC approaches importance key priceH4 time frame.
Structure: Uptrend.
The upside momentum is waning as the price approaches the critical resistance at 50000.
In the bullish case, a clear move, as well as important confirmation, is needed to avoid a false breakout as the current bullish momentum is very weak.
There is a high probability that the price will continue to move the Sideway between 46000 and 49000.
Here wait for the sell signals down to the 46000 support until there is a clear breakout and confirmation.
-----------------------------------------------------------------------------------------------
Wish you all have a good trading day!

USDCAD Sideways Trading PlanUSDCAD price is going sideways after it was rejected from the resistance level. ( check Daily timeframe )
But the price is now consolidating in the support area. We are looking for a breakout. Either up or down.
2 trading plans are in motion, waiting for confirmation.
Manage your risk.
Disclaimer: This content is intended to be used and must be used for information and education purposes only. It is very important to do your own analysis before making any investment based on your own personal circumstances. Accordingly, the writer will not be liable in respect of any damage, expense, or other loss you may suffer arising out of such information or any reliance you may place upon such information.

USDJPY Daily Analysis, Market still in consolidative rangeHello everyone, as we all know the market action discounts everything :)
_________________________________Make sure to Like and Follow if you like the idea_________________________________
The USDJPY pair started this session with a Bullish move driving the price back to 110.08 from 109.74, The Bulls now are eyeing every move of the market waiting for the opportunity to push the price and close above the 110.00 levels for creating a support zone at that level that would be able to help the market back to the 111.00 level.
If we applied the Elliot wave theory to the market we can see that the market is having its 3rd impulse wave right now which could be the move that drives the price above the 111,00 level.
Different Scenarios for the market
Scenario 1 :
The price has reached the resistance zone from 109.92 - 110.08, The Bulls are trying to power up in the hope for a breakout of that zone where this could indicate a start for a next Bullish move that could lead the price near the 110.625 resistance like where the Bulls will test the Bears hoping to start a big bullish move that could lead the market back up to the 111,00 level.
Scenario 2 :
The price has reached the resistance zone from 109.92 - 110.08, The Bears are trying to take control back from the bulls in hope of driving the price back down, the battle is still going at that resistance zone, In case the Bears got control then we will see the price go down to the first support line at 109.750 where the bulls will have to defend for any hope to end this sideways move in their favor.
Technical Indicators showing :
1) The market is above the 5 10 20 100 and 200 MA and EMA (Bullish sign), but still below the 50 day MA.
2) The RSI is at 52.31 showing Neutral signs but the market does seem to be gaining more strength.
3) The ADX is at 10,16 showing that the market is not in a trending state yet, With a positive crossover between DI+ (22,14) and DI- (20,11).
Support & Resistance points :
support Resistance
1) 109.75 1) 109.92
2) 109.59 2) 110.08
3) 109.19 3) 110.62
Fundamental point of view :
A combination of supporting factors undermined the Japanese yen and assisted the USD/JPY pair to gain some positive traction for the second successive session on Monday. A goodish rebound in the equity markets dented demand for the traditional safe-haven JPY, which was further undermined by the worsening COVID-19 situation in Japan.
Apart from this, weaker PMI prints out of Japan further acted as a headwind for the JPY. Japan PMI Manufacturing eased from 53.0 to 52.4 in August and the gauge for the services sector dropped sharply from 47.4 to 43.5, marking the worst reading in 15 months. This added to worries about the economic fallout from the continuous rise in COVID-19 cases.
Bullish traders further took cues from a modest uptick in the US Treasury bond yields, tough the ongoing US dollar profit-taking slide might cap gains for the USD/JPY pair. The uncertainties tied to the COVID-19 situation might have forced investors to reassess the timing of the Fed's tapering, which, in turn, prompted some USD profit-taking. According to FXSTREET
This is my personal opinion done with technical analysis of the market price and research online from fundamental analysts and news for The Fundamental point of view, not financial advice.
If you have any questions please ask and have a great day !!
Thank you for reading.

PLTR: Complete study for the weekend (H, D and W charts)!Hello traders and investors! Let’s see how PLTR is doing today!
It is impressive, but today’s drop was just a pullback to the previous support at $ 23.69 (we hit $ 23.67), and it is reacting again. The movement was extremely technical, and it looks like a sideways correction , rather than a real sell-off.
When we look at the daily chart, we see that PLTR simple can’t drop, but since it wen’t up a lot after earnings, it can’t keep flying. A sideways correction is the best scenario for PLTR, and it is getting closer to the 21 ema now.
Since we are near the 21 ema in the daily chart, and we just retested the support at $ 23.69 in the 1h chart, I see a good buy opportunity on PLTR.
In addition, if you plan to hold PLTR for a while, the situation is looking great:
In the weekly chart, we have the classic Ignition Bar followed by a Gift candlestick pattern. The high volume reinforces this incredibly bullish pattern. I bought PLTR around the $ 20s with my followers, but if you ask me, there’s still time to buy it , even after it is going up almost 20% for us.
We have a pivot point at $ 27.47 (red line), and if PLTR defeats it, the $ 45 is the next technical target. Therefore, there’s a lot of room for PLTR to go up.
If you liked this analysis, remember to follow me to keep in touch with my daily updates on stocks and indices.
Have a good weekend!

JICPT| EURNZD short setup on sideways structureHello everyone. This is a pretty simple sideway trading strategy.
The range is 1.6580-1.7128 which has been respected 61 days. I already set the alerts around the bottom and the top. The scenario might be as below:
1. Sideway continuation : Price could go through the upper zone. Looking for bearish formation on 1H or 4H chart. Target is the opposing zone.
2. Sideway terminated with strong momentum to the upside : Momentum is strong and zone got violated. I plan to long for the pullback.
Sideways structure are easy to trade. In one word, buy low & sell high. It works until it doesn't. That's fine.
Give me a like if you're with me.
Doge coin is trading in channelDogecoin has been trading in fix range, if the Doge break this channel then there will be a clear path to touch $0.30 which is more than 15 % up from the current price.
Doge is perfectly bouncing back from the 21 EMA and 50 EMA which is good signal to add more.

BTC Bouncing Around Between the 200 SMA and 200 EMA, Daily ChartThe chart shows the potential for some further sideways movement as a game of price ping pong plays out. Price seems to be respecting these two moving averages.

significant resistance for ETHETHUDT chart shows that ETH should breaks the significant resistances.

Adanient - Elliott wave analysis - ABC correction Adanient is in sideways complex B wave correction and can go up to 1600-1635 zone before it will end it and start moving down for C leg. Above trend channel of abc move (last leg) it can go up to mentioned level of even slight higher. If it failed to go above W wave high of B, then there is a possibility of triangle as B wave.

JICPT| Gold continues sideways, waiting for job data tomorrowHello everyone. It's been a bit wild for gold those days. Currently it's siting in the middle of a range between 1792 and 1833 for about one month.
In my opinion, the Non-farm payroll data may give us a clue of where the price might go. According to forexfactory, the forecasted data for NFD and unemployment rate is 870K and 5.7%. So there are two possible scenarios as below:
1. The data is better than forecast: It indicate economy is better than expected. Fed may hike rate sooner, so bad news for gold and possibly stock index as well, e.g. Nasdaq. The bottom of the range may be violated. I tend to have bearish setup in this situation.
2. The data is worse than forecast: It indicate economy is not so good as expected. The possibility of raise interest rate is low. Good news for bullish gold buyers. The supply zone may be penetrated. I would prefer to bullish setup in this scenario.
To make things simple, I ignored mixed results. For example, the NFP is worse and unemployment is better, or vice versa. In addition, 'Average Hourly Earnings m/m' may also impact the markets as higher earning suggested higher inflation.
If it's too hard to trade the news. I recommend you waiting for 15 or 30 mins before jumping in new trades. Or, trade unrelated stuff, like cross currency pairs , e.g. CADJPY.
Trade safe and stay safe. Give me a like if you're with me.

Volume ProfileAs I mentioned in previous posts, #BTC reached a significant resistance. It seems that it tends to touch the middle of the side-way zone. considering the volume profile of the last up trend within this side-way region, one can see the important levels. I believe that regions around $38200, $34200 and $32200 are possible targets for down trend.
According to the volume profile, there are many orders around $42000. So, this zone could be stop hunter region where BTC just hit it by a shadow(wick) not to break it.
I would be glad to have your comments and ideas.
please leave me your comments

Looks like there could be some sideways movementMy publishing are for my personal references and made public for anyone that can find it useful.
Any opinions are welcome
Looks like we are entering a bullish trend for GRT
Support held up well and broke through the trendline while doing it
I am looking to trade this up until the resistance line where I would most likely sell and wait for the next move(depending on price action I could hold longer because there is a possibility of it going to the $2.20 mark)
I currently hold a position that I will be adding more to especially if it drops which it most likely will(im thinking in the .50-.55 range)
I like the odds on this one for a nice sideways movement
I will be holding this position for 3+ months or longer until one of these targets are hit.
I am not using any stop loss because I will just be adding to my position if it does not immediately just hit the target(you never know)
Thank you for checking it out!
There is a strong resistance at the .78 range which needs to be broken to hit the next target.

Two key resistances broken, The daily resistance (blue one) and the weekly resistance (black one) have just broken. The next stop will be $47800 in my estimation but, It’s also possible to have a sideways trend before.
If the price could stay above $40k , the next target will be $47800 .
Trend Key Points Indicator have been used to draw important key levels and key points.
