SLPUSDT.P - October 31, 2025SLPUSDT.P is maintaining a clear bearish structure, continuing to form lower highs beneath the descending trendline. Price action remains under pressure after a recent retest rejection near the $0.00116 area, suggesting limited bullish strength. The active short setup targets the $0.00084 profit level, with a stop placed at $0.001836 to protect against invalidation of the current bearish bias. Overall, this is a moderate-risk short opportunity, favoring continuation of the prevailing downtrend as long as price remains below the trendline resistance.
Signal

PUMPUSDT.P - October 31, 2025PUMPUSDT.P is displaying a corrective pullback within a broader bearish structure, currently testing the $0.00480 zone where a sell short limit order is positioned. Price action suggests a potential lower high formation, with downside continuation favored toward the $0.00330 target. The invalidation lies above $0.00555, maintaining a clear risk boundary. Overall, this represents a moderate-risk short setup, dependent on rejection confirmation from the immediate resistance zone to validate continued bearish momentum.

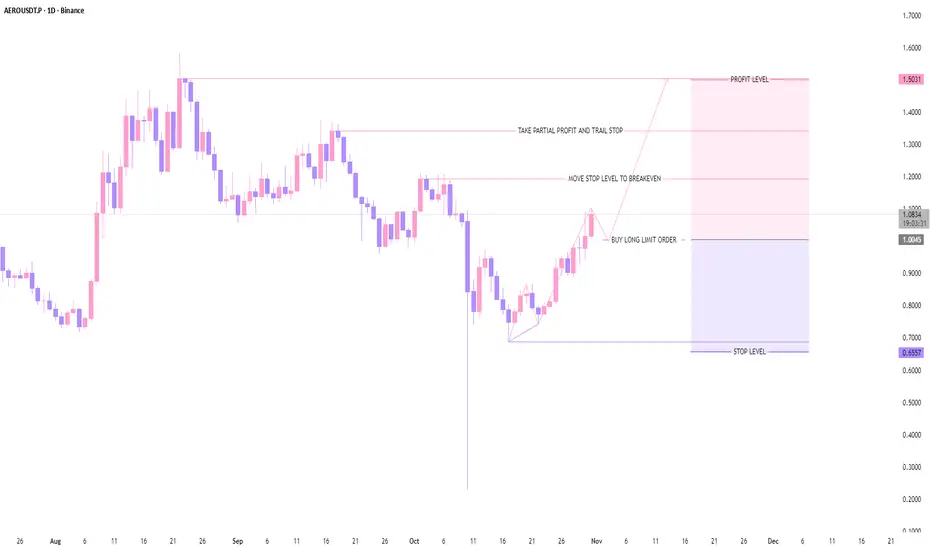
AEROUSDT.P - October 31, 2025AEROUSDT.P is forming a potential higher low structure above the $1.00 support zone after a strong impulsive leg, signaling sustained bullish momentum within the developing uptrend. The planned long entry at $1.0045 targets $1.5031, with stop placement at $0.6557 to maintain a favorable risk-to-reward profile and clear structure-based invalidation. Overall, this is a medium-risk setup, as it relies on the continuation of the current bullish structure and confirmation of demand holding near the $1.00 zone.
Graph link (GLQ)Glq usdt Daily analysis
Time frame daily
Risk rewards ratio >3 👈👌
Target =0.0162 $
Technical analysis
GLQ, as you can see in the image, had been moving within a descending channel for several months.🐻❄️ It eventually broke below the lower boundary of this descending support, signaling a potential drop to traders. Surprisingly, however, the yellow support zone you can see in the chart held very strongly — even after four separate tests, it did not break. This area will be the most important support zone for me, and I do not expect it to be broken at all. Even during the massive crash two weeks ago, when almost all coins experienced drops of up to 70%, this support remained intact.

AAPL Apple Options Ahead of EarningsIf you haven`t bought the dip on AAPL:
Now analyzing the options chain and the chart patterns of AAPL Apple prior to the earnings report this week,
I would consider purchasing the 255usd strike price Calls with
an expiration date of 2025-11-21,
for a premium of approximately $18.65.
If these options prove to be profitable prior to the earnings release, I would sell at least half of them.

TAOUSDT.P - October 30, 2025TAOUSDT.P is forming a potential lower high structure near the $449–$460 resistance zone, indicating weakening bullish momentum after a corrective rally. The planned short entry aligns with a bearish continuation setup targeting $408, with invalidation above $482 suggesting a clear risk-defined trade. Overall, this is a medium-risk setup given the proximity to resistance and the need for confirmation of rejection before entry.

Bullish? Maybe This Will Change Your Mind About ETHHi guys,
This monthly inverse chart should make things clear to you that the market is about to crash hard!
Everyone is so bullish and Microstrategy just announced another BTC purchase which is a huge RED ALERT for all crypto investors.
Stay safe and let me know what do you guys think about this !

AUDUSD: Long Signal Explained
AUDUSD
- Classic bullish pattern
- Our team expects retracement
SUGGESTED TRADE:
Swing Trade
Buy AUDUSD
Entry - 0.6552
Stop - 0.6540
Take - 0.6575
Our Risk - 1%
Start protection of your profits from lower levels
Disclosure: I am part of Trade Nation's Influencer program and receive a monthly fee for using their TradingView charts in my analysis.
❤️ Please, support our work with like & comment! ❤️

GBPJPY Buyers In Panic! SELL!
My dear subscribers,
GBPJPY looks like it will make a good move, and here are the details:
The market is trading on 202.70 pivot level.
Bias - Bearish
My Stop Loss - 203.05
Technical Indicators: Both Super Trend & Pivot HL indicate a highly probable Bearish continuation.
Target - 202.02
About Used Indicators:
The average true range (ATR) plays an important role in 'Supertrend' as the indicator uses ATR to calculate its value. The ATR indicator signals the degree of price volatility.
Disclosure: I am part of Trade Nation's Influencer program and receive a monthly fee for using their TradingView charts in my analysis.
———————————
WISH YOU ALL LUCK

GOLD: Short Trade Explained
GOLD
- Classic bearish formation
- Our team expects fall
SUGGESTED TRADE:
Swing Trade
Sell GOLD
Entry Level - 3972.9
Sl - 3987.4
Tp - 3944.7
Our Risk - 1%
Start protection of your profits from lower levels
Disclosure: I am part of Trade Nation's Influencer program and receive a monthly fee for using their TradingView charts in my analysis.
❤️ Please, support our work with like & comment! ❤️

EURUSD What Next? BUY!
My dear followers,
I analysed this chart on EURUSD and concluded the following:
The market is trading on 1.1608 pivot level.
Bias - Bullish
Technical Indicators: Both Super Trend & Pivot HL indicate a highly probable Bullish continuation.
Target - 1.1636
About Used Indicators:
A super-trend indicator is plotted on either above or below the closing price to signal a buy or sell. The indicator changes color, based on whether or not you should be buying. If the super-trend indicator moves below the closing price, the indicator turns green, and it signals an entry point or points to buy.
Disclosure: I am part of Trade Nation's Influencer program and receive a monthly fee for using their TradingView charts in my analysis.
———————————
WISH YOU ALL LUCK

GOLD Under Pressure! SELL!
My dear subscribers,
My technical analysis for GOLD is below:
The price is coiling around a solid key level - 4023.4
Bias - Bearish
Technical Indicators: Pivot Points High anticipates a potential price reversal.
Super trend shows a clear sell, giving a perfect indicators' convergence.
Goal - 3987.3
My Stop Loss - 4041.7
About Used Indicators:
By the very nature of the supertrend indicator, it offers firm support and resistance levels for traders to enter and exit trades. Additionally, it also provides signals for setting stop losses
Disclosure: I am part of Trade Nation's Influencer program and receive a monthly fee for using their TradingView charts in my analysis.
———————————
WISH YOU ALL LUCK

USDCHF Massive Short! SELL!
My dear friends,
Please, find my technical outlook for USDCHF below:
The instrument tests an important psychological level 0.7972
Bias - Bearish
Technical Indicators: Supper Trend gives a precise Bearish signal, while Pivot Point HL predicts price changes and potential reversals in the market.
Target - 0.7958
Recommended Stop Loss - 0.7980
About Used Indicators:
Super-trend indicator is more useful in trending markets where there are clear uptrends and downtrends in price.
Disclosure: I am part of Trade Nation's Influencer program and receive a monthly fee for using their TradingView charts in my analysis.
———————————
WISH YOU ALL LUCK

CHFJPY Set To Grow! BUY!
My dear friends,
CHFJPY looks like it will make a good move, and here are the details:
The market is trading on 190.75 pivot level.
Bias - Bullish
Technical Indicators: Supper Trend generates a clear long signal while Pivot Point HL is currently determining the overall Bullish trend of the market.
Goal - 191.50
About Used Indicators:
Pivot points are a great way to identify areas of support and resistance, but they work best when combined with other kinds of technical analysis
Disclosure: I am part of Trade Nation's Influencer program and receive a monthly fee for using their TradingView charts in my analysis.
———————————
WISH YOU ALL LUCK

BTCUSDT.P - October 30, 2025BTCUSDT.P - In-depth analysis | 1D Timeframe
Trend Structure:
The market is currently consolidating after a notable uptrend that peaked near the $127,000 zone. Recent weekly candles display lower highs and moderate-bodied structures, suggesting a weakening bullish impulse. The current range is bounded by resistance at $126,200–$132,900 and support at $101,500, with a deeper structural support near $74,450.
Trend Strength:
Trend momentum is weak, indicated by a low strength reading. The loss of directional follow-through implies the market is entering a mid-cycle cooling phase or secondary correction within a broader bullish structure.
Volatility Conditions:
Volatility remains moderate, reflecting an equilibrium between buyers and sellers. This volatility profile typically precedes a breakout move after extended consolidation.
Squeeze:
Current market condition suggests energy buildup and potential for a decisive breakout in the coming weeks.
Bias:
Given the weakening trend and active squeeze near mid-range support, the near-term bias is SHORT, targeting potential tests of the $101,500 level before any renewed bullish continuation can be confirmed above $126,000.

PENGUUSDT.P - October 30, 2025Bullish Bias: PENGUUSDT.P is consolidating near the $0.019 support zone, showing potential accumulation after a prolonged downtrend. A breakout above $0.0269 would confirm bullish momentum and open room toward $0.0325 as the next resistance.
Bearish Bias: Price remains in a clear downtrend with lower highs and lows, and sustained weakness below $0.019 would likely trigger continuation toward the $0.009 region. Until a confirmed breakout occurs, momentum favors sellers.
The token is currently in a volatility squeeze, indicating that a big move in either direction is coming anytime soon.

SBUX Starbucks Corporation Options Ahead of EarningsIf you haven`t bought SBUX ahead of the previous earnings:
Now analyzing the options chain and the chart patterns of SBUX Starbucks Corporation prior to the earnings report this week,
I would consider purchasing the 84usd strike price Puts with
an expiration date of 2025-10-31,
for a premium of approximately $3.20.
If these options prove to be profitable prior to the earnings release, I would sell at least half of them.

NZDUSD: Bearish Continuation & Short Trade
NZDUSD
- Classic bearish formation
- Our team expects pullback
SUGGESTED TRADE:
Swing Trade
Short NZDUSD
Entry - 0.5800
Sl - 0.5808
Tp - 0.5786
Our Risk - 1%
Start protection of your profits from lower levels
Disclosure: I am part of Trade Nation's Influencer program and receive a monthly fee for using their TradingView charts in my analysis.
❤️ Please, support our work with like & comment! ❤️

xauusd 3894 or 4060 today?October 29, 2025, XAU/USD has specific price targets. The gold price is currently around $4,018, and traders are focusing on key technical levels and the upcoming Federal Reserve interest rate decision.
Below is a summary of the key price levels to watch before the market closes today.
Analysis Type Key Resistance Key Support Primary Target Alternative Target
Technical & Scenario-Based $4,005.79 $3,951.68 $4,059.90 - $4,114.01 (if resistance breaks) $3,893.96 (if support breaks)
Bearish Correction - $3,940 $3,870 -
Range-Bound $4,010 $3,860 Movement between $3,860 and $4,010 -
🚨 Key Market Driver Today
The single most important event influencing gold's movement today is the Federal Reserve's interest rate decision. Markets are overwhelmingly expecting a 25-basis-point rate cut, and how the market reacts will depend heavily on the tone (dovish or hawkish) set by Fed Chair Jerome Powell.
Dovish Signal (Bullish for Gold): If the Fed signals openness to further easing, it could weaken the US Dollar and help push gold above the $4,005 resistance toward the higher targets.
Hawkish Signal (Bearish for Gold): If the Fed suggests this cut is a "one-and-done" move, it could strengthen the Dollar and trigger a sell-off in gold, pushing it down to test the $3,951 support and potentially lower.
💡 A Note for Your Trading
Conflicting Signals Exist: While one technical model suggests a potential rise to $4,010, another maintains a bearish outlook with a target of $3,870, contingent on the price staying below $3,940. This highlights the market's uncertainty ahead of the Fed news.
Trade the Reaction: Many analysts advise waiting for the price to convincingly break through one of the key levels ($4,005 resistance or $3,951 support) before committing to a new trade direction, rather than anticipating the move prematurely.
In summary, for the remainder of today's session, watch the $4,005 resistance and $3,951 support levels. The Fed's announcement will likely determine whether the price moves towards $4,060 or falls back to $3,894.

xauusd next target 4161?the next target for XAU/USD (Gold) is highly dependent on its ability to break through key resistance levels, with an immediate focus on the $4,161 area. The upcoming Federal Reserve policy meeting is the primary catalyst that will determine the direction.
The table below summarizes the key price levels and potential targets you should watch.
Timeframe Key Support Key Resistance Bullish Target (if resistance breaks) Bearish Target (if support breaks)
Short-Term $4,004, $3,951 $4,050, $4,161 $4,200 → $4,300 → $4,381 (All-Time High) $3,944 → $3,900
Medium-Term (e.g., 1-3 months) $3,874 - $3,878 - $4,249 - $4,300+ -
🚀 What Will Drive the Next Move?
The consensus among analysts is that the immediate price direction hinges almost entirely on the Federal Reserve's upcoming meeting and subsequent commentary.
The Primary Catalyst: The Federal Reserve
The Rate Decision: A 25-basis-point rate cut is almost fully priced in by the market. Therefore, the decision itself is unlikely to cause a major surprise .
What Really Matters: Powell's Tone: The market will react to the forward guidance from Fed Chair Jerome Powell during his press conference.
Dovish Powell (signaling potential for further easing): This would likely weaken the US Dollar and push gold above $4,161, opening the path toward $4,200 and $4,300 .
Hawkish Powell (suggesting a "cut and pause" approach): This could strengthen the Dollar and trigger a sell-off in gold, pushing it below $4,004 to test the $3,944 - $3,900 support zone .
Supporting Factors
Central Bank Demand: Ongoing accumulation of gold by central banks (e.g., India, China, Germany) provides a solid foundation, limiting severe downside moves.
Geopolitical Tensions: Factors like trade tariffs and global instability continue to bolster gold's role as a safe-haven asset.

EURCAD Will Explode! BUY!
My dear subscribers,
This is my opinion on the EURCAD next move:
The instrument tests an important psychological level 1.6228
Bias - Bullish
Technical Indicators: Supper Trend gives a precise Bullish signal, while Pivot Point HL predicts price changes and potential reversals in the market.
Target - 1.6286
About Used Indicators:
On the subsequent day, trading above the pivot point is thought to indicate ongoing bullish sentiment, while trading below the pivot point indicates bearish sentiment.
Disclosure: I am part of Trade Nation's Influencer program and receive a monthly fee for using their TradingView charts in my analysis.
———————————
WISH YOU ALL LUCK

ABTUSDT - October 29, 2025The market structure remains bearish, with the token historically losing significant value during downturns and showing limited signs of recovery. A potential short setup could emerge following a manipulated upside move, with optimal short entries near resistance and profit targets around the $0.0530 level.

COAIUSDT.P - October 29, 2025The chart exhibits a strong bearish trend with sustained lower highs and lows, indicating continued downside momentum. Expecting potential continuation toward the lower target near $0.01 — I am basically shorting this until it loses 99% of its market cap.
